Spanish
  Chinese
  Russian
  German
  French
  Japanese
  Portuguese
  Hindi
Hindi Research Article, J Chem Appl Chem Eng Vol: 7 Issue: 4
Adsorption of Cu (II) Ions from Aquatic Environment Using Pre-irradiated ETFE Film
Shahnaz Sultana1*, Nazia Rahman1, Nabul Sardar1, Mobin Sikder2, Sapan Kumar Sen3, SM Shakila Satter Rini2 and Mim Mostakima Mila2
1Department of Nuclear and Radiation Chemistry, Institute of Nuclear Science and Technology, Dhaka, Bangladesh
2Department of Chemistry, Jahangirnagar University, Dhaka, Bangladesh
3Department of Electronics, Institute of Electronics, Dhaka, Bangladesh
- *Corresponding Author:
- Shahnaz Sultana
Department of Nuclear and Radiation Chemistry,
Institute of Nuclear Science and Technology,
Dhaka,
Bangladesh;
E-mail: shahnazju32@gmail.com
Received date: 17 May, 2023, Manuscript No. JCACE-23-99008;
Editor assigned date: 19 May, 2023, PreQC No. JCACE-23-99008 (PQ);
Reviewed date: 02 June, 2023, QC No. JCACE-23-99008;
Revised date: 17 July, 2023, Manuscript No. JCACE-23-99008 (R);
Published date: 24 July, 2023, DOI: 10.4172/2576-3954.1000038
Citation: Sultana S, Rahman N, Sardar N, Sikder M, Sen SK, et al. (2023) Adsorption of Cu (II) Ions from Aquatic Environment Using Pre-irradiated ETFE Film. J Chem Appl Chem Eng 7:4.
Abstract
Although Copper (Cu) is a very beneficial metal, having too much of it in the body can cause lung issues, severe anemia, nausea, and vomiting. In order to extract Cu (II) ions from aqueous solution, an adsorbent was constructed in this study employing pre-irradiation grafted ETFE film. The grafting method was used to binary monomers of Sodium Styrene Sulfonate (SSS) and Acrylic Acid (AA), where NaCl served as an additive. The grafted polymer was also subjected to studies of tensile strength, water uptake, surface area extension, Scanning Electron Microscopy (SEM) and Fourier Transform Infrared spectroscopy (FTIR). The adsorption of Cu (II) was investigated with respect to pH, starting metal ion concentrations, contact time, monomer concentrations, and temperature. With 50 kGy of radiation dose, 4% NaCl and 30% of monomer solution (SSS: AA=1:2) in water generated the highest graft yield of 470%. The maximum adsorption capacity (412 mg g-1) was discovered with an initial concentration of 2500 ppm, a pH of 4.86, and a contact time of 24 hours at room temperature (25°C). A monolayer adsorption was recommended by the good linking between experimental data and the Langmuir Isotherm model. The kinetic adsorption data closely fitted with the pseudo second order reaction. Due to its increased adsorption capacity and reusability, the synthesized new grafted polymer can be considered as an efficient adsorbent for Cu (II) removal from wastewater.
Keywords: Cu (II); Adsorption capacity; ETFE film; FTIR; Reusability
Introduction
One of the most serious environmental issues is the presence of heavy metals in water systems. They are non-biodegradable and extremely poisonous, and they can harm aquatic life and the quality of water supplies. These substances can accumulate through the food chain even at low amounts, affecting animals, plants, and ultimately human health. One of these substances, such as copper, can be harmful to human health when present in excess. This metal is widely dispersed because it is introduced into the environment both naturally and mostly through human activities. The "Wilson disease" is brought on by an excess of copper in humans and can result in lung problems, acute anemia, nausea, and vomiting. Additionally, it harms the kidneys and causes coma, stomach and intestinal distress [1]. According to WHO, 2 ppm is the maximum concentration of Cu (II) that should be present in drinking water [2]. They are not only harmful to humans, but they can also seriously harm the aquatic ecosystem. Thus, efficient Cu (II) recovery from aqueous solution and sea water is crucial for safeguarding both humans and the ecosystem's biodiversity. To remove heavy metals from aqueous solution, a number of treatment strategies, including solvent extraction, ion exchange, adsorption, and precipitation have been proposed and used [3-5]. The most well liked technology among these is adsorption [6].
Numerous ligands have been researched to date, including imidazole, amidoxime, and phosphoryl groups [7]. These organic ligands improve the capacity and selectivity of adsorption for metal ions that are chemically or firmly bound to adsorbents. In addition to these ligands, solid carriers are essential components of adsorbents since they must completely sustain adverse conditions such as high pH, temperature, and radiation dose. These polymers should also have adequate surface area and structure to allow for covalent connections between active groups on their structures. Graft polymer has recently emerged as a significant asset in the area of heavy metal removal from aqueous solution [8]. Because the adsorbent in this situation has a higher adsorption capacity and can be reused, the possibility of secondary pollution is decreased. This process involves attaching the functional monomers to the parent polymer chain via covalent bonds. This procedure is the most effective because it enables the grafted monomer to perform a variety of activities on the parent polymer without affecting the parent polymer's mechanical properties [9]. The broad penetration of the polymer chain and the quick and uniform production of radicals make the radiation induced grafting approach favorable [10].
Various materials, including PE, PP, PET, PTFE, graphene oxide, natural polymers, etc., were utilized in the past as parent polymers [11-13]. Due to its mechanical qualities, ETFE film, which was used as the mother polymer in the current experiment, is primarily used in the nuclear and aerospace industries for cable wraps and wire coatings. In this study, Acrylic Acid (AA) and Sodium Styrene Sulfonate (SSS) were used as monomers where NaCl acted as an additive onto ETFE. Zu, et al. used the same monomers without using additive whereas ETFE was irradiated by an electron accelerator and the grafted ETFE film was applied as a cation exchange membrane [14].
To determine whether the ETFE film could be used as an absorbent, the film was first characterized. Later, the adsorption capacity was assessed under a variety of conditions of pH, contact time, copper concentrations, monomer concentrations, and temperature. Adsorption isotherms were investigated to clarify the likely adsorption mechanism and to provide information regarding maximum sorption capacity, sorption energy, homogeneity/heterogeneity, affinity between sorbent and adsorbent that might help in understanding the process taking place.
Materials and Methods
The base polymer, ETFE was collected from Sigma Aldrich, USA. Two monomers, AA and SSS were also purchased from sigma Aldrich, USA. NaOH, NaCl, HCl, Cu (II) sulfate were supplied by Merck, Germany. All glassware used in this experiment was cleaned properly at room temperature and dried in an oven at 60℃. In this case, Distilled Deionized (DDI) water was used for both washing and preparing solution. pH, EC, and TDS values of the DDI water were 6.7, 0.2 μS, and 0.1 mgL-1 respectively. Table 1 displays some of the mother polymer's fundamental characteristics.
| Backbone polymer | ETFE |
|---|---|
| Type | Film |
| Color | White |
| Thickness | 0.025 mm |
| Size | 300 × 300 mm |
| Water uptake | 00 (%) |
| Tensile strength | 66 MPa |
Table 1: Properties of backbone polymer.
Instruments and apparatus
The Co (60) gamma irradiator from the institute of food and radiation biology, atomic energy research establishment, Savar, Dhaka, Bangladesh, was used to regulate the dose rate during the synthesis of the graft copolymer. It was a 90 kCi batch type panoramic irradiator with a dosage rate of 13.7 kGyh-1 that was collected from BRIT, India. Utilizing IRPrestige21 from Shimadzu corporation, Japan, investigation of FTIR-ATR in the wavenumber range of 700-4000 cm-1 was accomplished. Scanning electron microscopy was used to measure the change of surface morphology after grafting, the model used in this study was JSM-6490LA, JEOL. The concentrations of Cu (II) ion of different solutions were analyzed by UV-VIS Spectrophotometer (model: UV2401PC from Shimadzu, Japan). Mechanical Stability was determined by a universal testing machine testometric, model M 500-100 CT, UK. During this experiment, the crosshead speed was 2 mm/min, gauge length was 20 mm, and load range was 250 N.
Preparation of sulphonated ETFE adsorbent
Figure 1 shows the newly developed polymeric adsorbent's preparation procedure. The ETFE strips were cut into pieces sized 2.5 cm by 4 cm, cleaned in DDI water and acetone, dried in a vacuum oven at 50℃, and weighed (W0). The monomer solutions were all made by combining SSS and AA in a 1:2 (SSS: AA) ratio. By mixing 4% NaCl solution in DDI water with various SSS and AA compositions, several combinations, including 9%, 13.5%, 15%, 18%, 24%, and 30%, were created. The cobalt-60 (60Co) irradiator was used to apply a 50 kGy dose of gamma radiation to polymer strips. In contrast, even after several weeks and at high temperature, the ETFE films in the monomer solution remained unchanged without the preirradiation. The irradiation films were then quickly maintained under dry ice conditions. In the meantime, argon gas was bubbled in gas washing bottles containing monomer solutions for 40 minutes at room temperature. Following that, each of the two irradiated films was placed into a 25 mL airtight vial with a bubbled mixture as soon as possible to prevent the oxidation of the air. After that, the grafting reaction was allowed to complete for 5 hours in a water bath at 80℃. After being washed many times to get rid of homopolymers and unreacted monomers, the films were ready to be used as adsorbents. The ETFE-g-AA-SSS strips were weighed (W1) after being dried in the vacuum oven at 50℃. The Grafting Yield (GY) of the grafted ETFE adsorbent was calculated gravimetrically as follows:
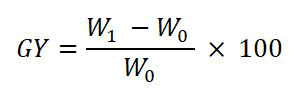
The method became simpler by the fact that no inhibitor was added during the grafting process and the adsorbent didn't need to be treated. Moreover, by appropriately varying the irradiation and reaction parameters, the amount of the grafted moiety can be managed. Figure 1 depicts a flowchart diagram showing how grafted ETFE film was prepared.

Figure 1: Flow chart diagram of the preparation of ETFE-g-AASSS film.
Basic properties of grafted ETFE films
Thickness (mm) and surface area extension (%)
The thickness and surface area changed after grafting. Surface area extension (%) was calculated by the following formula:
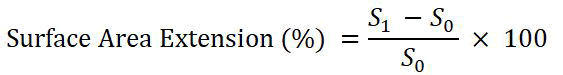
Where,
S1 and S0 are the surface areas of the grafted and pure films respectively.
Water uptake (%)
By immersing the grafted film in 40 mL of DDI water at 60℃ for one hour, water uptake was monitored. After that, a soft tissue was used to carefully remove the weight of the wet layer from the surface water. Water uptake was measured gravimetrically by the following formula:

Where,
Ww and Wd are the weights of the wet film and dry film respectively.
Tensile strength
Tensile properties of different films were measured using universal testing machine (testometric, model M 500-100CT, UK). The crosshead speed and gauge length used were 2 mm/min and 20 mm respectively with load range 250 N throughout the experiment. The adsorbents were cut into 2 cm vs. 14 cm pieces to measure mechanical property. Tensile strengths were measured after water uptake. After radiation grafting the flexibility of the film increased causing decrease of tensile strength. The rigidity of the produced membranes reduced as grafting yield, volume, and surface area increased.
Adsorption Capacity (AC)
The total metal ion Adsorption Capacity (AC) of the synthesized copolymer for Cu cations was calculated using the following formula:
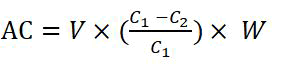
Where, AC is the adsorption capacity (mg g-1 of adsorbent). W is the weight of the grafted PE film (g). V is the volume of Cu solution (L). C1 and C2 are the concentrations (mgL-1) of the metal ions before and after adsorption.
Regeneration and reuse study
The adsorbent can be regenerated after adsorption by desorption with certain solvents. Regeneration efficiency (%) can be calculated by the following formula:

Results and Discussion
Physico-chemical properties of the grafted ETFE films
After grafting, the physico-chemical characteristics of the ETFE films underwent transformation. Table 2 shows several physicochemical characteristics of the grafted ETFE film. Despite a decline in tensile strength, the extent of grafting, surface area extension, and water uptake increased dramatically. The degree of grafting grew rapidly from 4.5% to 470% and the surface area extension also showed the same trend from 0.15% to 60% with the monomer concentration of 9 % to 30% in water. The thickness rose significantly from 0.025 mm (pure ETFE) to 0.028 mm (470% grafted ETFE). Water uptake also raised from 0.44% to 210.62% with monomer solutions because of the increase of the swollen property due to the additional hydrophilic sites. These findings are consistent with those reported in the prior research [15,16]. However, as the degree of grafting increased, the tensile strength decreased from 65 MPa (at 4.5% GY) to 60 MPa (at 190% GY), indicating that the prepared adsorbents became more flexible in general.
| No. | Monomer conc. % in H2O | Monomer ratio in H2O (SSS%: AA %) | Dose rate (kGy) | GY (%) | Thickness (mm) | Surface area extension (%) | Water uptake (%) | Tensile strength (MPa) |
|---|---|---|---|---|---|---|---|---|
| 1 | 9 | 1:2 (3:6) | 50 | 4.5 | 0.025 | 0.15 | 0.44 | 65 |
| 2 | 12 | 1:2 (4:8) | 50 | 12.5 | 0.025 | 5 | 4.13 | 65 |
| 3 | 13.5 | 1:2 (4.5:9) | 50 | 60 | 0.026 | 10 | 17.99 | 60 |
| 4 | 15 | 1:2 (5:10) | 50 | 190 | 0.027 | 20 | 86.61 | 60 |
| 5 | 18 | 1:2 (6:12) | 50 | 265 | 0.027 | 30 | 72.36 | - |
| 6 | 24 | 1:2 (8:16) | 50 | 387 | 0.028 | 50 | 80.22 | - |
| 7 | 30 | 1:2 (10:20) | 50 | 470 | 0.028 | 60 | 210.62 | - |
Table 2: Physico-chemical properties of grafted ETFE films.
FTIR analysis
PerkinElmer spectrum two FTIR spectroscopy was used to characterize the structural properties of the grafted both before and after Cu adsorption, as well as bare ETFE. In the spectrum a, the ETFE film spectra showed a number of strong bands in the 1000-1300 cm-1 range that resembled the C-F of CF2 groups [17]. When comparing the spectra a and b it could be seen that the -OH stretching vibrations of AA exhibited a broad absorption peak between 3200 and 3600 cm-1. The C=O groups of AA corresponded to the absorption peak at 1718 cm-1. The characteristic peak of a substituent linked to the para-position of the benzene ring is the absorption peak at 842 cm-1. The peak at 1020 cm-1 was due to a symmetrical stretching vibration of S=O and 1168 cm-1 for antisymmetric [18,19]. All these new adsorption peaks showed that AA and SSS had been successfully grafted onto the ETFE film. Comparing the spectrum b with c, the peak at 1718 cm-1 for C=O groups of AA became sharper. Another change happened at 1025 cm-1, which increased and represented the S=O groups of SSS indicating Cu adsorption (Figure 2).

Figure 2: FTIR spectrum a) Bare ETFE; b) ETFE-g-SSS-AA film; c) ETFE-g-SSS-AA film after Cu loaded.
SEM analysis
The scanning electron microscopy of the membranes was examined using VEGA3 TESCAN located in IE, AERE, BAEC. Figure 3 shows the surface morphologies observed by SEM of raw ETFE and ETFE-g- SSS-AA film. The surface nature of the ETFE sample remained almost similar after grafting, according to the microscopic appearance of the SEM image. Raw ETFE film had a thick, continuous, homogenous, smooth surface similar to that of the majority of semicrystalline polymers, including LDPE, PP, etc. [20]. After grafting reaction, the constitution of ETFE changed and the surface showed little change with few spots of various sized grafted pieces, which could be due to the softness of the ETFE.
This can be noted that the grafting of SSS and AA onto PE to a great extent is homogeneous as the distribution and concentration of the grafting particles on the surface are analogous. The Energy dispersive X-ray spectrum for Cu (II) loaded adsorbent exhibits the peak for Cu in Figure 3e. Table 3 represents the elemental analysis of Cu loaded ETFE-g-SSS-AA which shows a chemical composition of 73.6% C, 20.09% F, and 5.5% Cu. After Cu (II) adsorption process, the characteristic peaks, and the percentage (in mass) of Cu were clearly proved to be the adsorption of Cu.

Figure 3: SEM images of bare ETFE film a) 200 times magnification and; b) 200 times magnification and; c) 500 times magnification ETFE-g-SSS-AA film; d) 500 times magnification and; e) the corresponding Energy Dispersive X-ray spectrum (EDX) for ETFE-g-SSS-AA film after Cu (II) adsorption.
| Element | Weight % | Atomic % |
|---|---|---|
| C | 73.6 | 83.8 |
| F | 20.9 | 15 |
| Cu | 5.5 | 1.2 |
Table 3: Elemental composition of Cu loaded ETFE.
Preparation of Cu solution
Cu (II) stock solution was made using DDI water, and the required Cu (II) solution concentrations were made by properly diluting the stock solutions. Wavelengths of 530 nm and 820 nm were used to determine low and high concentrations of Cu (II) respectively by using UV-Vis spectrophotometer from Cu (II) aqueous solutions.
Studies of monomer concentrations on GY: Monomer concentrations played an important role in GY because GY increased significantly with increasing the concentrations of monomer solution graphically as presented in Figure 4a. The monomer concentrations were kept 1:2 for SSS: AA in water for all solutions. The concentrations varied from 9% (3% SSS and 6% AA in water) to 30% (10% SSS and 20% AA in water) where 4% NaCl was used as an additive. Initially GY showed very little change from 4.5% to 12.5% with the monomer concentration of 9% to 12%, however after that, it increased sharply to the highest point of 470% at the mixture of 10% SSS and 20% AA in water.
Addition of NaCl into monomer solution: Addition of NaCl promoted the GY of the adsorbent. At below 4% NaCl the percentage of GY attained very low. Even GY was only 20% when 2.5% NaCl was added into monomer solution as shown in Figure 4b. Thus, the addition of NaCl is great important to the formation of the highcapacity adsorbent. In this study, 4% NaCl was used as an optimum amount.
Adsorption capacity vs. GY: Higher GY promoted the percentage of Cu (II) uptake represented in Figure 4c (pH: 4.86, vol: 10 mL, radiation dose: 50 kGy, conc: 1000 mg/L). The percentage of Cu (II) uptake increased as the percentage of GY increased. Because there are more functional groups at higher GY levels, more Cu (II) can be captured there. The GY of 470% showed the highest AC.
Effect of pH: In aqueous solution, pH influences Cu (II) adsorption significantly. Figure 4d illustrates the impact of pH on Cu (II) adsorption of PE-g-SSS-AA films (GY: 470%, vol: 10 mL, radiation dose: 50 kGy). Firstly, AC increased quickly from 4.04 to 281 mg g-1 with pH 1.17 to 4.86 and reached the highest point (294.33 mg g-1) at pH 5.15. After that, AC dropped slowly by 268 mg g-1 at pH 6.68. The trend was remarkably similar to other investigations of Cu removal, such as using biosorbent made from the hulls of Indian jujube seeds. By preparing acidic and basic media with HCl and NaOH, respectively, the pH of the solution was adjusted. The grafted ETFE films displayed decreased ability to chelate copper ions at low pH. As pH increased, the sulfonic group deprotonated, resulting in active sites that created complexes with Cu (II) ions. Thus, it showed the highest adsorption capacity at pH 5.35. However, when pH further increased, NaOH in Cu (II) solution also increased. Cu (II) ions showed more affinity towards (OH-) ions and form Cu (OH)2 precipitation. Thus, at higher pH levels adsorbents had lower capacity for Cu (II) adsorption. The mother solution had a pH of 4.86 and included 271.5 mg g-1 of AC from a 1000 ppm Cu solution. The maximum value of AC, 294.33 mg g-1 at pH 5.15, was close to the value of AC at pH 4.86. Moreover, AC gradually decreased after pH 5.15. Therefore, pH was kept unchanged to avoid protonation and precipitation of Cu (II) for other adsorption tests in this experiment.

Figure 4: a) Influence of monomer concentration on GY; b) Influence of NaCl on GY; c) The effect of GY on the adsorption capacity; d) The effect of pH on the adsorption capacity.
Time study
Plotting the ETFE-g-SSS-AA adsorption capacity vs. contact time (hr) under specific conditions (GY: 470%, initial metal ion concentration: 20 mg/L, pH: 4.86, vol: 10 mL, radiation dose: 50 kGy) is shown in Figure 5a. The range of interaction time was set at 0.5 hours to 30 hours. The adsorption occurred swiftly at initial stages up to 4.5 hr and became slower near the equilibrium. There was no considerable change of the AC of the adsorbent after equilibrium (24 hr). Up to 30 hr all metals were investigated. After 24 hr the equilibrium adsorption for Cu (II) was achieved at 11.46 mg g-1.
Kinetic modeling
To investigate the kinetic mechanism of adsorption, two different kinetic models Pseudo First Order (PFO) and Pseudo Second Order (PSO) kinetic models are used. The PFO and PSO are described by the following equations:
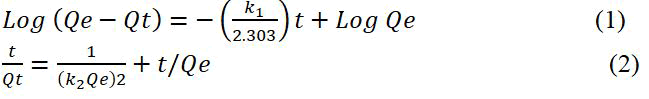
Where, Qe (mg g-1) is the adsorption capacity at equilibrium. Qt (mg g-1) is the adsorption capacity at time t (hr). k1 (hr-1) and k2 (g mg-1 hr-1) are the first and second-order kinetic constants, respectively.
Pseudo First Order kinetic model (PFO)
The graph of log (Qe-Qt) vs. time has been used to calculate the pseudo first order rate constant (Figure 5). The slope and intercept of the trend line can be employed to determine the values of k1 and Qe. It can be concluded that the experimental Qe (11.46 mg g-1) value and Qe (7.35 mg g-1) value measured from the 1st order kinetic model are different from each other. The correlation between experimental data and PFO kinetic model data was presented by correlation coefficient (R2). The values of k1, Qe and R2 for Cu (II) uptake were presented in Table 4.

Figure 5: a) Adsorption capacity varies with contact time at room temperature (25℃), GY 387% and pH 4.86. Adsorption kinetics; b) Pseudo first order kinetic model; c) Pseudo second order kinetic model and; d) Intraparticle diffusion model.
Pseudo Second Order kinetic model (PSO)
As could be seen from t/Qt against time shows a linear relationship. The value of Qe (mg g-1) and k2 (g mg-1 hr-1) are determined from the slope and intercept of the plot, respectively and they are summarized in Table 4. From the graph, it can be seen that the experimental Qe value (11.46 mg g-1) and the Qe value (11.61 mg g-1) calculated from the 2nd order kinetic model are very similar to each other. Moreover, the correlation coefficient value (R2) was also very close to unity which further supports PSO kinetic model in the present experiment. Hence, the PSO kinetic model is suitable to understand Cu (II) uptake.
Intra Particle Diffusion (IPD)
As the adsorption follows PSO model the adsorption process might have been controlled by the Intra Particle Diffusion (IPD). To get more extent of adsorption, the IPD plays an important role and it can be expressed as:
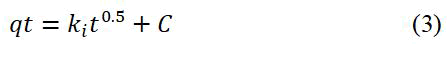
Where, Ki is the intraparticle diffusion constant (mg g-1 hr-1) and, C is the intercept (reflects the boundary layer effect).
The figure will be linear if intraparticle diffusion plays a part in the adsorption process, and if these lines cross the origin, intraparticle diffusion is the rate regulating step. The ki value can be calculated from slope of the plot Figure 8d and are presented in Table 4. The plot of AC versus t0.5 Figure 5d does not pass through the origin. This indicates that intra particle diffusion is not the only rate controlling step, moreover, there is other kinetic models may control the adsorption rate.
| PFO model | PSO model | IPD model | |||||
|---|---|---|---|---|---|---|---|
| Qe | k1 | R2 | Qe | k2 | R2 | ki | R2 |
| (mg g-1) | (hr-1) | (mg g-1) | (g mg-1 hr-1) | (mg g-1 hr-1) | |||
| 7.35 | 0.3662 | 0.9508 | 11.6144 | 0.1087 | 0.9994 | 1.134 | 0.662 |
Table 4: The Pseudo First Order (PFO), Pseudo Second Order (PSO) and Intraparticle Diffusion (IPD) kinetic models for Cu (II) uptake where experimental value of AC (Qe) is 11.46 mg g-1.
Temperature study
Temperature plays an important role in the adsorption capacity of the adsorbent. The adsorption capacity was studied with different temperatures of 8.3℃, 25℃, 60℃, 80℃, and 100℃ of 200 ppm Cu (II) solution of unmodified pH. Adsorption capacity enhances with increasing temperature (4 hours of heating period) as in Figure 6a. Adsorption capacity was found 125 mg g-1 at 8.3℃ but it raised 235 mg g-1 at 100℃ indicating that the sorption obeys endothermic manners.
Concentration study: The relationship between the initial concentration of metal ions and adsorption capacity is shown in Figure 6b (GY: 470%, pH: 4.86, vol: 10 mL, radiation dose: 50 kGy). As the concentration of metal ions rises, correspondingly raises the adsorption capacity. The abundance of active sites on the adsorbent surface contributes to the high adsorption capacity at low concentrations.
However, at high concentrations, the active sites are completely filled with Cu (II), and as a result, no more active sites are available for ion bonding. The adsorption capacity in this experiment, which had initial Cu (II) concentrations of 97 mg L-1 to 953 mg L-1, climbed quickly from 105 mg g-1 to 356 mg g-1 before gradually reaching a plateau, is an example of this phenomenon. The highest adsorption capacity for Cu (II) was found to be 412 mg g-1 at 2500 ppm at equilibrium. Therefore, from the concentration study it is seen that the ETFE-g- SSS-AA film can be used to purify water from wastewater having less or a lot of Cu (II).

Figure 6: a) Effect of pH; b) initial metal ion concentration on the adsorption capacity.
Adsorption isotherm studies
Both the Langmuir and the Freundlich adsorption isotherms have been used to assess the ETFE-g-SSS-AA's ability to adsorb Cu (II) ions. The Langmuir isotherm, a single layer, or monolayer is theoretical, while the Freundlich isotherm is empirical. The Langmuir adsorption is established by the following linear equation 4 and the dimensionless separation factor, RL is expressed by equation 5:
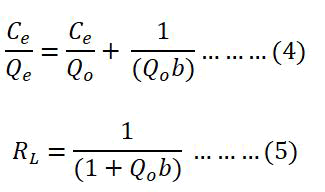
Where, Ce (mg L-1)=Concentration of the metal ion at equilibrium. Qe (mg g-1)=Capacity of the adsorption at equilibrium. Qo (mg g-1)=Monolayer adsorption capacity. b (L mg-1)=Langmuir adsorption constant.
The value of RL is an important factor in Langmuir adsorption isotherm. If RL>1 the reaction would be unfavorable but if 0 <RL<1 it would be favorable. On the other hand, if the RL values are 1 and 0.00 it would be linear and irreversible respectively (Figure 7). Here, Qo and b can be calculated from the slope and intercept of the plot of Ce/Qe vs. Ce. The linearity of the plot, Qo value, R2 and RL values revealed that the adsorption followed Langmuir isotherm model and displayed in Table 2.

Figure 7: a) Langmuir isotherms; b) Freundlich isotherms.
On the other hand, the Freundlich isotherm can be expressed by the linear equation 6 which demonstrates multilayer adsorption on heterogeneous surface.
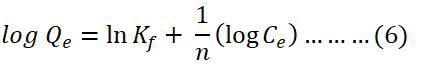
Here, Qe=Amount of Cu (II) adsorbed (mg g-1) in equilibrium, Ce=Equilibrium concentration of Cu (II) solution (mg L-1), Kf and n=Freundlich constants which indicate the capacity and the intensity of the adsorption, respectively.
The values of Kf (mg g-1) and n (L mg-1) can be extracted by the intercept and slope of the plot of log Qe vs. log Ce showed in and summarized in Table 5. n represents good, moderately difficult, and poor adsorption characteristics when the values of n are in the range of 2-10, 1-2, and less than 1 respectively. The R2 value was found 0.76 from this model indicating that the adsorption process is more compatible with the Langmuir adsorption isotherm model than the Freundlich isotherm model.
| Adsorption isotherm model | Parameters | Values |
|---|---|---|
| Langmuir | Qo (mg g-1) | 416.67 |
| RL | 0.11 | |
| R2 | 0.99 | |
| Freundlich | KF (mg g-1) | 82.38 |
| n | 4.51 | |
| R2 | 0.76 |
Table 5: Isotherm parameters obtained from the adsorption study of Cu (II).
Probable reaction mechanism
It is likely that ETFE-g-SSS-AA films have both physical and chemical adsorption (functional groups) on their surface may explain their high adsorption capability. Lone pair electrons can be provided by the "O" atoms in carboxyl and sulfonate groups to form a coordination bond with copper ions. Figure 8 can be used to suggest one of the reaction mechanisms based on the findings of the kinetic model and isotherm model presented before. It should be noted that more probable reaction pathways may exist that may be liable for the adsorption.

Figure 8: One of the simple reaction pathways of the formation of ETFE-g- SSS-AA adsorbent and interaction with Cu2+.
Regeneration and reuse study
The key to effectively reducing costs is reuse. The regeneration and reuse process of the metal loaded adsorbents is significantly influenced by desorption. Desorption of the metal ions were carried out by 2M HCl, 2M HNO3, 2M H2SO4 and 2M NaOH as eluting agents for 30 minutes. All the solvents responded to the regeneration process. However, the desorption rate was maximum for 2M HCl (99%) (Figure 9).

Figure 9: Effect of solvents on desorption.
At the same optimum operating conditions, the adsorption desorption cycle was repeated. The adsorption capacity from the first cycle was 99 mg g-1, while the second cycle's value was 71 mg g-1. The findings indicate that this adsorbent is appropriate for further use.
Regeneration efficiency=71%.
CU (II) uptake capacity compared with other adsorbents
Earlier research in this area included numerous investigations where the removal capacities of the adsorbents ranged from poor to high. In this study, the adsorbent capacity was very high to remove Cu (II) from aqueous solution (Table 6). The maximum adsorption capacity was found to be 412 mg g-1, which was 2.14 times higher than that of the polypropylene fabric with the same functional groups.
| S. no | Adsorbent | Adsorption capacity (mg g-1) |
|---|---|---|
| 1 | Activated red clay | 26.8 |
| 2 | Activated neem bark | 21.78 |
| 3 | Lignite | 4.045 |
| 4 | Kaolinite | 10.78 |
| 5 | Chitosan | 53 |
| 6 | Waste polypropylene (PP) | 192 |
| 7 | Cashew nut shell | 20 |
| 8 | Grape seeds | 1.4 |
| 9 | ETFE-g-SSS-AA | 412 |
Table 6: Cu (II) adsorption capacity of SSS-AA-g-ETFE film compared with some other adsorbents.
Conclusion
By using the pre-irradiation process using NaCl as an additive, SSS and AA grafted ETFE adsorbent was successfully synthesized. FTIR, TGA, and SEM were used to characterize the produced adsorbent. 30% monomer solution (SSS: AA=1:2) in water produced the highest graft yield of 470% with 50 kGy of radiation dose when 4% NaCl was added as an additive. The grafted polymer was examined using tensile strength, water uptake, and surface area extension. Cu (II) was adsorbing from various aqueous solutions using the newly produced adsorbent. At an initial concentration of 2500 ppm, a pH of 4.86, and a contact time of 24 hours at room temperature (25℃), the maximum adsorption capacity was found to be 412 mg g-1 from the ETFE-g-SSSAA of 470% GY. The strong agreement between experimental results and the Langmuir isotherm model pointed to a monolayer adsorption. The pseudo second order process provided a good fit to the kinetic adsorption data. To sum up, the synthesized novel grafted polymer can be regarded as a good adsorbent for Cu (II) removal from wastewater due to its greater adsorption capacity and reusability.
Acknowledgement
The authors would like to express their gratitude to the International Atomic Energy Agency (IAEA) for their cooperation with the technical parts of this study. It is equally important to recognize the contributions made by the institute of food and radiation biology at Bangladesh atomic energy research establishment for providing irradiation facility.
References
- Thouria B, Selatnia A, Djabali D (2018) Adsorption of copper (II) ions from aqueous solution using bottom ash of expired drugs incineration. Adsorp Sci Techno 36:114-129.
- Sultana S, Ahmed FT, Rahman N, Alam MF (2023) Determination of Ni, Cu, Cd, Zn, Pb, Cr and Mn in some black and green tea leaves and their infusions available in Bangladeshi local markets. ACE 6:28-37.
- Song Z, Huang W, Zhou, Tian ZQ, Li ZM, et al. (2020) Thermally regulated molybdate based ionic liquids toward molecular oxygen activation for one pot oxidative cascade catalysis. Green Chem 22:103-109.
- Deepa P, Pooja B, Ashok K, Pravin D (2018) Adsorption of Cu (II) Ions from Aqueous solution by A. Ficoidea J Adv Sch Res Allied Educ 15:203-208.
- Yuan L, Sun M, Liao X, Zhao Y, Chai Z, et al. (2014) Solvent extraction of U (VI) by trioctylphosphine oxide using a room-temperature ionic liquid. Sci China Chem 57:1432-1438.
- Zhong L, He F, Liu Z, Dong B, Dng J (2022) Adsorption of uranium (VI) ions from aqueous solution by acrylic and diaminomaleonitrile modified cellulose. Colloids Surf A: Physicochem Eng Asp 641:128565.
- Wu J, Tian K, Wang J (2018) Adsorption of uranium (VI) by amidoxime modified multiwalled carbon nanotubes. Prog Nucl Energy 106:79-86.
- Torkaman R, Maleki F, Gholami M, Torab-Mostaedi M, Asadollahzadeh M (2021) Assessing the radiation nduced graft polymeric adsorbents with emphasis on heavy metals removing: A systematic literature review. J Water Process Eng 44:102371.
- Rahman N, Dafader NC, Sultana S, Ahmed FT, Miah AR (2020) Application of acrylic acid and sodium styrene sulfonate grafted non-woven PE fabric in methylene blue removal. Res J Chem Environ 24:36-43.
- Nasef MM (2000) Gamma radiation induced graft copolymerization of styrene onto poly (ethyleneterephthalate) films. J Appl Polym Sci 77:1003-1012.
- Agarwal M, Singh K (2017) Heavy metal removal from wastewater using various adsorbents: A review. J Water Reuse Desalination 7: 387-419.
- Shao D, Li Y, Wang X, Hu S, Wen J, et al. (2017) Phosphate functionalized polyethylene with high adsorption of uranium (VI). ACS Omega 2:3267-3275.
[Crossref] [Google Scholar] [PubMed]
- Rahman N, Sato N, Yoshioka S, Sugiyama M, Okabe H, et al. (2013) Selective Cu (II) adsorption from aqueous solutions including Cu (II), Co (II), and Ni (II) by modified acrylic acid grafted PET film. Int Sch Res Notices 2013:1-9.
- Zu J, Tang F, He L, Fu L (2018) Facile synthesis and properties of a cation exchange membrane with bifunctional groups prepared by pre-irradiation graft copolymerization. RSC Adv 8:25966-25973.
[Crossref] [Google Scholar] [PubMed]
- El-Arnaouty MB, El-Kelesh NA, Abdel-Aal SE (2004) Use of radiation for grafting of binary hydrophobic monomers onto polyvinylalcohol and its application. Arab J Nucl Sci 37:17-30.
- Atia KS, El-Arnaouty MB, Ismail SA, Dessouki AM (2003) Characterization and application of immobilized lipase enzyme on different radiation grafted polymeric films: Assessment of the immobilization process using spectroscopic analysis. J Appl Polym Sci 90:155-167.
- Nasef M, Saidi M, Ahmad H, Ali AA, Amgad (2013) Optimization and kinetics of phosphoric acid doping of poly(1-vinylimidazole)-graft-poly(ethylene-co-tetrafluorethylene) proton conducting membrane precursors. J Membr Sci 446:422-432.
- Gonzalez-Blanco C, Rodriguez LJ, Velazquez MM (1997) Effect of the addition of water soluble polymers on the structure of aerosol OT water-in-oil microemulsions: A fourier transform infrared spectroscopy study. Langmuir 13:1938-1945.
- Nasefa MM, Saidi H, Dahlan KZM (2009) Single step radiation induced grafting for preparation of proton exchange membranes for fuel cell. J Membr Sci 339:115-119.
- Khedr RF (2022) Synthesis of amidoxime adsorbent by radiation induced grafting of acrylonitrile/acrylic acid on polyethylene film and its application in Pb removal. Polymers 14:3136.
[Crossref] [Google Scholar] [PubMed]