Spanish
  Chinese
  Russian
  German
  French
  Japanese
  Portuguese
  Hindi
Hindi Research Article, J Appl Bioinforma Comput Biol Vol: 6 Issue: 2
An Efficient Exact Method For Identifying Mutated Driver Pathways in Cancer
Yassine EL Kati1, Shu-Lin Wang1*, Fouad Kharroubi2,3* and Yiyan Tan1
1School of Computer Science and Electronic Engineering, Hunan University, Changsha, 410082, Hunan, China
2College of Science, Central South University of Forestry and Technology, Changsha, 410004, Hunan, China
3LTI Laboratory, Ecole Nationale des Sciences Appliquées, ENSAJ, Chouaib Doukkali University, El Jadida, 24002, Morocco
*Corresponding Authors : Shu-Lin Wang
College of Computer Science and Electronic Engineering, Hunan University,Changsha, 410082, Hunan, China
Tel: 13787125196
E-mail: smartforesting@gmail.com
Fouad Kharroubi
College of Science, Central South University of Forestry and Technology, Changsha, 410004, Hunan, China
Tel: +212 682236243
E-mail: fouad.kharroubi@gmail.com
Received: June 16, 2017 Accepted: July 06, 2017 Published: July 13, 2017
Citation: El Kati Y, Wang SL, Kharroubi F, Tan Y (2017) An Efficient Exact Method for Identifying Mutated Driver Pathways in Cancer. J Appl Bioinforma Comput Biol 6:2. doi:10.4172/2329-9533.1000135
Abstract
One of the key challenges in bioinformatics is to find the distinction between driver mutations that lead to tumorigenesis and random passenger mutations, which are known to be neutral and does not play any role in cancer development. To solve this problem, several approaches and techniques were used. In this article, we introduce an algorithm based on an exact approach in order to solve the so called “maximum weight submatrix problem”. The proposed algorithm maximizes the weight and samples all the possible pathways that can be found. We present the details about our algorithm and then compare them to a metaheuristic algorithm called Genetic Algorithm (GA) and with another exact model named Binary Linear Programming (BLP). Our Exact Algorithm shows good results in terms of maximizing the weight and finding all possible pathways.
Keywords: Maximum weight submatrix problem, Driver pathways, Driver mutation, Exact algorithm, Genetic algorithm
Introduction
Cancer is a name given to all kind of diseases caused by genetic changes, such as somatic mutations in DNA. These mutations occur during cell division, when the cell makes a copy of itself. This process is called “DNA Replication” in which the cell has to copy and transmit the exact same sequence of 3 billion nucleotides to its daughter cells and while most DNA replicate, some mistakes do happen [1]. For instance, Sickle cell anemia, which is a group of disorders that affects hemoglobin, is also caused by the smallest of genetic changes [2].
Genome sequencing is one technique amongst others that have been deployed to analyze and measure somatic mutations. Many projects were launched in order to deal with these somatic mutations, for instance The International Cancer Genome Consortium. It is a project that aims to map the genetic mutations of the most dangerous cancer types. In addition, The Cancer Genome Atlas (TCGA) applies high-throughput genome analysis techniques in order to sequence genetic mutations that lead to cancer. In order to assess the data from these projects, it is necessary to distinguish random passenger mutations from driver mutations. Passenger mutations are known to be neutral and do not play any role in cancer proliferation, but on the other hand driver mutations do play a role.
For this, it is necessary to test the biological function of the mutation to decide whether it is a driver or a passenger mutation. Several approaches and techniques were used in this area. We can introduce frequency-based methods that use a single gene test, methods that require a prior knowledge about pathways and methods that find mutated genes and pathways without any prior knowledge of pathways or other interaction between genes.
To detect driver mutations, we tend to identify genes with recurrent mutation in a large number of patients. To that end, there is a common technique that requires a single gene test. In this technique, individual genes are tested to determine if their observed frequency of mutation is significantly higher than expected [3-6]. It is true that this technique has identified a number of genes that lead to cancer proliferation, but some difficulties face it such as determining the background mutation rate (BMR) for each gene which is not a straightforward task [3,6,7] and also the extensive mutational heterogeneity in cancer [8,9]. Furthermore, many studies have shown that BMR is not constant across the genome [10-12]. To that end, some frequency based methods have been deployed such as MuSiC [13] and MutSigCV [11]. These two techniques employ the mutation types and sample-specific mutation rates.
Another approach that requires previous knowledge about pathways has been used as an alternative to single gene tests. This approach encompasses a variety of techniques. One of those being the Gene Set Enrichment Analysis (GSEA). The GSEA ranks the list of mutated genes and then assesses whether a pre-defined set of genes has more high-ranking genes than expected.
Moreover, interaction network based methods have been developed to identify significantly mutated sub networks. In this area, we count HotNet [14] which is an algorithm designed to find significantly alter sub networks in a large gene interaction network. HotNet was extended to HotNet2 [15] to identify high weight sub networks that were located in a vertex-weighted network. Other algorithms including NetBox [16] and MeMo [17] were developed as alternatives to HotNet and HotNet2.
Since we cannot get all the information about pathways and interactions between genes it is necessary to develop some algorithms that do not require any prior knowledge. To that end, Vandin et al. [18] came up with a new approach named “The maximum weight submatrix problem”. This approach relies on maximizing a scoring function that combines two properties: high coverage and mutual exclusivity [19].
In order to solve this problem, many algorithms were introduced. Starting from Dendrix [20] which is based on Markov Chain Monte Carlo (MCMC) and Multi-Dendrix. These algorithms take somatic mutation data from m cancer patient as input and identifies multiple sets of mutations.
Furthermore, other literature works have proposed other approaches such as simulated annealing based algorithm in [21], a dynamically heuristic method in [22] and another method that proceeds by constructing gene networks in [23]. As indicated by Kharroubi et al. in [24] and [25] the common point of these cited algorithms is that they are random search based methods. However, there still no exact algorithm for solving this problem.
In this paper, we introduce an exact algorithm to solve the maximum weight submatrix problem in order to sample all possible driver pathways. This algorithm is designed to assess the significance of recurrent mutations of all possible combinations of genes. We then compare the performance of this algorithm with a BLP model and Genetic Algorithm both introduced in [19].
Problem description
In order to detect driver mutated pathways, some researchers presented the so-called “Maximum Weight Submatrix Problem”. This problem takes two constraints into consideration. “High coverage” implies that we want to identify the number of patients with at least one mutation in the group of genes. Another constraint is “high exclusivity”, which finds a group of genes where each patient has at most one mutation in the pathway.
Therefore, we construct a binary mutation matrix A(m,n), based on somatic mutation data with m rows (patients) and n columns (genes). For instance, if Aij=1 it indicates that the gene in the column j is mutated in the patient i. Also, if Aij=0 it signifies that the gene is not mutated.
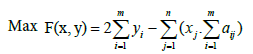
To that effect, the maximum weight submatrix Problem is about finding a submatrix M(m,k) with m rows and k columns from the mutation matrix A(m,n). Let us consider the same fitness function used in [20]:
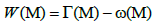
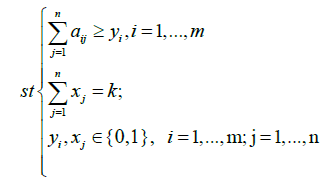
Where 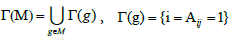 denotes the set of patients with a mutation in gene g. So Γ(M) indicates all the sets of patients that have mutations in the set M of genes.
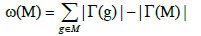
Furthermore, the coverage overlap ω(M) of a set M denotes the difference between the sum of the coverage of the single gene in the set and the coverage of the set. The equation below describes the coverage overlap.
We thus reduce the Weight function into the following formula:
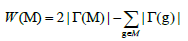
Figure 1 Illustrates a matrix represented by 10 patients and 11 genes mutated at random. When k is 2, the submatrix B which is formed by the genes {i,j} respects the constraint of high coverage and it is mutually exclusive. The weight of this set of genes is W(B)=8. Moreover, for k=3 the submatrix C formed by the set of genes {c,d,e} is also high coverage and mutually exclusive; its weight is W(C)=7. In this example, no other mutually exclusive submatrix has a weight greater than W(B) and W(C) respectively when k represents 2 or 3. In another case, when k represents 2, the submatrix A shows a gene set with approximate exclusivity and its weight being W(A)=9. The same is true when k stands as 3, the submatrix D illustrates an approximate exclusivity gene set with a weight of W(D)=9. With either value inputted into k, the weight of the mutually exclusive gene set is clearly less than those with approximate exclusivity. In this situation, we can distinctly notice that if we want to identify multiple driver pathways and find gene sets whose weights are maximized, it is necessary to define a new constraint; we call it “approximate exclusivity”. It assists in finding groups of genes respecting the co-occurrence degree (approximate exclusivity degree) α that determines the number of mutations, which each patient has in the pathway. Note that if α=1, the gene set is mutually exclusive.

Figure 1: Illustration of the binary mutation matrix A with 10 patients and 11 genes. In this example, 4 driver pathways are illustrated in the 4 sub matrices A, B, C and D.
Strategy and methods
The objective of this article is to design an algorithm, which will filter all sub matrices given the value of k and the degree of cooccurrence α. The co-occurrence degree is governed by the following constraint: 1 ≤ α ≤ k. If α=1 the submatrix M is mutually exclusive, if α ≠1 the submatrix is approximately exclusive. The main purpose of this work is to find groups of pathways with maximum weight and appropriate co-occurrence degree.
Problem formulation
This article aims to present an algorithm that is able to find optimal solutions while solving the maximum weight submatrix problem. For this, we will start by using a Binary Linear Programming (BLP) model that exactly maximizes the weight and finds optimal gene sets. We used the same BLP model [19], that in fact can exactly solve this problem. Thus, we can formulate the original maximum weight submatrix problem as follows:
xi and yi are two indicators that come into play if column j of A falls into the submatrix M and if the entries of row i of M are not all zeros, respectively [19].
We used both Matlab and Cplex to solve the BLP problem and we ran the experiments on a 2.4 GHz i7-5500U CPU PC using mutation matrices with a number of genes less than 1000 [19].
An efficient exact algorithm for identifying all possible driver pathways
In order to detect driver pathways using the scoring function, some heuristic algorithms are widely used. Unfortunately, these heuristic methods do not guarantee that the best result will be produced. This study is based on an exact algorithmic approach which will detect the optimal results in terms of maximizing the weight and generating all possible pathways. Since we run our experiments offline, the run time and the memory consumption will still be reasonable. Figure 2 illustrates the steps of our exact algorithm.

Figure 2: Illustrates the steps of our exact algorithm.
Our exact algorithm is based on 8 main steps, as it is shown in Table 1. In the first step we used the same filtering technique that Wu et al. [23] used in their work. We removed the genes with the frequency of mutation is less than 5% because genes altered in only one or few cancer patients may not be driver mutations and possibly could be passenger ones. In the second step, we made all the possible combinations of genes according to the k value. After that, we proceeded by deleting the matrices that do not fit with the cooccurrence degree. Then for the next steps, it is about calculating the weight and producing set of genes with the highest weight.
| Exact Algorithm Detecting submatrices with the maximum weight |
|---|
| Input: The mutation matrix A(m,n). The size of the gene set k. The co-occurrence degree α. Output: All the sub matrices with maximum weight and respect the co-occurrence degree α. 1. Remove the genes with a frequency of mutation less than 5%; 2. Make all the combination of genes to get the sub matrix M(m,k); 3. Calculate the number of ones per row N1 for every sub matrix M(m,k); 4. Delete the sub matrices with N1 less than in M(m,k); 5. Count how many rows are not all zeros  6. Count the number of ones in all the sub matrix  ; ;7. Calculate the weight W of every sub matrix M2 using the formula 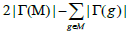 ; ;8. Return all the sub matrices with the highest weight W; |
Table 1: Illustration of the eight steps of the Exact Algorithm.
To clearly highlight the variation of the weight and the number of pathways using our exact algorithm, we introduce the following example. We generated a matrix with m=100 patients and n=100 genes following a random process. We will use the same technique in the simulated data study. It is about generating simulated matrices so that every patient has at least one mutation and the genes are mutated following a random process, and illustrated by the parameter rand(λ). The number of mutation of every single gene is in the set {1,2,3…,λ}.
We made our experiments for all α values and we exposed the results in the graph below. Our algorithm shows that we get the optimal weight when the approximate exclusivity degree is α=2. It also shows that the weight stagnates when α=3,4,5 Figure 3.

Figure 3: The weight variation according to different k and α values. The x-axis represents k values, while the y-axis is the weight W.
The same is true for maximizing the number of pathways, Figure 4 shows that our Exact Algorithm continuously gets a smaller number of pathways when high exclusivity is respected (α=1). With approximate exclusivity, especially when α=2 the number of pathways raises after that, it stagnates when α=3,4,5.

Figure 4: The execution time variation according to different k and α value. The x-axis represents four k values, while the y-axis is the number of produced pathways. Every color represents α value.
Results and Discussion
In order to show the effectiveness of our method, we applied it on both simulated data and biological data then we compared the results with the BLP model and the GA, both proposed [19]. In simulated data, we found that our Exact Algorithm produces optimal solutions when the co-occurrence degree α is 2. When α is bigger than 2 both the weight and the number of pathways produced are stagnant. While in biological data, our Exact Algorithm shows a high effectiveness in maximizing and detecting new pathways for both α is 2 and 3. In this study, we proceeded by using the gene set enrichment analysis in order to figure out if there are any associations between the pathways sampled and disease phenotypes.
Simulated data
In order to compare our Exact Algorithm with the GA and BLP model introduced in [19] in terms of maximizing the weight, we generated mutation data for m=100 patients and n=(100,200,300,400,500) genes. Additionally, λ=40 and k=4 were used in this study. Figure 5 shows that the BLP and our Exact Algorithm always get the same weight regardless the number of genes. However, as long as the number of genes increses, GA shows an instability in maximizing the weight.

Figure 5: Comparison of the weights obtained by the three methods. In this scenario, the x-axis represents the number of genes and the y-axis is the weight. The red line denotes the weight of GA, the black line with circles represents our Exact Algorithm and the blue line with ‘+’ denotes BLP.
To compare the three algorithms in terms of maximizing the number of pathways, we generated randomly mutation data for m=100 patients and n=(100,200,300,400,500) genes. In this study, we have used λ=10 and k=3. After assessing the BLP model, the GA, as well as our Exact Algorithm on this data, we found out that the key limitation is the BLP model when maximizing the number of pathways. Although it produces the highest weight, the BLP model detects only one pathway. However, as Figure 6 shows our Exact Algorithm shows a good ability in sampling the pathways, since it detects all the pathways that exists in the mutation matrix. As long as the number of genes increases, the number of pathways detected by our Exact Algorithm increases significantly compared to the BLP or GA models [19]. This is clearly noticeable when the number of genes is beyond 300. For example, when the number of genes is 500, the difference between the number pathways detected by the Exact Algorithm and the GA [19] is 1283 pathways. Note that the number of pathways detected by the Exact Algorithm becomes significantly important when k is 4 or 5.

Figure 6: Comparison of the weights obtained by the GA, the BLP and our Exact Algorithm. In this plot, the x-axis represents the number of genes and the y-axis depicts the number of pathways sampled. The red line denotes the weight of GA, the black line with circles represents our Exact Algorithm, and the blue line with ‘+’ denotes BLP.
To sum up, both BLP and Exact Algorithm have shown remarkable efficiency in solving the maximum weight submatrix problem. The BLP method is very powerful in detecting the maximum weight in less time. Furthermore, when detecting driver pathways, the Exact Algorithm shows a remarkable capacity in detecting all the driver pathways that can be found. The difference between this algorithm and the GA is barely noticeable when the subset set is less than three genes. When the gene set is beyond three elements the Exact Algorithm overtakes all other algorithms and the difference is astounding.
Biological data
In order to assess the performance of our exact method in biological data. We have applied the BLP, the GA [19] and our exact algorithm onto five biological data sets as described in Table 2 and compared the results.
| CT | NP | NG | Ref |
|---|---|---|---|
| HNSCC | 84 | 4920 | Stransky et al. [26] |
| LC | 163 | 356 | Vandin et al. [20] |
| GBM1 | 84 | 178 | Vandin et al. [20] |
| GBM2 | 90 | 1126 | TCGA (2008) |
| GBM3 | 84 | 178 | Zhao et al. [19] |
Table 2: Table containing 5 cancer types.
Lung carcinoma (LC)
We applied our Exact Algorithm to the Lung Carcinoma data used by Vandin et al. [20]. Then we compared it with the BLP model and the GA both cited in [19]. For k=2, the three algorithms detected the gene set (EGFR, KRAS) as a potential driver pathway. Our Exact Algorithm has detected that this gene set presents high exclusivity, which means all patients have only one mutation in this pathway. Furthermore, as Table 3 shows, this set of genes covers 55% of samples, also being a part of the MAPK signaling pathway, as shown in Figure 7a.

Figure 7: (a) Shows MAPK signaling pathway. (b) Shows NF1 interacting with MAPK signaling pathway.
| Optimal gene sets | Size of the set | Weight | Co-occurrence degree | Coverage | Covering patients |
|---|---|---|---|---|---|
| EGFR, KRAS | 2 | 90 | 1 | 90 | 55% |
| EGFR, KRAS, STK11 | 3 | 96 | 2 | 110 | 67% |
| EGFR, KRAS, NF1, STK11 | 4 | 99 | 4 | 118 | 72% |
| EGFR, ERBB4, KRAS, NF1, STK11 | 5 | 101 | 3 | 123 | 75% |
Table 3: Results of the exact algorithm in LC.
For other gene sets, the pair (EGFR, KRAS) always play an important role in the detected pathway compositions. For example, when k=4, all algorithms detect this pair of genes in addition to STK11 and NF1. Patients having a mutation in STK11 gene have the so-called Peutz- Jeghers Syndrome. This Syndrome presents a high risk for developing many types of cancer. Moreover, as Figure 7b shows, NF1 interacts with MAPK’s signaling pathway and plays and important role in cell growth and survival. This gene set is 96 weighted and was detected with a cooccurrence degree equal to 4. In addition, it is necessary to say that this potential pathway covers 67% of the diagnosed patients.
When k=5, we detect (EGFR, ERBB4, KRAS, NF1, STK11) to be a potential driver pathway. For this k value, our Exact Algorithm demonstrates that there is no submatrix with high exclusivity and we get a maximum weighted submatrix when the co-occurrence degree is 3. The gene set that is produced covers 123 samples that represent 75% of the diagnosed patients. This gene set includes the same pathway detected when k=4 in addition to ERBB4. This gene is a part of ERB signaling pathway, and interacts with Grb2, which is a fragment of the MAPK signaling pathway.
Glioblastoma multiform data 1 (GBM1)
Glioblastoma is known as one of the most malignant and aggressive of glial tumors. Before proceeding to analysis, we used the data directly from Vandin et al. [20]. It is a mutation matrix of 84 patients and 178 genes.
For k=2, we have got (CDKN2B, CYP27B1) as an optimal gene set. This pair of genes is mutated in 57 samples with 54 holding the highest weight. CDKN2B is the core member of the cell cycle and the p53 signaling pathway. CYP27B1 is also a member of the Glioblastoma copy number up [23]. For k=3, the three algorithms produced a unique gene set (CDKN2B, CYP27B1, RB1) which is altered in 79% of the samples. When k stands as 4, our Exact Algorithm have detected 6 optimal gene sets while the GA has detected only 5. The noteworthy driver pathway that the BLP and GA [19] did not detect is (CDK4, CDKN2B, ERBB2, RB1) and it is illustrated in Figure 8. This gene set is important because it covers 83% of the samples, whereas the genes CDK4, CDKN2B and RB1 are the core members of the cell cycle part of the p53 signaling pathway. Contrarily, ERBB2 is the member of the Glioblastoma copy number up [23].

Figure 8: Submatrix of the optimal gene produced by our exact algorithm. We show the mutation characteristics between patients and genes: (soft red) exclusive mutation; (turquoise) co-occurring mutation; (white) no mutation.
Our Exact Algorithm has shown good ability in detecting other optimal gene sets when k=5. The GA has detected only 10 optimal solutions while our Exact Algorithm has detected 31 optimal gene sets, one of them is mutated in 81% of the samples while the other 30 are mutated in 83% as it is shown in Table 4. Unlike k=2,3 and 4these gene sets were detected with a co-mutation degree of 3 since the maximum weight that we can reach in this set size is 60. As it is described in Table 5, except for the three quadruplets of genes (CDKN2B, DOCK1, ERBB2, RB1), (CDKN2B, ERBB2, FIP1L1, RB1) and (CDKN2B, ERBB2, LAX1, RB1) with the weight 54, 54 and 50 respectively, all the other core pathways were already detected when k is 4. It is clearly noticeable that the genes CDKN2B and RB1 which are core members of the cell cycle and ERBB2 which is a part of the p53 signaling pathway, are universally found in the 31 optimal gene sets sampled by our Exact Algorithm.
| Optimal gene sets | Set size | Weight | Co-occurrence degree | Coverage | Covering patients |
|---|---|---|---|---|---|
| CDKN2B, CYP27B1 | 2 | 54 | 2 | 57 | 68% |
| CDKN2B, CYP27B1, RB1 | 3 | 62 | 2 | 66 | 79% |
| CDK4, CDKN2B, ERBB2, RB1 | 4 | 64 | 2 | 70 | 83% |
| CDKN2B, CENTG1, ERBB2, RB1 | 4 | 64 | 2 | 70 | 83% |
| CDKN2B, ERBB2, FAM119B, RB1 | 4 | 64 | 2 | 70 | 83% |
| CDKN2B, ERBB2, METTL1, RB1 | 4 | 64 | 2 | 70 | 83% |
| CDKN2B, ERBB2, RB1, TSFM | 4 | 64 | 2 | 70 | 83% |
| CDKN2B, ERBB2, RB1, TSPAN31 | 4 | 64 | 2 | 70 | 83% |
| CDK4, CDKN2B, DOCK1, ERBB2, RB1 | 5 | 60 | 3 | 70 | 83% |
| CDK4, CDKN2B, ERBB2, FIP1L1, RB1 | 5 | 60 | 3 | 70 | 83% |
| CDK4, CDKN2B, ERBB2, LAX1, RB1 | 5 | 60 | 3 | 70 | 83% |
| CDK4, CDKN2B, ERBB2, RB1, SNRPE | 5 | 60 | 3 | 70 | 83% |
| CDK4, CDKN2B, ERBB2, RB1, ZC3H11A | 5 | 60 | 3 | 70 | 83% |
| CDKN2B, CENTG1, DOCK1, ERBB2, RB1 | 5 | 60 | 3 | 70 | 83% |
| CDKN2B, CENTG1, ERBB2, FIP1L1, RB1 | 5 | 60 | 3 | 70 | 83% |
| CDKN2B, CENTG1, ERBB2, LAX1, RB1 | 5 | 60 | 3 | 70 | 83% |
| CDKN2B, CENTG1, ERBB2, RB1, SNRPE | 5 | 60 | 3 | 70 | 83% |
| CDKN2B, CENTG1, ERBB2, RB1, ZC3H11A | 5 | 60 | 3 | 70 | 83% |
| CDKN2B, DOCK1, ERBB2, FAM119B, RB1 | 5 | 60 | 3 | 70 | 83% |
| CDKN2B, DOCK1, ERBB2, METTL1, RB1 | 5 | 60 | 3 | 70 | 83% |
| CDKN2B, DOCK1, ERBB2, OS9, RB1 | 5 | 60 | 3 | 70 | 83% |
| CDKN2B, DOCK1, ERBB2, RB1, TSFM | 5 | 60 | 3 | 68 | 81% |
| CDKN2B, DOCK1, ERBB2, RB1, TSPAN31 | 5 | 60 | 3 | 70 | 83% |
| CDKN2B, ERBB2, FAM119B, FIP1L1, RB1 | 5 | 60 | 3 | 70 | 83% |
| CDKN2B, ERBB2, FAM119B, LAX1, RB1 | 5 | 60 | 3 | 70 | 83% |
| CDKN2B, ERBB2, FAM119B, RB1, SNRPE | 5 | 60 | 3 | 70 | 83% |
| CDKN2B, ERBB2, FAM119B, RB1, ZC3H11A | 5 | 60 | 3 | 70 | 83% |
| CDKN2B, ERBB2, FIP1L1, METTL1, RB1 | 5 | 60 | 3 | 70 | 83% |
| CDKN2B, ERBB2, FIP1L1, RB1, TSFM | 5 | 60 | 3 | 70 | 83% |
| CDKN2B, ERBB2, FIP1L1, RB1, TSPAN31 | 5 | 60 | 3 | 70 | 83% |
| CDKN2B, ERBB2, LAX1, METTL1, RB1 | 5 | 60 | 3 | 70 | 83% |
| CDKN2B, ERBB2, LAX1, RB1, TSFM | 5 | 60 | 3 | 70 | 83% |
| CDKN2B, ERBB2, LAX1, RB1, TSPAN31 | 5 | 60 | 3 | 70 | 83% |
| CDKN2B, ERBB2, METTL1, RB1, SNRPE | 5 | 60 | 3 | 70 | 83% |
| CDKN2B, ERBB2, METTL1, RB1, ZC3H11A | 5 | 60 | 3 | 70 | 83% |
| CDKN2B, ERBB2, RB1, SNRPE, TSFM | 5 | 60 | 3 | 70 | 83% |
| CDKN2B, ERBB2, RB1, SNRPE, TSPAN31 | 5 | 60 | 3 | 70 | 83% |
| CDKN2B, ERBB2, RB1, TSFM, ZC3H11A | 5 | 60 | 3 | 70 | 83% |
| CDKN2B, ERBB2, RB1, TSPAN31, ZC3H11A | 5 | 60 | 3 | 70 | 83% |
Table 4: Results of the exact algorithm in GBM1.
| Core subset | Weight | Genes detected with the core subset |
|---|---|---|
| CDK4, CDKN2B, ERBB2, RB1 | 64 | DOCK1, FIP1L1, LAX1, SNRPE, ZC3H11A |
| CDKN2B, CENTG1, ERBB2, RB1 | 64 | DOCK1, FIP1L1, LAX1, SNRPE, ZC3H11A |
| CDKN2B, DOCK1, ERBB2, RB1 | 54 | FAM119B, METTL1, OS9, TSFM, TSPAN31 |
| CDKN2B, ERBB2, FAM119B, RB1 | 64 | FIP1L1, LAX1, SNRPE, ZC3H11A |
| CDKN2B, ERBB2, FIP1L1, RB1 | 54 | METTL1, TSFM, TSPAN31 |
| CDKN2B, ERBB2, LAX1, RB1 | 50 | METTL1, TSFM, TSPAN31 |
| CDKN2B, ERBB2, METTL1, RB1 | 64 | SNRPE, ZC3H11A |
| CDKN2B, ERBB2, RB1, TSFM | 50 | SNRPE, ZC3H11A |
| CDKN2B, ERBB2, RB1, TSPAN31 | 64 | TSFM, ZC3H11A |
Table 5: Genes and core subsets sampled when K is 5.
Glioblastoma multiform data 2 (GBM2)
We obtained the glioblastoma multiform data 2 from TCGA (2008). This data contains a mutation matrix of 90 samples and 1126 genes. As Table 7 shows, when k is 2 the three methods have detected three optimal gene sets with 58 as the maximum weight. Some of those sets include CDK4, CDKN2B, CDKN2A, CDKN2B and TP53, which are the core members of the cell cycle. However, there is no direct evidence supporting the relation between TSPAN31 and CDKN2B [19].
For k=3, we have detected 2 optimal gene sets that cover 66 samples, that is to say 73% of the diagnosed patients. The pair of genes (CDK4, CDKN2B) that we found when k was set as 2 contained RB1. These sets were detected as a potential pathway and were a subset of the set (CDK4, CDKN2B, ERBB2, RB1) in Glioblastoma Data 1. CDK4, CDKN2B and RB1 are all the core members of the cell cycle. When k is 4, the three algorithms sampled 6 optimal quadruplets of genes with the weight 60. However, there is no evidence supporting the relationship between the genes TSPAN31, MAN1A1, MET, NMBR with the triplet (CDK4, CDKN2B, RB1) and the pair of genes (CDKN2B, RB1). Therefore, we will proceed by removing these genes from the mutation matrix and make new experiments based on our Exact Algorithm.
The results shown in Table 6 reveal that when k is 4 and α=3, our Exact Algorithm samples 5 maximum weighted gene sets with 59 as the maximum weight. All the genes that form the quadruplet (CDK4, CDKN2A, RB1, TP53) are the core members of the Glioma; a tumor that starts in the brain and spinal cord. In addition, three gene sets have the triplet (CDK4, CDKN2B, RB1) as a core subset with the genes CPT1B, NF1 and PIK3R1 each one separately. As for CPT1B, it is a part of the AMPK signaling pathway. PIK3R1 is also a core member of the glioma while NF1 is a part of the MAPK signaling pathway. The last quadruplet (CDKN2A, MDM2, PIK3R1, TP53) encloses the gene MDM2 which is also a core member of the glioma and the cell cycle. On top of that, it is also it is a part of different signaling pathways such as the p53 signaling pathway.
| Optimal gene sets | Set size | Weight | Co-occurrence degree | Coverage | Covering patients |
|---|---|---|---|---|---|
| CDK4, CDKN2A, RB1, TP53 | 4 | 59 | 3 | 75 | 83% |
| CDK4, CDKN2B, CPT1B, RB1 | 4 | 59 | 3 | 67 | 74% |
| CDK4, CDKN2B, NF1, RB1 | 4 | 59 | 3 | 71 | 78% |
| CDK4, CDKN2B, PIK3R1, RB1 | 4 | 59 | 3 | 67 | 74% |
| CDKN2A, MDM2, PIK3R1, TP53 | 4 | 59 | 3 | 71 | 78% |
| CDKN2A, MDM2, MDM4, PIK3R1, TP53 | 5 | 56 | 3 | 72 | 80% |
Table 6: New results after removing TSPAN31, MAN1A1, MET and NMBR from the mutation matrix.
| Optimal gene sets | Set size | Weight | Co-occurrence degree | Coverage | Covering patients |
|---|---|---|---|---|---|
| CDK4, CDKN2B | 2 | 58 | 2 | 60 | 67% |
| CDKN2A, TP53 | 2 | 58 | 2 | 64 | 71% |
| CDKN2B, TSPAN31 | 2 | 58 | 2 | 60 | 67% |
| CDK4, CDKN2B, RB1 | 3 | 63 | 2 | 66 | 73% |
| CDKN2B, RB1, TSPAN31 | 3 | 63 | 2 | 66 | 73% |
| CDK4, CDKN2B, MAN1A1, RB1 | 4 | 60 | 2 | 67 | 74% |
| CDK4, CDKN2B, MET, RB1 | 4 | 60 | 2 | 67 | 74% |
| CDK4, CDKN2B, NMBR, RB1 | 4 | 60 | 2 | 67 | 74% |
| CDKN2B, MAN1A1, RB1, TSPAN31 | 4 | 60 | 2 | 67 | 74% |
| CDKN2B, MET, RB1, TSPAN31 | 4 | 60 | 2 | 67 | 74% |
| CDKN2B, NMBR, RB1, TSPAN31 | 4 | 60 | 2 | 67 | 74% |
| CDK4, CDKN2B, MAN1A1, MET, RB1 | 5 | 57 | 3 | 68 | 76% |
| CDK4, CDKN2B, MET, NMBR, RB1 | 5 | 57 | 3 | 68 | 76% |
| CDKN2B, MAN1A1, MET, RB1, TSPAN31 | 5 | 57 | 3 | 68 | 76% |
| CDKN2B, MET, NMBR, RB1, TSPAN31 | 5 | 57 | 3 | 68 | 76% |
Table 7: Results of the exact algorithm in GBM2.
For k=5, the Exact Algorithm has sampled (CDKN2A, MDM2, MDM4, PIK3R1, TP53) as an optimal gene set. This gene set is important due to the fact that it covers 72 samples, 80% of the patients, and is formed by the quadruplet (CDKN2A, MDM2, PIK3R1, TP53), which was already sampled when k was 4. MDM4 is as MDM2, both are parts of the p53 signaling pathway.
Glioblastoma multiform data 3 (GBM3)
We acquired the glioblastoma data 3 from Zhao et al.[19]. This mutational matrix is not different from GBM1, it contains the data of 178 mutated genes in 84 patients. When k is 2, the gene set (EGFR, NF1) was sampled by the three algorithms with the weight of 50. This pair of genes covers 61% of the samples, as Table 8 shows. EGFR is an important gene since it serves as a stimulus for cancer growth and it plays an important role in the regulation of cellular homeostasis. It is also a core member of different signaling pathways such as ErbB signaling pathway, FoxO signaling pathway and MAPK signaling pathway. NF1 is a core member of the Ras signaling pathway and the MAPK signaling pathway.
| Optimal gene sets | Set size | Weight | Co-occurrence degree | Coverage | Covering patients |
|---|---|---|---|---|---|
| EGFR, NF1 | 2 | 50 | 2 | 51 | 61% |
| MTAP, NF1, TSFM | 3 | 54 | 2 | 59 | 70% |
| MTAP, NF1, TSPAN31 | 3 | 54 | 2 | 59 | 70% |
| MTAP, PTEN, TSFM | 3 | 54 | 2 | 67 | 80% |
| MTAP, PTEN, TSPAN31 | 3 | 54 | 2 | 67 | 80% |
| DOCK1, GLI1, MTAP, PTEN | 4 | 55 | 2 | 65 | 77% |
| DOCK1, GLI1, KDR, MTAP, PTEN | 5 | 54 | 3 | 67 | 80% |
Table 8: Results of the exact algorithm in GBM3.
For k=4, a unique optimal gene set was detected with the weight of 55. The gene set (DOCK1, GLI1, MTAP, PTEN) covers 77% of the samples. It includes DOCK1, which is a gene that is crucial in some biological functions including cell proliferation and gene expression. As for GLI1, it is a core member of the Hedgehog signaling pathway, which helps to control cell proliferation and stem cell maintenance and development. MTAP plays an essential role in Cysteine and methionine metabolism. Finally, the mutation of PTEN revealed a relationship with several types of cancers including breast cancer, endometrial cancer, Lung cancer and Prostate cancer. Concerning Glioblastoma multiform, PTEN also plays an important role in the glioma cell proliferation.
When k is 5, unlike k=2,3 and 4, our Exact Algorithm detected the optimal solution; (DOCK1, GLI1, KDR, MTAP, PTEN) with a co-occurrence degree equal to 3. This gene set was sampled in 67 patients with 54 as the maximum weight. It is composed of the subset (DOCK1, GLI1, MTAP, PTEN), which was produced when k=4, with KDR. KDR is part of the Ras signaling pathway, the PI3K-Akt signaling pathway, the Rap1 signaling pathway, and even others. In addition, the same as EGFR and PTEN, KDR contributes in cellular homeostasis.
Head and neck squamous cell carcinoma (HNSCC)
HNSCC is a cancer that arises from squamous cells that line the moist inside part of the head and neck. It begins within the nose, mouth, and salivary glands. This cancer is known to be the world’s eighth most dangerous cancer type. We applied our Exact Algorithm, the BLP, and the GA to the HNSCC data that we retrieved from Stransky et al. [26]. It has a mutation matrix of 84 patients and 4920 genes.
When k is 2, the three algorithms mentioned sampled 2 pairs of genes, (MLL3, TP53) and (PKP4, TP53) as shown in Table 9. The MLL3 detection is vital because most of HNSCC cells harbor multiple mutations in epigenetic modifiers and signifies that MLL3 that may lead to HNSCC initiation and progression [27]. In addition, PKP4 is primarily associated with cell proliferation or cell cycle [28] while TP53 plays different roles in different cancer types and is a core member of different pathways as well as the p53 signaling pathway. It is clearly noticeable from Table 9 that TP53 is everywhere in the gene sets produced. Furthermore, several studies confirmed that mutations of the TP53 gene were the most frequent of all somatic genomic alterations in HNSCC [29].
| Optimal gene sets | Set size | Weight | Co-occurrence degree | Coverage | Covering patients |
|---|---|---|---|---|---|
| MLL3, TP53 | 2 | 49 | 2 | 50 | 60% |
| PKP4, TP53 | 2 | 49 | 2 | 50 | 60% |
| PIK3CA, PKP4, TP53 | 3 | 51 | 3 | 54 | 64% |
| PKP4, RUFY1, TP53 | 3 | 51 | 3 | 53 | 63% |
| EPHA7, PIK3CA, PKP4, TP53 | 4 | 51 | 2 | 56 | 67% |
| FAM135B, PIK3CA, PKP4, TP53 | 4 | 51 | 2 | 57 | 68% |
| FAM135B, PKP4, RUFY1, TP53 | 4 | 51 | 2 | 56 | 67% |
| FBXW7, PIK3CA, PKP4, TP53 | 4 | 51 | 2 | 56 | 67% |
| KCNA6, PIK3CA, PKP4, TP53 | 4 | 51 | 2 | 56 | 67% |
| KIAA1109, PIK3CA, PKP4, TP53 | 4 | 51 | 2 | 56 | 67% |
| LAMA1, PIK3CA, PKP4, TP53 | 4 | 51 | 2 | 56 | 67% |
| LAMA1, PKP4, RUFY1, TP53 | 4 | 51 | 2 | 55 | 65% |
| MYPN, PKP4, RUFY1, TP53 | 4 | 51 | 2 | 55 | 65% |
| NCOR1, PIK3CA, PKP4, TP53 | 4 | 51 | 2 | 56 | 67% |
| NFE2L2, PIK3CA, PKP4, TP53 | 4 | 51 | 2 | 56 | 67% |
| PIK3CA, PKP4, RUFY1, TP53 | 4 | 51 | 2 | 56 | 67% |
| PIK3CA, PKP4, SACS, TP53 | 4 | 51 | 2 | 56 | 67% |
| PIK3CA, PKP4, TP53, ZNF423 | 4 | 51 | 2 | 55 | 65% |
Table 9: Results of the exact algorithm in HNSCC.
For k=3, the optimal gene sets sampled are composed of the pair of genes (PKP4, TP53), which was previously sampled when k was 2 along with PIK3CA and RUFY1. The gene RUFY1 participates in endocytosis, the process by which cells remove ligands and some nutrients from the surface in order to bring them in the cell interior. Mutations in the PIK3CA gene have been reported in several human cancer types, including colon, brain, and stomach cancer. Qiu et al. [30] have shown that a high frequency of somatic mutations in this gene has been associated with HNSCC cancer development. Note that (PIK3CA, PKP4, TP53) and (PKP4, RUFY1, TP53) were sampled in 64% and 63% of the diagnosed patients respectively, with a co-occurrence degree of 3 when using our Exact Algorithm.
When k is 4, we have detected several optimal solutions. Again, our Exact Algorithm has shown worthy ability in maximizing the number of potential pathways. In comparison, the GA [19] has detected 5 optimal solutions; the BLP [19] has produced 1 while our Exact Algorithm sampled 14 optimal gene sets with a co-occurrence degree of 2 and a maximum weight of 51.
As shown in Table 9, when k is 4, 11 of the gene sets sampled by our Exact Algorithm have (PIK3CA, PKP4, TP53) as a core subset with the genes EPHA7, FAM135B, FBXW7, KCNA6, KIAA1109, LAMA1, NCOR1, NFE2L2, SACS and ZNF423 each one separately. The remaining 3 optimal solutions are also formed by the subset (PKP4, RUFY1, TP53) which was previously produced as optimal gene set when k was 3, and the three genes FAM135B, LAMA1 and MYPN each one separately. LAMA1 is a part of the PI3K-Akt signaling pathway and is imperative in some biological processes like cell motility, cell proliferation, and cell survival. The two gene sets (LAMA1, PIK3CA, PKP4, TP53) and (LAMA1, PKP4, RUFY1, TP53), the gene’s mutation level covers 67% and 65% of the patients respectively. Recent studies have identified an important role in NFE2L2 when it comes to HNSCC carcinogenesis [31]. On another note, FBXW7 takes a part in the eukaryotic cellular processes, while NCOR1 is the core member of the thyroid hormone signaling pathway, which plays a key factor in growth development and metabolism.
Conclusion
The aim of this work was to come up with a new approach in identifying driver genes and driver pathways that can be supportive in designing treatments for human cancer. We first introduced a new constraint that we have called “approximate exclusivity” in order to identify multiple driver pathways and find gene sets whose weights are maximized. It is about finding group of genes respecting the cooccurrence degree α that determines the number of mutations, which each patient has in the pathway. Then we designed a new algorithm, based on an exact approach to solve the maximum weight submatrix problem while taking into consideration the approximate exclusivity constraint.
After that, we compared the results with both the Binary Linear Programming model and the Genetic Algorithm [19]. In simulated data, our Exact Algorithm has shown excellent ability in maximizing the weight and detecting more driver pathways than the GA does. The BLP model is a good model to detect the maximum weight in less time. However, it cannot detect more than one pathway. In addition, the GA [19] cannot reach the maximum weight when the mutational matrix is dense or when the k value is beyond 3. For maximizing the number of pathways, the difference between our exact algorithm, the BLP model and the GA is significantly noticeable especially when the number of genes increases. For example, when k was 3 the difference between the number of pathways sampled by the GA and our exact algorithm was 1283. Our exact algorithm is very effective, since it detects all the pathways that exists in the mutation matrix.
In biological data, our Exact Algorithm produced many potential driver genes and driver pathways that have not been discovered before. For example, in Glioblastoma Data 1, our Exact Algorithm sampled 31 optimal results when k was 5. Until now there has been no relationship reported between some of the genes detected, but It could be a real case of study in future works to try to elucidate and determine the real difference between driver mutations and random passenger mutations.
Acknowledgement
This work was supported by the grants of the National Science Foundation of China (Grant Nos. 61472467 and 61672011) and the Collaboration and Innovation Center for Digital Chinese Medicine of 2011 Project of Colleges and Universities in Hunan Province.
References
- Pray L (2008) DNA Replication and causes of mutation. Nature Education 1:214.
- Clancy S (2008) Genetic mutation. Nature Education 1:187.
- Sjoblom T, Jones S, Wood LD, Parsons DW, Lin J, et al (2006) The consensus coding sequences of human breast and colorectal cancers 314:268-274.
- Ding L, Getz G, Wheeler DA, Mardis ER, McLellan MD, et al (2008) Somatic mutations affect key pathways in lung adenocarcinoma. Nature 455:1069-1075
- Chin L, Meyerson M, Aldape K, Bigner D, Mikkelsen T, et al (2008) Comprehensive genomic characterization defines human glioblastoma genes and core pathways. Nature 455:1061-1068.
- Vandin F, Upfal E, Raphael BJ (2012) Finding driver pathways in cancer: models and algorithms. Algorithm Mol Biol 7:23.
- Getz G, Hofling H, Mesirov JP, Golub TR, Meyerson M (2007) Comment on "The consensus coding sequences of human breast and colorectal cancers" Science 317.
- Hahn WC, Weinberg RA (2002) Modelling the molecular circuitry of cancer. Nat Rev Cancer 2:331-341.
- Vogelstein B, Kinzler KW (2004) Cancer genes and the pathways they control. Nat Med 10:789-799
- Youn A, Simon R (2011) Identifying cancer driver genes in tumor genome sequencing studies. Bioinformatics 27:175-181.
- Lawrence MS, Stojanov P, Polak P, Kryukov GV, Cibulskis K, et al (2013) Mutational heterogeneity in cancer and the search for new cancer-associated genes. Nature 499: 214-218.
- Zhang J, Zhang S (2016) The Discovery of Mutated Driver Pathways in Cancer: Models and Algorithms. IEEE/ACM transactions on computational biology and bioinformatics.
- Dees ND, Zhang QY, Kandoth C, Wendl MC, Schierding W, et al (2012) MuSiC: Identifying mutational significance in cancer genomes. Genome Res 22:1589-1598.
- Vandin F, Upfal E, Raphael BJ (2011) Algorithms for detecting significantly mutated pathways in cancer. J Comput Biol 18:507-522.
- Leiserson MDM, Vandin F, Wu HT, Dobson JR, Eldridge JV, et al (2015) Pan-cancer network analysis identifies combinations of rare somatic mutations across pathways and protein complexes. Nat Genet 47:106-114.
- Cerami E, Demir E, Schultz N, Taylor BS, Sander C (2010) Automated network analysis identifies core pathways in glioblastoma. Plos One.
- Ciriello G, Cerami E, Sander C, Schultz N (2012) Mutual exclusivity analysis identifies oncogenic network modules. Genome Res 22:398-406.
- Vandin F, Upfal E, Raphael BJ (2012) Algorithms and genome sequencing: identifying driver pathways in cancer. Computer 45:39-46.
- Zhao JF, Zhang SH, Wu LY, Zhang XS (2012) Efficient methods for identifying mutated driver pathways in cancer. Bioinformatics 28:2940-2947.
- Vandin F, Upfal E, Raphael BJ (2012) De novo discovery of mutated driver pathways in cancer. Genome Res 22:375-385.
- Yan C, Li HT, Guo AX, Sha W, Zheng CH (2014) Simulated Annealing Based Algorithm for Mutated Driver Pathways Detecting. Lect Notes Artif Int 8589:658-663.
- Wang SL, Tan YY (2016) Dynamically Heuristic Method for Identifying Mutated Driver Pathways in Cancer. Lect Notes Comput Sc 9771:366-376.
- Wu H, Gao L, Li F, Song F, Yang XF, et al (2015) Identifying overlapping mutated driver pathways by constructing gene networks in cancer. Bmc Bioinformatics 16:S3.
- Kharroubi F, He J, Tang J, Chen M, Chen L (2015) Evaluation performance of genetic algorithm and tabu search algorithm for solving the Max-RWA problem in all-optical networks. J Comb Optim (2015) 30: 1042.
- Kharroubi F, He J, Chen L (2014) Performance Analysis of GA, ROA, and TSA for Solving the Max-RWA Problem in Optical Networks Optical Fiber Communication Conference, OSA Technical Digest Paper W2A 48.
- Stransky N, Egloff AM, Tward AD, Kostic AD, Cibulskis K, et al (2011) The mutational landscape of head and neck squamous cell carcinoma. Science 333:1157-1160.
- Martin D, Abba MC, Molinolo AA, Vitale-Cross L, Wang ZY, et al (2014) The head and neck cancer cell oncogenome: a platform for the development of precision molecular therapies. Oncotarget 5:8906-8923.
- Ajiro M, Jia R, Yang YQ, Zhu J, Zheng ZM (2016) A genome landscape of SRSF3-regulated splicing events and gene expression in human osteosarcoma U2OS cells. Nucleic Acids Res 44:1854-1870.
- Zhou G, Liu ZY, Myers JN (2016) TP53 Mutations in Head and Neck Squamous Cell Carcinoma and Their Impact on Disease Progression and Treatment Response. J Cell Biochem 117:2682-2692.
- Qiu WL, Schonleben F, Li XJ, Ho DJ, Close LG, et al. (2006) PIK3CA mutations in head and neck squamous cell carcinoma. Clin Cancer Res 12:1441-1446.
- Sheth S, Weissfeld JL, Romkes M, Ferris RL, Grandis JR, et al (2015) Germline variation in NFE2L2/CUL3/KEAP1 and risk of head and neck squamous cell carcinoma (HNSCC). J Clin Oncol.