Research Article, Endocrinol Diabetes Res Vol: 4 Issue: 1
Childhood obesity in Makkah City
Adil Omar Bahathiq*
Department of Physiology, Faculty of Medicine, Um-Alqura University, Saudi Arabia
*Corresponding Author : Adil Omar Bahathiq
Department of Physiology, Faculty of Medicine, Um-Alqura University, Saudi Arabia
Tel: +966 12 550 1000
E-mail: drbahathiq@hotmail.com
Received: August 28, 2017 Accepted: March 30, 2018 Published: April 03, 2018
Citation: Bahathiq AO (2018) Childhood obesity in Makkah City. Endocrinol Diabetes Res 4:1. doi: 10.4172/2470-7570.1000129
Abstract
Abstract
Objective: The present study used to asses’ obesity in Saudi female children represented by Makkah school children using body mass index (BMI) and waist circumference (WC).
Methods: One thousand and fifty seven children (n =1057), their age were between 6- 15 years old, are participated in this study. Parameters of measuring include height, weight, waist circumference (WC) and blood pressure.
Results: According to BMI percentile the participated children were divided into three groups, 65 children were less than 5th percentile which considered underweight, 502 children were from 5th – 85th percentile which considered normal and 490 children were more than 85th percentile which considered obese. 37.3% of obese children have a high blood pressure. So, hypertension was positively correlated with BMI in obese children.
Conclusion: Obesity is a chronic disorder that has multiple causes. However, obesity changes in response to many features like life style, physical activity, diet and genetic factors. Obese children are more likely to have cardiovascular diseases, digestive diseases and hypertension in adulthood as compared with those who are lean or normal. Childhood obesity has rapidly increased in Saudi Arabia that it became a very series disturbing problem.
Keywords: Obesity; Blood pressure; Diet; Hypertension
Introduction
Obesity is simply defined as abnormal amount of fat on the body. The term usually not employed unless the individual is form 20% - 30% over average weight for his or her age, sex, and height [1]. Excess fat accumulation is associated with increase in the size (hypertrophy) as well as the number (hyperplasia) of adipose tissue cell [2]. The prevalence of obesity has increased over worldwide. More than 1.1 billion adults worldwide are overweight and 312 million of them are obese, and the obesity in children reaches to at least 155 million overweight or obese, Task force and world health organization have definition of obesity to adjust for ethnic differences which can be reflect an even higher prevalence with 1.7 billion as overweight worldwide [3]. In developing and developed countries, the childhood obesity is a global epidemic and rising trends in overweight and obesity [4]. During the past 3 decades, the kingdom of Saudi Arabia undergo several changing trend in nutritional habits and activities of children, this may be the cause of high level of both overweight and obesity. School-aged children and adolescents are different in several province of Saudi Arabia. The eastern province is the highest value of obesity whiles the lowest value rates, were in the southern province. The overall prevalence is around 27.5% among boys (11.7% overweight and 15.8% obese) between 6 and 18 years old in 1996 and 28.0% among girl between 12 and 19 years old in 1999 [5]. There are different methods to measure body fatness but some of them are inaccurate and many are unsuitable for routine clinical use in children and adults Body. Mass Index is the most frequently used measure of weight in relation to height and Waist Circumference reflects total and abdominal fat levels.
Causes of childhood obesity include
Behavioural and Social Factors (Type of food, Diet, Calorie Intake, Fat Intake, Other Dietary Factors), Physical Activities, Psychosocial Factors, Environmental Factors (Effects of Dietary Pattern and Television Watching), Genetic factors, Endocrine Effects, Neurologic Effects, and Medications Effects. Complication of Obesity include: Diabetes, Hypertension, Depression, Cardiovascular Disease, Breathing Problem and Early Maturation. Management of Childhood Obesity include: Conventional Management of Childhood Obesity (Family Involvement, Developmentally Appropriate Approach, Dietary Change, Increased Physical Activity and Decreased Sedentary behaviour, Behaviours Modification and Intervention Type and Setting) and Non-conventional management of childhood obesity (Very Low Calorie Diets and Drug Therapy Obesity (bariatric) Surgery).
Materials and Methods
Volunteers
Makkah was divided into 4 regions: West, East, North, and South. Two schools were chosen randomly to represent each region. A total of 1075 female children were participated in this study. They were different age’s groups. Their ages were from 6-14 years old. Each volunteer participate was supplied with a questionnaire and consent which dealt confidentially. The study was carried out in 8 different school regions at Makkah randomly and volunteers were chosen randomly.
Equipment’s
We used a weight scale (Personenwaage type; GS19, Glass bathroom scale, Beurer company, Made in China), height scale, measuring tape and an automatic sphygmomanometer (Digital Automatic Blood Pressure Monitor MX2 Basic, Omron Company, Made in Japan).
BMI calculation
Body Mass Index was calculated by the following equation: BMI = weight (Kg) / height (meter2) After BMI was calculated, it was drown on growth chart that match between BMI and age of child and the result was record in percentile. According to BMI, volunteers were dividing into 3 groups: Group 1 is under weight: When they are less than 5th percentile. Group 2 is healthy weight: When they are 5th percentile to less than the 85th percentile. Group 3 is obese: When they are more than 85th percentile.
Waist circumference
To measure waist circumference, locate the top of the hip bone and the top of the iliac crest. Place the tape measure evenly around the abdomen at the level of iliac crest. Read the tape measure and record the waist circumference in centimetre. For normal range, use quarter method from statistical analysis to get cut off point. Quarter method is getting ±25% around the main. According to that, minimal level is 25% before the main (which was 50%), and maximal level is 75% (by adding 25%) after the main.
Hypertension
Automatic sphygmomanometers were used to measure their systolic and diastolic blood pressure.
Results
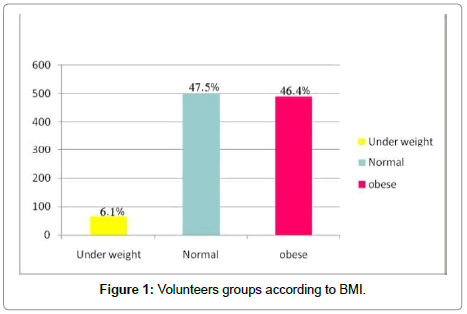
1057 Children were recruited; their ages were from 6-15 years old. According to BMI percentile the participated children were divided into three groups, 65 children were less than 5th percentile which considered underweight, 502 children were from 5th-85th percentile which considered normal and 490 children were more than 85th percentile which considered obese (Figure 1).
Waist circumference
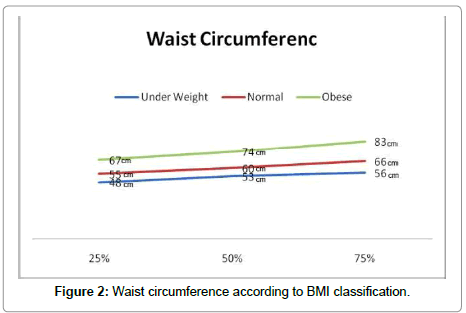
Quarter method used to calculate waist circumference, Minimal value was at 25% which is less frequent number and maximal value was at 75% which is highest frequent number. Minimal level for underweight children was 48 cm while maximal level was 56 cm, for normal children minimal level was 55 cm and maximal level was 66 cm and for obese children minimal level was 67 cm and maximal level was 83 cm (Figure 2).
BMI and hypertension
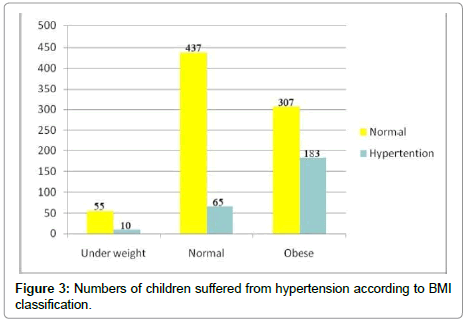
24.4% of children suffered from hypertension and 71% of them were obese (Figure 3).
Fathers obesity
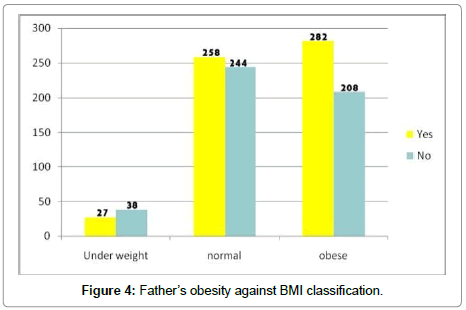
567 fathers of children participated in this study was obese and 53.6% of their children were obese too (Figure 4).
Mothers obesity
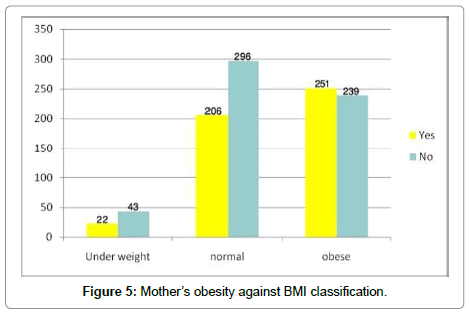
479 mothers of participated children were obese (Figure 5).
Obesity and Daily Activity
Physical activity
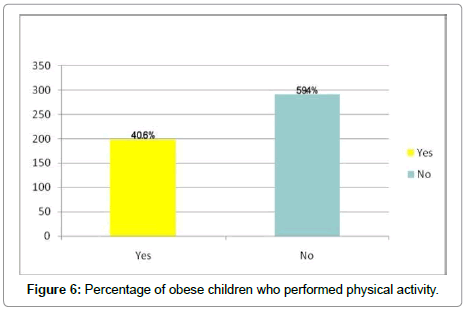
40.6% of obese female children were undergoing physical activity from 490, while 59.4% were not performing any activity. There was a negative correlation between physical activity and obesity (r=115, P<0.05) (Figure 6).
Sleeping hours
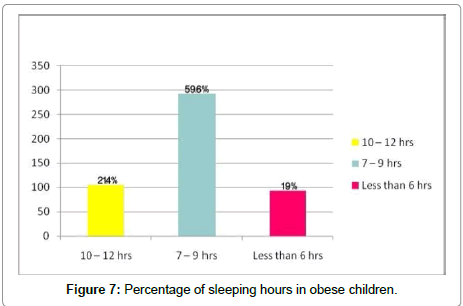
59.6% of obese children slept 7-9 hours per day and 19% have not slept more than six hours on the other hand 21.4%were slept around 10 hours per day. This study indicate that there is clear correlation between obesity and sleeping hours (r=117, P<0.01) (Figure 7).
Watching T.V
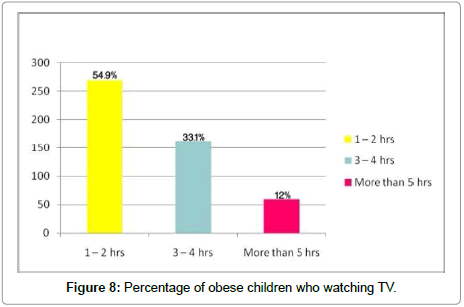
45% of obese children spent more than 3-4 hours daily in front of television while 54.9% spent 2hours only. There is clear correlation between watching television and obesity (r=164, P<0.01) (Figure 8).
Numbers of meals
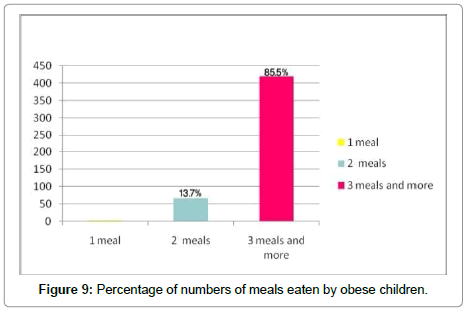
The rate of obesity does not depend just on the number of meals as much as it depends on the quantity and type of food (Figure 9).
Obesity and junk food
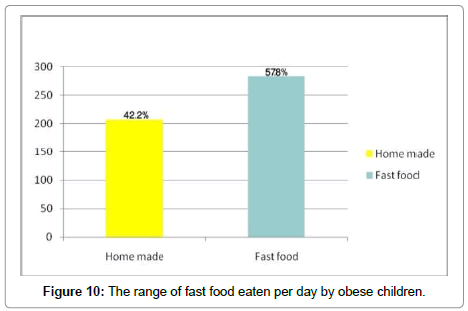
57.8% of the obese population prefers fast food, while 42.2% prefer homemade food. There is a clear correlation between favourite food and obesity(r=131, P<0.01) (Figure 10).
Obesity and restaurants meals
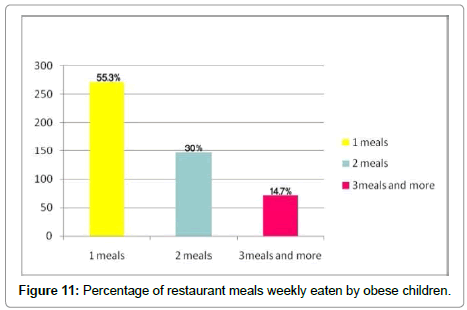
Most families of obese children buy one meal from restaurants per week. There is a clear correlation between number of restaurant meals and obesity (r=114, P<0.05) (Figure 11).
Obesity and soft drinks
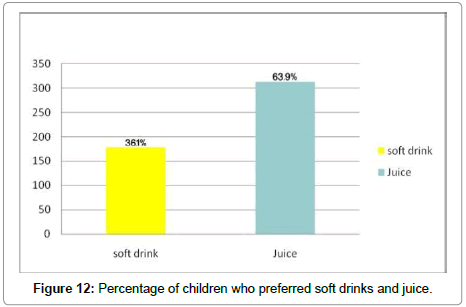
36.1% of obese children prefer soft drinks, while 63.9% prefer fresh juices. There was a negative correlation between favourite drinks and obesity(r=179, P<0.01) (Figure 12).
Discussion
The present study is the first to evaluate obesity in female Saudi children represented by Makkah School using BMI and WC as anthropometric measurements of obesity. Moreover, this study takes other factors in consideration such as, age and life style. In addition, it measures the systolic and diastolic blood pressure as one of the major complication of obesity.
Anthropometric measurement and obesity
There are different methods to measure body composition of fat but some of them are inaccurate and many are unsuitable for routine clinical use in children and adult. Body mass index is the most frequently used measure of weight in relation to high. In addition, to BMI it has been established that abdominal obesity assist by WC predicts obesity related health risk. The weight evidence indicated that WC with BMI predicted health risk better than dose BMI alone. The present study examined childhood obesity in different groups, underweight, normal and obese using both BMI and WC. In the present study children were divided in to 3 groups according to BMI and WC, less than 5th percentile (group 1: underweight), from 5th - 85th percentile (group 2: normal) and more than 85th (group3: obese). This study indicated that 6.1 % of children population in Makkah was underweight, 47.5% were normal and 46% were obese. Regarding to the result, it has been observed that the number of obese children were close to the number of normal children. This result is very alarming, because obesity is a series problem which associated with harmful complications. In the present study, the quarter method was used to calculate WC. The result represent that the highest minimal and maximal level of WC were found in obese children. So, there is a positive relation between BMI and WC which means that any increasing of BMI will be followed by increasing in WC and obesity (Figures 1 and 2).
Obesity and hypertension
Hypertension occurs more commonly in obese persons at any age. Once considered rare, primary hypertension in children has become increasingly common in association with obesity and other risk factors, including a family history of hypertension and an ethnic predisposition to hypertensive disease. Obese children are at approximately a 3-fold higher risk for hypertension than nonobese children. With the increasing prevalence of childhood weight problems, increased attention to weight related health conditions including hypertension is warranted [6] Evidence suggests that blood pressure in American children and adolescents is increasing in parallel with weight. Childhood obesity is the major cause of paediatric hypertension [7] Genetic, metabolic, and hormonal factors such as insulin resistance, increased serum aldosterone levels, salt sensitivity, and possibly elevated leptin levels are linked to the hypertension of obesity. Systolic blood pressure correlates positively with BMI, skinfold thickness, and waist to hip ratio in children and adolescents [8]. In fact, the risk of hypertension in children increases across the entire range of BMI values and is not defined by a simple threshold effect. It has been reported that a linear increase in the prevalence of diastolic hypertension in children of all race, gender, and age combinations as BMI increased across the normal range [9] Similarly, Sorof has found an increased in prevalence of systolic hypertension (based on a single set of measurements) as BMI percentile increased from the 5th to the 95th percentile [10] The current study indicated that 258 of 1057 children suffer from hypertension, 183 of them were obese. This is very alarming because it indicates that over 70% of children who’s suffering from hypertension are obese. So, there is a strong relation between obesity and hypertension (Figure 3).
Obesity and genetics factors
There are other reasons why an individual’s body might retain fat. Some people have a larger appetite than others. Their bodies seem to expect them to eat more often. For others, their bodies do not efficiently convert food to energy. They are more likely to convert the food they eat to fat. Scientists now think that heredity is an important factor in obesity. That is, some people may inherit from their parents a genetic predisposition to gain weight. A genetic predisposition is a natural tendency over which a person has some, but not complete, control. This theory has been supported by studies of adopted children. These children tend to have weight patterns more like those of their natural parents than those of their adoptive parents. This finding suggests that the children inherited from their natural parent their tendency to eat normally or excessively [11] similarly the present study found that children might inherit obesity from their parents. So, obesity of one parent may transmit the gene of obesity to their children. It also shows that 57.5% fathers of the obese children were obese and more than 51% mothers of the obese children were obese (Figures 4 and 5).
Life style and obesity
The life style refers to a person’s unique pattern of living. These patterns reflect our values and beliefs and involve what, how much, and when an individual chooses to eat; spend their time; and if they exercises regularly. Use of time is a life style choice, one person may spend leisure time watching TV and consuming large amount of snack foods unnecessarily; another person of similar age may spend leisure time reading books, practicing sport, or choose to walk [12].
Physical activity
A person can choose a lifestyle that will help burn up excess calories. A quit lifestyle spent watching television will not burn up many calories compared with one that includes jogging, swimming, walking, or other forms of exercise.13 Hear more, indicated that parents prefer having their children watching television at home rather than playing outside unattended because the parents are then able to complete their chores while keeping an eye on their children. In addition, increased proportions of children who are being driven to school and low participation rates in sports and physical education, particularly among adolescent girls are also associated with increased obesity prevalence [13]. Few studies have determined the association between physical activity, sedentary activity and body composition in very young children although it has been determined a critical time in the development of adiposity. Significant associations have been demonstrated between physical activity and fatness [14]. The present study shows more than half of children population from all groups do not perform any physical activity because the female school children are not engaged in any kind of sport activity at school or at home. Also, the current study indicates that 59.4% of the obese children do not do any physical activity (Figure 6).
Sleeping hours
Other factor may contribute in child obesity is sleeping. It has been reported that children who sleep less, have a great appetite, which causes in more food consumption in their regular daily life than others. The present study shows the relation between the range of sleeping in obese children, and what is considered in normal rang. Obesity in children and teenagers is associated not only with obesity in adulthood, but also with an increased risk for heart disease, diabetes, and high blood pressure later in life. But what dose weight has to do with sleep? First, there are now a number of studies which suggested that there is a link between sleep loss and weight gain. Other research has also found a negative relationship between weight and sleep in children. Children who got less than nine hours of sleep had an almost three times greater risk of being obese compared to children who got ten or more hours [15]. In the present study, 19% of obese children sleep less than 6 hours, 59.6% sleep between 7 to 9 hours and only 21.4% sleep 10 to 12 hours (Figure 7). In addition, some of these studies suggested that the risk of obesity decreases with each additional hour that your child sleeps [16].
Television watching
Television watching has been directly linked to obesity in childhood, with a rate of obesity in childhood, reach to 8.3 times greater in children who watch over 5 h of TV per day compared with those who watch 2 h or less of television per day [17]. The present study found that more than 45% of obese children watch TV 3 to 4 hours and more which indicates that watching TV considered being one of the important causes of obesity (Figure 8). On the other hand, 57% of children who’s having normal weight watch TV less than 2 hours. Furthermore, decrease TV viewing and decreasing the number of meals eaten while watching TV yielded significant reduction in BMI and in skinfold thickness among girls [13].
Food
Over the last decades, food has become more affordable to larger numbers of people as the price of food has decreased substantially relative to the income. The concept of food has change form a means of nourishment to source of pleasure [13].
Junk Food
Rates of obesity have increased dramatically among children in Saudi Arabia. Although an increase in consumption of food prepared away from home has paralleled with overweight trends, few data exists to study the relation between food prepared away from home and change in BMI in children. In this prospective study, it has been found that children who increase their consumption of fried food away from home (FFA) tend to gain weight. Although the effect may seem to be small, it is a practical significance because it is the effect of 1 year of intake of FFA. The above study suggests that eating large quantities of FFA year after year accumulates to larger weight gains that are clinically significant. This study shows that consumption of FFA and fast foods may have harmful effects on body weight and diet quality [18]. This prospective study found that 57.8% of the obese children prefer fast food than regular homemade food and indicates the relation between fast Food & childhood obesity (Figures 9 and 10).
Restaurants food
Change in diet has also contributed to pediatric obesity. In additional to a baseline increase in portion sizes, most fast food restaurants offer up to 20% larger portion sizes for minimal additional cost, adding hundreds of extra calories. Also, Fast food restaurants are marketed to children using toys, music, and social icons through television commercials. Studies have found that children’s food preferences are influenced by just 30 sec exposures to television commercials. Additionally, many schools now offer fast food concessions as an alternative to school lunch. Even children who receive free school lunches will spend their money to buy preferred high fat food [19]. This study indicates that more than 147 of obese children were eaten two meals from restaurants per week and 72 of them eat more than three meals per week, while 303 of normal children eat one meal per week. This indicates that eating from restaurants may act as contributory factor of childhood obesity (Figure 11).
Types of drinks
A contributory factor seems to be the consumption of carbonated drinks sweetened with sugar. These drinks have a high glycaemic index and are energy dense. Children who drink one regular carbonated drink a day have an average 10% more total energy intake than non- consumers [20]. Dr David Ludwig of the Boston children’s hospital showed that school children drinking at least eight U.S fluid ounces (240 ml) or more of regularly sweetened drinks daily. They will consume 835 calories (3,500 kilojoules) more than those avoiding soft drinks; i.e., children who drink soft drinks loaded with sugar tend to eat much more food than those who avoid soft drinks. Either those taking sugared drinks lack the same restraint on foods, or sugared drinks cause a rise in insulin that makes adolescents hungrier, causing them to eat more. Soft drinks (including diet soft drinks) are also typically consumed with other high-calorie foods such as fast food. Children who drink soft drinks regularly are therefore fatter on average; in addition to being more likely to develop diabetes later in life [21]. It has been found in the current study that the most children like beverage and soft drinks more than healthy drinks (Figure 12).
References
- Taber's cyclopedic medical dictionary.
- Stedman's medical dictionary.
- Hossain P, Kawar B, Nahas M (2007) Obesity and Diabetes in the Developing World A Growing Challenge.
- Al-Hazzaa H, Al-Rasheedi A (2007) Adiposity and Physical Activity level among Preschool Children in Jeddah, Saudi Arabia.
- Al-Saeed W, Al-dawood K, Bukhai I, Bahnassy A (2007) Prevalence and socioeconomic risk factors of obesity among urban female student in Al-Khobar city, Eastern Saudi Arabia. American Academy of Pediatrics, Committee on Public Education. Children, adolescents, and television. Pediatrics 107: 423-426.
- Ogden C, Carroll M, Curtin L, McDowell M, Tabak C, et al. (2006) Prevalence of overweight and obesity in the United States, JAMA 295: 1549-1555.
- Mathew L, Hansen M, Paul W, Gunn B, David C, et al. (2007) Underdiagnosis of hypertention in children and Adolescent. Journal of American Medical Association 298: 874-879.
- Lurbe E, Alvarez V, Redon J (2001) Obesity, body fat distribution, and ambulatory blood pressure inchildren and adolescents. J Clin Hypertens (Greenwich) 3: 362-367.
- Rosner B, Prineas R, Daniels S, Loggie J (2000) Blood pressure differences between blacks and whites in relation to body size among US children and adolescents. Am J Epidemiol 151: 1007-1019.
- Sorof J, Poffenbarger T, Franco K, Bernard L, Portman R, et al. (2002) Isolated systolic hypertension, obesity, and hyperkinetic hemodynamic states in children. J Pediatr 140: 660-666.
- National Obesity Research Foundation Temple University, Weiss Hall 867, Philadelphia.
- Farghaly, Bothaina M, Hoda M, Ali A, Fuad A, et al. (2007) Life style and nutrition of students in Abha. Saudi Med journal 415.
- Dehghan M, Danesh N, Merchant A (2005) Childhood obesity, prevalence and prevention. Nutritional Journal 24.
- Janz K, Lev S, Burns T, Tornerj C, Willing M, et al. (2002) “Physical activity and Television viewing in Children During the adiposity Rebound period: The low Bone development Study. Preventative Medicine 35: 563-571.
- Reilly J, Juli A, Emmet P, Dorsty A, Colin S, et al. (2005) Early life risk factor for obesity in childhood: cohort study. BMJ 330: 135
- Take charge of your child's sleep book.
- Dennison B, Erb T, Jenkins P (2002) Television viewing and television in bedroom associated with overweight risk among low-income preschool children. Pediatrics 109: 1028 -1035.
- Elsie M, Catherine S, Sheryl L, Rifas S, David S, et al. (2005) Association of Consumption of Fried Food Away from Home with Body Mass Index and Diet Quality in Older Children and Adolescents, 116.
- Miller A, Marder S, Essock S, Buchanan R, Casey D, et al. (2004) Physical health monitoring of patients with schizophrenia. Am J Psychiatry 161: 1334-1349.
- James J, Thomas P, Cavan D (2004) Preventing childhood obesity by reducing consumption of carbonated drinks: cluster randomised controlled trial. BMJ 328: 1237-1241.
- Ludwig D, Peterson K, Gortmaker S (2001) Relation between consumption of sugar-sweetened drinks and childhood obesity: a prospective, observational analysis. Lancet 357: 505-508.
 Spanish
  Chinese
  Russian
  German
  French
  Japanese
  Portuguese
  Hindi
Hindi 