Research Article, J Appl Bioinforma Comput Biol Vol: 12 Issue: 1
Computational Analysis of RNA Sequencing Dataset Reveals Novel Associations in Response to Artemisinin-Resistant Malaria: Implications in Drug Discovery and Design
CN Rahul1*, N Aiswarya2, JJeyakanthan1and K Sekar2
1Department of Bioinformatics, Alagappa University, Karaikudi, Tamil Nadu, India
2Department of Computational and Data Sciences, Indian Institute of Science, Bangalore, Karnataka, India
*Corresponding Author: CN Rahul
Department of Bioinformatics, Alagappa University, Karaikudi, Tamil Nadu, India
Tel: +919666011197;
E-mail: cnrahul@gmail.com
Received date: 23 January, 2023, Manuscript No. JABCB-23-61496;
Editor assigned date: 25 January, 2023, PreQC No. JABCB-23-61496 (PQ);
Reviewed date: 08 February, 2023, QC No. JABCB-23-61496;
Revised date: 15 February, 2023, Manuscript No. JABCB-23-61496 (R);
Published date: 22 February, 2023, DOI: 10.4172/2329-9533.1000245.
Citation: Rahul CN, Aiswarya N, Jeyakanthan J, Sekar K (2023) Computational Analysis of RNA Sequencing Dataset Reveals Novel Associations in Response to Artemisinin-Resistant Malaria: Implications in Drug Discovery and Design. J Appl Bioinforma Comput Biol 12:1.
Abstract
Background: Artemisinin and its derivatives, in combination with partner drugs currently represent the most effective and influential class of drugs in malaria treatment. Although Artemisinin Combination Therapy (ACT) continues to serve as a foundation for antimalarial therapy, numerous challenges have emerged over their continued usage for decades. ACT has recently been found to be losing efficacy in Southeast Asia (SEA). The current understanding of the Mechanism of Action (MOA) of artemisinin remains controversial. Several reports suggest that the artemisinin MOA involves multiple targets and it’s unlikely that the mutations in these drug targets are the cause of high level resistance. Among the reviewed drug targets, PI3 kinases and their pathway members are strongly implicated in resistance.
Material and methods: In this study, we reassessed an earlier experimental study representing an RNA sequencing dataset of a transcriptome from the trophozoite stage of the parasite in response to the artemisinin drug. We used differential gene expression analysis followed by enrichment analysis tools like GSEA and pathway analysis using Path view.
Results: Our computational analysis of the transcriptome dataset involves the usage of the most recent tools with updated annotation records. Results indicate the fatty acid biosynthesis pathway representing alpha-linolenic acid enzymes associated with artemisinin resistance. Hence, this study adds on to state that the FA biosynthesis pathway is to be targeted to overcome artemisinin resistance.
Conclusion: Further experimental studies will have implications for drug discovery and the design of second-generation antimalarials.
Keywords: DHA (Di-Hydro Artemisinin); Malaria; Resistance;
PI3 Kinase; RNA-sequence analysis; Differential Gene
Expression (DGE)
Introduction
Over several decades after its discovery, artemisinin remains our only sentinel against malaria and is the cornerstone among available antimalarial drugs. Artemisinin Combination Therapy (ACT) is now standard care for treatment, mainly caused by P falciparum. ACTs are curative, only when fast acting artemisinin is provided in combination with a slow acting partner drug that effectively mops up remaining parasites within three days of treatment mix [1]. However, several recent reports suggest parasites remain persistent even after three days of ACT course and this incomplete parasite clearance time has become a definition for artemisinin resistance. A delayed parasite clearance in the case of artemisinin resistance remains controversial, questioning the true indicator of resistance. Among the various biomarkers identified earlier, PfKelch13 is the primary biomarker of resistance, and several studies indicate Pfkelch13 mutations to be associated with delayed parasite clearance and hence confer resistance [2].
Alternatively, studies on Plasmodium falciparum PI3 kinases indicated their elevated expression levels in response to artemisinin. This as well increased lipid product Phosphatidylinositol 3-Phosphate (PI3P). The elevated PI3P levels induced artemisinin resistance in absence of Pfkelch13 mutations. This study suggests the relevance of other pathways involved in artemisinin resistance that might operate in a Pfkelch13 independent manner. The present study focuses on analyzing PI3kinases, PI3Ps and their associations with any other pathways. We can draw parallels to the elevation of PI3Kinases in cancer cells, where activation of the PI3 kinase pathway results in most of the oncogenic activity, being the master regulatory pathway. Its activity is implicated in cellular processes like cell growth, proliferation, survival, and apoptosis. In general, suppression or inhibition of PI3 kinase activity may block tumour growth [2]. Similarly, in malaria, evidence by biochemical analyses suggests that there is a reduced mass of PI3P levels in response to DHA (Di-Hydro Artemisinin), an active form of artemisinin [3]. Based on this, we can speculate that there could be additional factors conferring artemisinin resistance associated with PfPI3 kinases, PI3Ps and other kinases. Hence, in the present study, we reappraise an RNA sequencing dataset obtained from an experimental study representing the global profile of transcriptomic changes induced by DHA. In this study, of the three stages of the malaria parasite (ring, trophozoite and schizont), we analyzed the trophozoite stage as it is reported to show the most dramatic response with many genes showing a significant change in response to DHA. We anticipate and report from our analysis, any novel pathways that can confer artemisinin resistance apart from other likely changes reported in earlier studies during artemisinin resistance such as reduced hemoglobin endocytosis, acceleration of the Unfolded Protein Response (UPR) pathways, improved ability to manage oxidative damages and increased DNA replication reported in other stages [4].
Materials and Methods
Retrieval of RNA sequence dataset from SRA-NCBI
We obtained sequence data from a study reporting the transcriptional response to DHA drug [3]. The therapeutic concentration of DHA used in the study was 500 nM. The transcriptomic changes were compared across drug-treated and control. The dataset supporting the results from this study was available in the NCBI gene expression omnibus repository under the super series accession number GSE62136.3 RNA expression datasets and details were collected from the SRA database. The data were obtained under the following accession numbers SRX726879 (trophozoite untreated-replicate 1) SRX72688 (trophozoite untreatedreplicate 2) SRX726891 (trophozoite-treated with 500 nM DHAreplicate 1) SRX726892 (trophozoite-treated with 500 nM DHAreplicate 2) A total of four samples were grouped as two replicates under untreated category and two replicates under-treated category.
RNA sequence data analysis
Sequence reads were processed using RNA-seq data analysis toolgalaxy. Briefly, RNA-seq reads for each library were mapped using the RNA STAR tool (Version 2.7.8a). The ensemble genome browser for protist was used to obtain the reference genome sequence of Plasmodium falciparum 3D7 (ASM276v2) strain in FASTA format and its corresponding annotation file in GFF3 format. Upon mapping, the feature count tool (Version 2.0.1) was used to count both RNA-Seq reads for genomic features in SAM/BAM files. Differentially expressed genes from RNA-Seq data were detected in the method of DESeq2 [4]. Screening of differentially expressed genes was done based on cut-off value log2 fold change >0 and adj p-value <0.05.
Functional enrichment analysis
Gene Set Enrichment Analysis (GSEA) was performed post DGE analysis using a desktop version tool of GSEA (4.2.2) [5]. The GSEA tool, tests for enrichment of a gene set within a ranked list of genes. The normalized count's output file from DESeq2 was used as the input expression data file to run GSEA. Further, we used the parameters the “gene-set” permutation type, “no collapse” and the “ratio of classes” metric for ranking genes. These parameters were applied considering the sample size of two replicates in each category “treated” versus “untreated” of our dataset. The P. falciparum 3D7 reference organismspecific gene sets representing Gene Ontology (GO) were downloaded as a combined GMT file from the G: Profiler web page. The output generates a GSEA report discussing the positively enriched gene sets for the phenotype being studied providing statistically significant details such as Enrichment Scores (ES) and FDR. Furthermore, enrichment maps were generated using the EM app tool [6] from Cytoscape (3.8.2) [7].
Pathview web tool was used for pathway-based data integration and visualization. The Output of DGE generated from DESeq2 was mapped to KEGG pathways based on Log2 (FC) expression. The input used for Pathview analysis includes a table containing a column with Entrez IDs and another column with Log2 (FC) values [8-12].
Results
Differential gene expression analysis
In total, four samples of RNA-seq data were considered for DGE computational analysis two biological replicates under the ‘drug treated’ category and two under the ‘drug untreated’. Sample reads belonging to specific parasite stages were mapped to a total of 5767 genes from the P. falciparum 3D7 genome. Upon measuring gene expression, 715 genes were upregulated in response to ART drug Dihydroartemesisnin (DHA) and 514 genes were found to be downregulated. Summary of genome wide expression changes in P. falciparum after treatment with DHA has represented as A) Venn diagram of DGE genes and B) A Volcano plot with Log FC (x-axis) and -Log10 FDR (y-axis), with DGE genes represented as red dots and genes with no significant expression as blue dots (Figure 1).
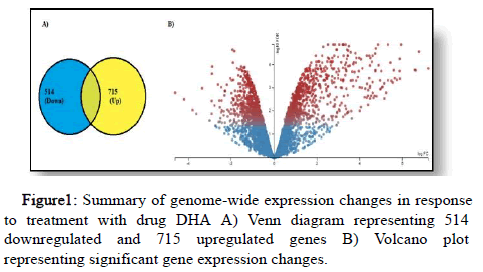
Figure 1: Summary of genome-wide expression changes in response to treatment with drug DHA A) Venn diagram representing 514 downregulated and 715 upregulated genes B) Volcano plot representing significant gene expression changes.
The genes responsible for kinase activity involved in the phosphatidyl inositol signaling system in Plasmodium falciparum were examined. The upregulated genes mainly include PF3D7_0110600 (phosphatidylinositol-4-phosphate 5-kinase), PF3D7_1316100 (inositl polyphosphate kinase, putative), PF3D7_1471400 (diacylglycerol kinase, putative), PF3D7_0515300 (phosphatidylinositol 3-kinase), PF3D7_1315600 (CDPdiacylglycerol-- inositol 3-phosphatidyltransferase). Among these, two genes were found to be statistically significant with adjusted pvalue< 0.05-they are inositol polyphosphate kinase, putative (0.000122) and diacylglycerol kinase, putative (0.02145).
Additionally, we curiously examined genes of glycerophospholipid metabolism and found the gene coding for the enzyme phospholipase, putative (PF3D7_0629300) were found to be highly expressed with a Log2 (FC)=2.628 and statistically significant adjusted pvalue= 2.02E-08. Other upregulated genes associated with this pathway include DNA-directed RNA polymerases I, II, and III subunit RPABC2, putative (PF3D7_0303300), FAD-dependent glycerol-3- phosphate dehydrogenase, putative (PF3D7_0306400), phosphatidyl glycerophosphate synthase (PF3D7_0820200), glycerol-3-phosphate 1- O-acyltransferase (PF3D7_1212500), CDP-diacylglycerol—inositol-3- phosphatidyltransferase (PF3D7_1315600), ethanolamine-phosphate cytidylyltransferase ((PF3D7_1347700), phosphatidylserine synthase, putative (PF3D7_1366800), choline kinase (PF3D7_1401800). These were not statistically significant at adjusted p-value<0.05.
Analysis of GSEA results
Among the gene sets provided for GSEA evaluation, 874/983 gene sets are upregulated in phenotype “Treated”. Out of these, 77 gene sets are significant at FDR (False Discovery Rate)<25%, 339 gene sets are significantly enriched at nominal p-value<1% and nominal pvalue< 5%. The top enrichment results obtained upon further analysis of 77 gene sets are indicated in Table 1.
Table 1: Gene Ontology analysis of genes up-regulated in response to DHA in P. falciparum from RNA-seq analysis.
The statistically significant GO terms (Table 1), the gene sets carboxylic ester hydrolase activity (GO:0052689), hydrolase activity, acting on ester bonds (GO:0016788), lipase activity (GO:0016298) and phospholipase activity (GO:0016791) show association with ALA metabolic pathway.
Generation of enrichment map
Enrichment map [6] was generated to visualize the gene set enrichment results as a network (Figure 2). Each gene set is represented as a node (solid red circles) and significant overlap between gene sets is represented by their connections called edges (blue lines). Additionally, the red color nodes implicate gene sets upregulated in response to the drug DHA. GO function is represented as A) GO:CC (Cellular Component), B) GO: BP (Biological Process) and C) GO:MF (Molecular Function).
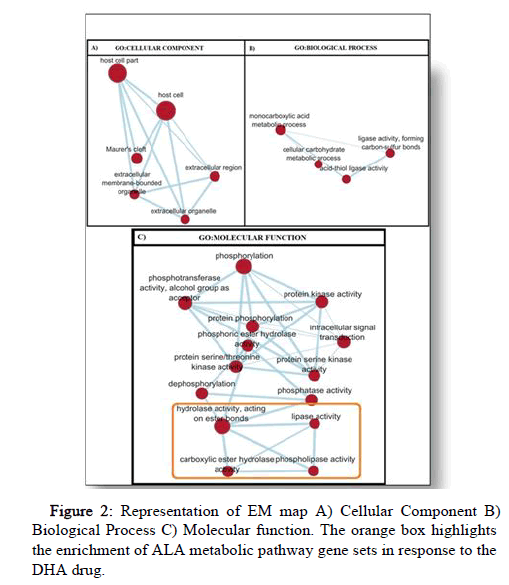
Figure 2: Representation of EM map A) Cellular Component B) Biological Process C) Molecular function. The orange box highlights the enrichment of ALA metabolic pathway gene sets in response to the DHA drug.
Pathway enrichment analysis
Pathview tool supports visualization of DGE results in individual pathways from the KEGG database, showing significant changes in response to drug DHA. The phosphatidylinositol signaling system and glycerophospholipid metabolism were analyzed. The phosphokinases analysed were differentially expressed in cohesion with earlier studies [4]. Additionally, we reviewed the glycerophospholipid metabolism (Figure 3) and suggest them to be associated with ALA metabolism and hence confer resistance against artemisinin.
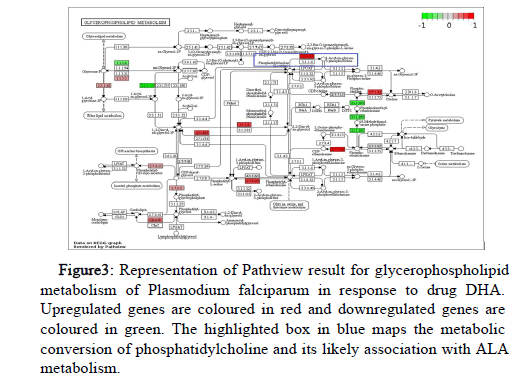
Figure 3: Representation of Pathview result for glycerophospholipid metabolism of Plasmodium falciparum in response to drug DHA. Upregulated genes are coloured in red and downregulated genes are coloured in green. The highlighted box in blue maps the metabolic conversion of phosphatidylcholine and its likely association with ALA metabolism.
Discussion
Upon performing RNA sequence analysis, we examined the differentially expressed genes of a specific parasite stage trophozoite in response to the drug DHA. Earlier Genome-Wide Association Studies (GWAS) suggest greater than 1000 genes show clinical resistance against artemisinin. Among them, Pfkelch13 (Primary biomarker) and kinases involving PI3P dependent signaling were shown to be the key molecular players to confer resistance against artemisinin [4]. They form the basis for understanding the molecular mechanism of artemisinin resistance. Nonetheless, the current understanding of the mechanism of action remains incomplete and the hunt for other key players is still on. In this context, we focused on PI3P dependent kinases and their association with any other functional systems that could be prime to confer resistance against artemisinin. This work gives insight into pathways that could be operational when resistance is conferred in absence of Pfkelch13 mutation, an important factor in artemisinin resistance to date. Both GSEA analysis and Enrichment Maps highlight lipases and phospholipase activity gene sets, the representing genes of the ALA metabolic pathway. These pathway genes remain largely unexplored from P. falciparum. ALA is produced from phosphatidylcholine upon the action of phospholipases. To date, only two enzymes, Patatin like phospholipase, putative (Pf3D7_0924000) and Lipase, putative (PF3D7_1427100) are mapped to this pathway [8]. The exact phospholipase involved in this conversion is yet to be characterized. These genes were found to be up regulated in response to DHA in our analysis. The pathway enrichment analysis using the Path view tool represents the glycerophospholipid metabolism. Among the up regulated genes, the enzyme encoding phospholipase (PF3D7_0629300) shares orthology (KEGG Ortholog: K00650) with lecithin-cholesterol acyltransferase [EC:2.3.1.43] is highly expressed in response to artemisinin and is significant in this pathway. This enzyme metabolically converts phosphatidylcholine to 1-acyl-sn-glycerol-3- phosphocholine,providing evidence for association with ALA metabolism (Figure 4).
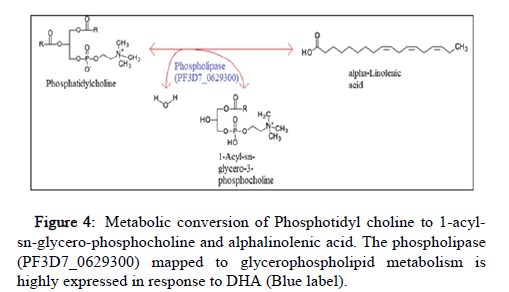
Figure 4: Metabolic conversion of Phosphotidyl choline to 1-acylsn- glycero-phosphocholine and alphalinolenic acid. The phospholipase (PF3D7_0629300) mapped to glycerophospholipid metabolism is highly expressed in response to DHA (Blue label).
In the ALA metabolism, the ALA fatty acid metabolite is subject to oxygenation by enzymes identified as Lipoxygenases resulting in hydroperoxides. This conversion is a critical step in the formation of oxylipins and is less explored in P. falciparum. Evidence from cancer studies on the role of oxylipins is important in PI3/AKT pathway activity and has implications for anticancer drug susceptibility [11]. On similar lines, the role of oxylipins is yet to be explored concerning artemisinin resistance. Our study gives a preliminary and useful perception of the importance of the ALA metabolic pathway associated with the PI3P Kinase signaling system through glycerophospholipid metabolism in artemisinin resistance.
Conclusion
Our report based on this primary investigation provides meaningful insight into the novel association of both ALA metabolic pathway and glycerophospholipid pathway, along with earlier established PI3 Kinase signaling system in artemisinin resistance. Further,experimental studies on these pathways would imply drug design and the discovery of novel antimalarials to overcome artemisinin resistance.
References
- Wang J, Xu C, Wong YK, LI Y, Liao F, et al. (2019) Artemisinin, the magic drug discovered from traditional Chinese medicine. Eng 5:32-39.
- Cleary JM, Shapiro GI (2010) Development of phosphoinositide-3 kinase pathway inhibitors for advanced cancer. Curr Oncol Rep 12:87-94.
- Shaw PJ, Chaotheing S, Kaewprommal P, Piriyapongsa J, Wongsombat C, et al. (2015) Plasmodium parasites mount an arrest response to dihydroartemisinin, as revealed by whole transcriptome shotgun sequencing (RNA-seq) and microarray study. BMC Genomics 16:830.
- Mbengue A, Bhattacharjee S, Pandharkar T, Liu H, Estiu G, et al. (2015) A molecular mechanism of artemisinin resistance in Plasmodium falciparum malaria. Nature 520:683-687.
- Subramanian A, Tamayo P, Mootha VK, Mukherjee S, Ebert BL, et al. (2005) Gene set enrichment analysis: a knowledge-based approach for interpreting genome-wide expression profiles. Proc Natl Acad Sci USA 102:15545-15550.
- Merico D, Isserlin R, Stueker O, Emili A, Bader GD (2010) Enrichment map: a network-based method for gene-set enrichment visualization and interpretation. PLoS One 5:e13984.
- Kohl M, Wiese S, Warscheid B (2011) Cytoscape: software for visualization and analysis of biological networks. Methods Mol Biol 696:291-303.
- Lakshmanan V, Rhee KY, Wang W, Yu Y, Khafizov K, et al. (2012) Metabolomic analysis of patient plasma yields evidence of plant-like α-linolenic acid metabolism in Plasmodium falciparum. J Infect Dis 206:238-248.
- Batut B, van den Beek M, Doyle MA, Soranzo N (2021) RNA-Seq data analysis in Galaxy. Methods Mol Biol 2284: 367–392.
- Love MI, Huber W, Anders S (2014) Moderated estimation of fold change and dispersion for RNA-seq data with DESeq2. BioRxiv 1-46.
[Crossref]
- Elia U, Flescher E (2008) PI3K/Akt pathway activation attenuates the cytotoxic effect of methyl jasmonate toward sarcoma cells. Neoplasia 10:1303-1313.
- Luo W, Brouwer C (2019) Pathview web: User friendly pathway visualization and data integration. Eur Neuropsychopharmacol 29: S963.
 Spanish
  Chinese
  Russian
  German
  French
  Japanese
  Portuguese
  Hindi
Hindi 