Research Article, J Pharm Drug Deliv Res Vol: 12 Issue: 4
Development and Clinical Validation of an HPLC-PDA Method for Imatinib Mesylate in Human Plasma: Interest in Therapeutic Drug Monitoring
Deema Adawi1,2*, Ichrack Dridi1, Mustafa Lubada2, Ahmad Albarghouthi2, Ahlem Slama1, Hussein Hallak3 and Karim Aouam1
1 Department of Pharmacology, University of Monastir, Monastir, Tunisia
2 Department of Pharmacology, Palestinian Ministry of Health, Ramallah, Palestine
3 Department of Medicine, Al-Quds University, Al-Quds, Palestine
*Corresponding Author: Deema Adawi, Department of Pharmacology
University of Monastir, Palestinian Ministry of Health, Monastir, Tunisia;
E-mail: Deema.hilmi.adawi@gmail.com
Received date: 17 May, 2023, Manuscript No. JPDDR-23-99139;
Editor assigned date: 19 May, 2023, PreQC No. JPDDR-23-99139 (PQ);
Reviewed date: 02 June, 2023, QC No. JPDDR-23-99139;
Revised date: 12 June, 2023, Manuscript No. JPDDR-23-99139 (R);
Published date: 21 June, 2023, DOI: 10.4172/2325-9604.1000227
Citation: Adawi D, Dridi I, Lubada M, Al-barghouthi A, Slama A, et al. (2023) Development and Clinical Validation of an HPLC-PDA Method for Imatinib Mesylate in Human Plasma: Interest in Therapeutic Drug Monitoring. J Pharm Drug Deliv Res 12:4.
Abstract
Imatinib is the first-line treatment for Chronic Myeloid Leukemia (CML), it has favorable pharmacokinetic properties, but resistance mechanisms may lead to diminished clinical response over time. Therapeutic Drug Monitoring targeting trough plasma concentrations may help to optimize the therapeutic effect, or there is a correlation between imatinib concentrations and treatment response.
This study aimed to develop and validate a High-Performance Liquid Chromatographic method for the measurement of plasma concentrations of imatinib.
The analyte was extracted from a 500µl plasma sampler and separated on a RESTEK C18 column (5 µm, 250 x 4.6 mm). Propranolol was used as an internal standard. The analytes were detected with a UV Photodiode Array Detector (PAD) at 270 nm. Linearity, accuracy, precision, recovery, selectivity, and Limit of Detection (LOD) and Limit of Quantification (LOQ) in the sample compartment were evaluated according to the International Conference on Harmonization bio analytical guidelines method guideline M10.
The total run time was 7 min. The method appeared linear over a range from 0.2 to 10 µg/ml. Recovery was 98.2%-105%. The LOD and the LOQ were 200 ng/ml and 500 ng/ml, respectively. Our method appeared very suitable for therapeutic drug monitoring of imatinib.
The developed method was fully validated. It is a simple, rapid, practical, and less expensive method to determine imatinib plasma concentrations in CML patients.
Keywords: Imatinib, HPLC-PAD, Plasma, Analytical validation, Therapeutic drug monitoring, Palestine
Keywords
Imatinib; HPLC-PAD; Plasma; Analytical validation; Therapeutic drug monitoring; Palestine
Abbreviations
CML: Chronic Myeloid Leukemia; PAD: Photodiode Array Detector; LOD: Limit of Detection; LOQ: Limit of Quantification; IM: Imatinib; TDM: Therapeutic Drug Monitoring; ELISA: Enzyme-Linked Immuno-Sorbent Assay; HPLC-UV: High Performance Liquid Chromatography-Ultra Violet; LC-MS: Liquid Chromatography-Mass Spectrometry; LC-TMS: Liquid Chromatography-Tandem Mass Spectrometry; QC: Quality Control; QCL: Quality Control Low; QCM: Quality Control Medium; QCH: Quality Control High
Introduction
Imatinib (IM) is a potent and selective inhibitor for tyrosine kinase and platelet-derived growth factor receptor inhibitor; it is an anticancer drug approved for the treatment of a number of cancers, and it has been successfully used in the treatment protocols of Chronic Myeloid Leukemia (CML) and also for gastrointestinal stromal tumor [1].
Imatinib has an excellent pharmacokinetic with a profile of high oral bioavailability (>98%), rapid absorption from the gastrointestinal system, and a linear dose-response curve [2]. It can be used as a single daily dose since it has a half-life of 20 hours [3]. Generally, IM is well tolerated in patients, but minimal side effects are observed following treatment, such as anemia, thrombocytopenia, and neutropenia [4,5]. Also, IM treatment’s efficacy may decrease due to several factors such as BCR-ABL kinase mutations, lack of patient adherence to treatment and inter-individual variability, which play a central role in the drug metabolism [6]. Imatinib is chiefly metabolized by CYP3A4, CYP3A5, and CYP2C8. The exposure of this drug may be altered by the inhibitors or inductors of cytochrome P450 [7,8]. In addition to its enzymatic variations, IM plasma concentrations may differ by other factors such as gender, age, height, and liver and kidney function. Despite the excellent overall efficacy and safety profile of IM, this drug produces suboptimal responses in some patients which can be explained by the pharmacokinetic variability of IM which raises clinical challenges. It has been advised that trough IM plasma levels may correlate with the clinical response. To ensure optimal treatment response and minimize serious adverse effects, trough IM plasma concentrations (C0) should be maintained between 1000 and 3000 ng/mL. Therapeutic Drug Monitoring (TDM) of IM can be a useful and important tool to assess clinical response against cytogenetic and molecular testing on the one hand and to monitor PK variability and drug interactions on the other [9]. Several methods determine IM serum and plasma levels, such as capillary electrophoresis, Enzyme- Linked Immuno-Sorbent Assay (ELISA), High Performance Liquid Chromatography-Ultra Violet (HPLC-UV), Liquid Chromatography- Mass Spectrometry (LC-MS), Liquid Chromatography-Tandem Mass Spectrometry (LC-TMS) [10-17].
The objective of our study was to develop and validate an HPLCUV/ PAD method for determining IM trough concentration in human plasma that would be simple, sensitive, robust, rapid, and less expensive.
Materials and Methods
Chemicals and reagents
Imatinib mesylate powder was purchased from European pharmacopeia, propranolol (internal standard) was gotten from Birzeit pharmaceutical company (Palestine), and KH2PO4 was purchased from Honeywell/Fluka (Germany). Methanol (HPLC grade) and acetonitrile (HPLC grade) were purchased from Sigma-Aldrich (France). Ultra-pure water was used in all preparations; it was obtained through a Millipore Milli-Q Integral 10 water purification system.
Equipment and chromatographic conditions
The HPLC system consisted of an alliance waters e2695 separation module coupled to a 2998 Photodiode Array Detector (PAD) (Waters USA). The separation was performed by RESTEK C18 column made in the USA (250 x 4.6 mm, particle diameter 5 µm). The mobile phase was a mixture of buffer (pH=3) and acetonitrile (65: 35, v/v). The flow rate was set at 1 ml/min. The column temperature was set at 25°C. Detection of IM was performed at the wavelength (λ) 270nm. The analytical run time was 7 minutes. The injection volume was 50 µl.
Solutions preparation of standard and quality control solutions
The IM and propranolol stock solution were prepared by dissolution in methanol to obtain a 1 mg/ml concentration. An internal standard working solution (100 µg/ml) was freshly prepared by diluting the stock solution with purified water. Quality Control (QC) solutions were prepared from plasma in the same manner, using a different fresh stock solution at final concentrations of 0.5 (Quality Control Low (QCL)), 1 (Quality Control Medium (QCM), and 5 µg/ml (Quality Control High (QCH)).
Sample preparation
Aliquots of 500 µl of plasma were added 50 µl of propranolol solution (100 µg/ml) as internal standard, followed by vortex mixing for 10s. Next, one milliliter of methanol was added, and the tube was vortexed again for 5 min for protein precipitation. The resulting mixture was centrifuged at 10,000 g for 20 min at 4°C. Next, the upper organic layer was transferred into a glass tube and evaporated to dryness under a gentle stream of nitrogen at 47°C. Next, the dried extract was reconstituted in the mobile phase (150 µl) and transferred to an auto-sampler vial. Finally, a 50 µl aliquot was injected into the HPLC system.
Calibration curves
Six increasing concentrations were prepared from the stock solution of IM in neutral plasma (0.2, 0.5, 1, 2, 5, and 10 μg/mL). Then we performed the extraction for this range the organic phase was transferred into a vial, and 50 µl was injected into the system.
Validation of the analytical method
The validation study was designed according to the guidelines of the International Conference on Harmonization bioanalytical method guideline M10 [18]. Thus, accuracy, linearity, precision, recovery, selectivity, and Limit of Detection (LOD) and Limit of Quantification (LOQ) parameters were evaluated.
Specificity: The specificity of an analysis procedure ensures that the measured signal comes only from the analyte. This is to demonstrate that the quantified substance within the matrix is indeed the desired analyte.
Also, there is no interference with other drugs the patient was taking during treatment and its matrix (excipients, degradation products, impurities, etc.). The specificity method’s study is based on comparing the chromatograms of the standard solution of the analyte and the blank sample [18,19].
Linearity
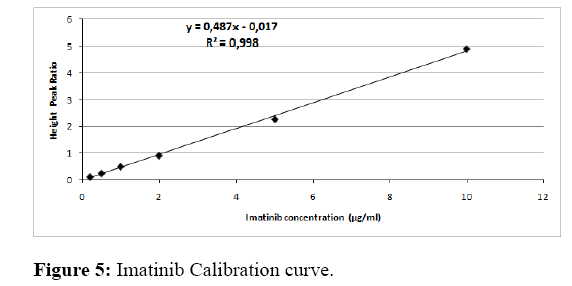
The study of linearity is the ability of an analytical method, within a certain interval, to obtain results proportional to the quantity of analyte to be assayed in the sample. Standard curves were established for 3 successive days. Each series consisted of six concentrations samples (0.2, 0.5, 1, 2; 5 and 10 μg/mL). The relation between height peak ratio (IM/IS), which represents Y-axis and IM concentration, presents the xaxis. It was expressed by using the following linear regression equation: y=ax+b, Where (a) is the slope of the line, (b) is the intercept. Acceptance criteria were as the following: Equation of the line (Y=bX+a), correlation coefficient (r≥0.999), coefficient of determination (R²≥0.980), accuracy for mean nominal concentration should be within 15% or 20% for LLOQ [18].
Accuracy and precision: The accuracy of a method corresponds to the degree of agreement between the results of the measurements obtained by the individual analysis of several samples of the same homogeneous sample taken under prescribed conditions [19].
The recovery test determined accuracy (the difference between actual concentrations and what was founded). Accuracy and precision were evaluated by running five concentrations within the calibration curve level run on the same day (within the run) and in different runs (between runs). Within the run, each concentration was replicated five times. Values were evaluated by analyzing each concentration level during three analytical series over three days. The acceptance criteria for accuracy were mean values within ± 15% of theoretical value; for precision, a maximum CV of 15% was accepted [18].
Stability: To estimate the stability of the processed sample under the conditions of analysis, three concentrations (Quality control samples that were used for patient detection concentration) and the stock solution were evaluated and tested during the study over 12 months.
Limit of Detection (LOD) and Limit of Quantification (LOQ): The Limit of Detection (LOD) and the Limit of Quantitation (LOQ) were determined from the analytical curve and experimentally according to the signal-to-noise ratio as defined by ICH [20].
Method application
The method was applied to measuring IM in plasma samples of 25 chronic myeloid leukemia patients, followed by oncology and hematological department service at Al-Watani governmental hospital (Palestine). It took IM only at a 400 mg/day dose for more than one month. The Ethics guidelines and patients cleared this study signed informed consent. Samples (5 ml) were collected from the patient in Ethylene Diamine Tetra Acetic Acid (EDTA) tubes 24 hours following the last dose intake. Plasma was transferred and kept frozen at -20°C until analysis.
Statistical analysis
All data analysis was expressed as mean ± SEM. All statistical tests were two-tailed and statistical significance was defined as α=0.05.
Results
Development method
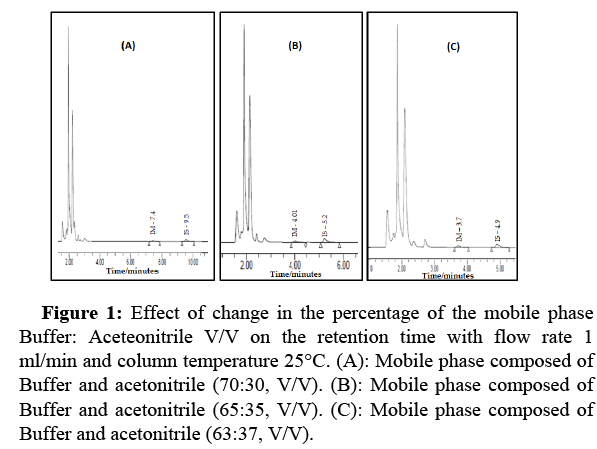
Choice of the composition of the mobile phase: The mobile phase composition was selected after variation in the percentage between KH2PO4 Buffer: Acetonitrile. Three percentages were tested and illustrated in Figure 1. It shows a decrease in organic solvents, leading to a shift in retention time from 3.7 to 9.5 minutes.
Figure 1: Effect of change in the percentage of the mobile phase Buffer: Aceteonitrile V/V on the retention time with flow rate 1 ml/min and column temperature 25°C. (A): Mobile phase composed of Buffer and acetonitrile (70:30, V/V). (B): Mobile phase composed of Buffer and acetonitrile (65:35, V/V). (C): Mobile phase composed of Buffer and acetonitrile (63:37, V/V).
Our choice of mobile phase adjustment depended on the retention time, which had a shorter period with good separation and quantification for IM and IS. The retention time for IM was 4.01 min, and the analysis interval was 10 min.
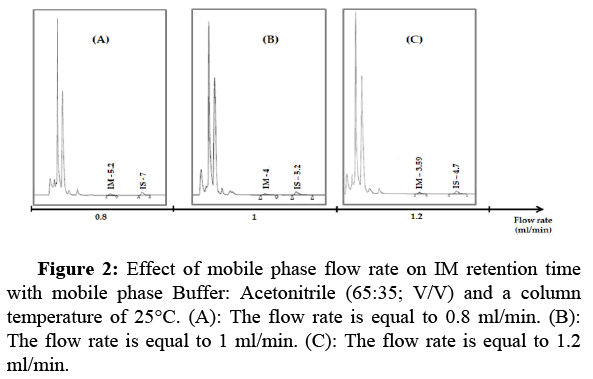
Choice of the flow rate: The drug retention time strongly depends on the flow rate of the mobile phase. The higher the throughput, the shorter the retention time and the shorter the analysis time. Three flow rate ranges were tested (0.8, 1, 1.2 ml/min). Figure 2 shows that increasing the flow rate leads to decreasing retention time. But increases pressure on the HPLC instrument. Based on these chromatograms, we have chosen the flow rate of 1 ml/min, which allows good elution of IM.
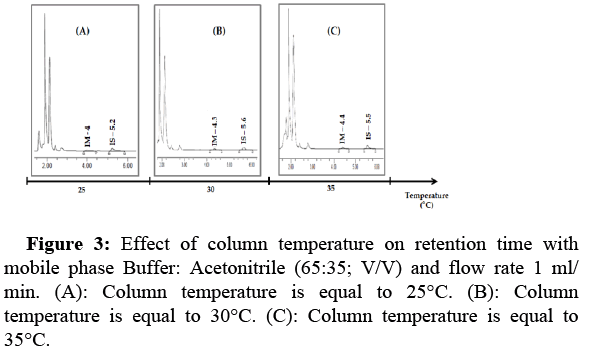
Effect of column temperature on IM retention time: In this study, we tested three temperature ranges (°C) to show the effect of varying the column temperature on the peak and retention time of IM. In general, room column temperature is best suited for chromatographic method development. An increase in column temperature from 25°C to 35°C caused an increase in retention time, with no degradation or peak change. The run time was 7 min (Figure 3).
Choice of detection wavelength: Analysis of the UV absorption spectrum of an aqueous solution of IM and IS showed the presence of the maximum absorption bands in the wavelength range between 260 nm and 280 nm. Therefore, in this study, these wavelengths (260, 270, 271, 179, 280 nm) were assessed, and IM and IS has quantified at a fixed wavelength λ=270 nm.
Study validation
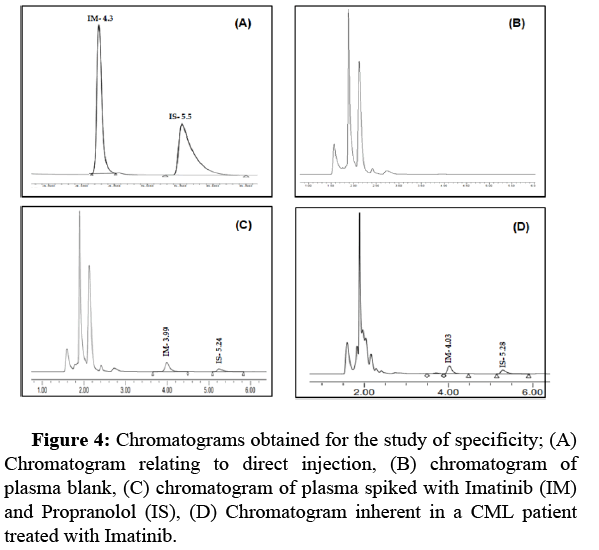
Selectivity and specificity: The specificity of the method was evaluated by observing and comparing four chromatograms: (A) a chromatogram relating to direct injection; (B) plasma blank; (C) plasma spiked with IM (1 µg/ml) and IS (10 µg/ml); (D) plasma for chronic myeloid leukemia patient at C0. In addition, we checked, under optimized conditions, the absence of endogenous compounds in the plasma, which could interfere with the analytes tested (Figure 4).
Linearity: Calibration curves were linear over the concentration range 0.2-10 µg/ml (0.2, 0.5; 1, 2; 5, and 10 μg/mL). The typical equation describing the standard line was: y=0.487x-0.017. Therefore, the correlation coefficient of the regression line corresponding to IM is equal to 0.998, and the method of IM assaying is linear (Figure 5). The result of this study showed that the ordinate at the origin was -0.017; we applied the Student test, which allows us to check if the ordinate at the origin is equivalent to 0. According to the student’s t-test, the value of t calculated was -0.38 was lower than the tabulated t value (read in the Student’s table at 5% risk), equal to 2.110.
Accuracy and precision: The accuracy study was performed according to ICH guidelines. It is expressed by the recovery percentages relative to the amount introduced in the active principle in the samples. The results are expressed in Table 1. The mean recovery was 100.7% ± 3.4, and CV%=1.7%. The mean accuracy for each concentration is less than 15% of the nominal concentration; the precision CV% for the concentration at each level did not exceed 5%.
| Nominal concentration | Mean found concentration | CV% | Mean Recovery | Accuracy% |
|---|---|---|---|---|
| 0.5 | 0.506 | 2.4 | 101.1 | 4.8 |
| 1 | 1.05 | 1.9 | 105 | 1.7 |
| 2 | 1.96 | 1.6 | 98.2 | 1.7 |
| 5 | 4.96 | 1.4 | 99.1 | 2.1 |
| 10 | 10.03 | 1.3 | 100.2 | 2 |
Table 1: Accuracy and precision test.
Limit of Detection (LOD) and Limit of Quantification (LOQ): The LOD detection and LOQ quantification limits were determined based on the Signal to Noise approach (3:1) ratio for LOD and (10:1) ratio for LOQ. The LOD and the LOQ were 200 ng/ml and 500 ng/ml, respectively.
Stability: For estimation of the stability of processed samples under the analysis conditions, we showed that the stock of IM solution was stable for a long time (12 months), no changes occurred in retention time or peak shape, and no degradation occurred during analytic runs. Furthermore, the samples were stable under different conditions with an average nominal concentration of less than 15%.
Application to CML patients: The method was applied to the measurement of IM in plasma samples of 25 CML patients (11 males and 14 females) with a mean age of 49.4 ± 12.8 years and a body weight of 85 ± 19.5 kg. The mean concentration of C0 ± SD was 1.6 µg/ml ± 0.6 with a maximum value of 2.4 µg/ml and a minimum value of 0.8 µg/ml.
Discussion
In the present study, we have optimized and validated a simple method to measure IM plasma concentration useful for the TDM performed in patients treated with this drug. TDM is highly recommended in these patients to optimize the efficacy and safety of IM by adjusting the dose according to the concentration [8].
Several studies focused on dosing adjustment of IM by monitoring blood levels and comparing it with response indicators such as hematological or cytogenetic response [19]. For example, Philippe Rousselot et al. study concluded one hundred thirty-nine CML patients in the chronic phase, IM trough concentration was determined by chromatography tandem mass-mass spectrometry and considered CO=1000 ng/ml as the threshold for dose adjustment if the patients had C0 less than 1000 ng/ml the dose of IM was increasing to get the target goal, on the other hand, the patients whom with C0 more than 1000 ng/ml were observed [21]. Another study by Ryosuke Nakahara et al. was a case report for a CML patient who took IM 400 mg/day. He was 88 years old and was admitted to the hospital with acute renal impairment and initiated dialysis; the authors used TDM to determine the suitable dose for re-administration IM. They decided to decrease the dose to 200 and measured plasma concentration on day 8 from the last change by a high-performance liquid chromatographic; the C0 was 1667 ng/ml. This value was higher than 1000 ng/ml. After that, the physician will continue the same dose for the patient [22]. According to studies demonstrating dose reduction, Cortes J. et al. have shown that 400 mg/day was better in treatment response than 800 in the chronic phase. Also, reduction dose related to a reduction in adverse effects, MMR (Major Molecular Response), and the CCR complete cytogenetic response happened more quickly in patients who received 800 mg/day [23]. Thus the IM concentration monitoring is important to achieve optimal response with less side effects.
Our method is characterized by its rapidity with a short retention time for IM peak (4 min) and an analysis interval of only 10 min. Our result is in line with that of Kaza et al., where the retention and analysis times were 3.7 and 7 min, respectively [1]. Conversely, in the methods developed by Rezende et al. and Roth et al., the retention and analysis times for IM peak were 5.8 and 8.4 min, respectively [19,24]. Although the flow rate adopted in our method was the same as that of others (1 ml/min), we consider the procedure that we have used for IM extraction from plasma as easy since it was performed using only methanol for protein precipitation. Other authors described extraction procedures like serum enrichment, pretreatment with butyl-methyl ether deproteinized with 200 µl of HCLO4, or solid extraction [25-27].
Linearity was tested in most studies that focused on quantifying IM in human serum. The tested concentration ranges were 10-2000 ng/ml, 500-10000 ng/ml, 10-5000 ng/ml, 40-4000 ng/ml, and 80-4000 ng/ml [1,12,14,16,19,24]. The linearity in all these methods was with enough acceptance (r2>0.99). On the other hand, our method depicted a high specificity to IM, as shown by various chromatograms with a linear calibration curve over the concentration range of 200-10000 ng/ml with r2=0.998. This linear range is considered sufficient in the TDM practice of IM and pharmacokinetic studies since the lower limit of trough concentration of the drug are within this range, and the mean maximum plasma concentration range is 1600-3000 ng/ml.
IM stability in our study was observed with no changes in peaks, whatever the analytical conditions. This is consistent with other studies that demonstrated IM stability in blood and plasma for at least 96 hours at room temperature and 12 months when stored at -200C [26,27].
Interestingly, we have applied our method to determine IM trough concentrations (C0) in patients treated with this drug. C0 measured after 24 hours of oral intake of 400 mg/day of IM averaged 1.6 ± 0.6 µg/ml. This result is in accordance with the studies of Bin Peng et al. and Kawaguchi et al. [28,29]. In the Peng et al. study, the authors investigated the correlation between pharmacodynamics and pharmacokinetic correlation after continuous administration of IM and studied IM pharmacokinetic profile in CML; they found the mean C0 of IM at steady state after oral administration 400 mg/day was 1.215 ± 0.750 µg/ml for 5 patients. Kawaguchi et al. studied the correlation between an effective dose of IM, body surface area, and trough concentration in CML patients. The results showed mean C0 at steady state was 1.400 ± 0.57 µg/ml in 13 patients receiving 400 mg/day.
Conclusion
In this study, we add to the scientific literature the description of a simple, rapid, and applicable analytical method for IM concentration measurement in human plasma samples by HPLC-ADA instrument. Furthermore, this method is validated according to ICH criteria recommendations for specificity, linearity, accuracy, precision, LOD, and LOQ. Therefore, this analytical method constitutes a promising option for improving personalized medicine for CML patients. Furthermore, it is used for therapeutic drug monitoring for these patients to prevent toxicity and insufficient response to the drug.
Acknowledgment
The authors would like to thank Palestinian Ministry of Health for providing the lab facilities.
References
- Kaza M, Piorkowska E, Filist M, Rudzki PJ (2016) HPLC-UV assay of imatinib in human plasma optimized for bioequivalence studies. Acta Pol Pharm 73: 1495-1503.
- Peng B, Dutreix C, Mehring G, Hayes MJ, Ben M, et al. (2004) Absolute bioavailability of imatinib (Glivec®) orally versus intravenous infusion. J Clin Pharmacol 44: 158-162.
- Martins DH, Wagner SC, Santos TV, Lizot LLF, Antunes MV et al. (2011) Monitoring imatinib plasma concentrations in chronic myeloid leukemia. Rev Bras Hematol Hemoter 33: 302-306.
- Druker BJ, Brian J, Guilhot F, Brien SG, Gathmann I, Kantarjian H, et al. (2006) Five-year follow-up of patients receiving imatinib for chronic myeloid leukemia. N Engl J Med 355: 2408-2417.
- Tong WG, Kantarjian H, Brien SO, Faderl S, Ravandi F, et al. (2010) Imatinib front‐line therapy is safe and effective in patients with chronic myelogenous leukemia with pre‐existing liver and/or renal dysfunction. Cancer 116: 3152-3159.
- Widmer N, Bardin C, Chatelut E, Paci A, Beijnen J, et al. (2014) Review of therapeutic drug monitoring of anticancer drugs part two-targeted therapies. Eur J Cancer 50: 2020-2036.
- Filppula AM, Laitila J, Neuvonen PJ, Backman JT (2012) Potent mechanism‐based inhibition of CYP3A4 by imatinib explains its liability to interact with CYP3A4 substrates. Br J Pharmacol 165: 2787-2798.
- Miura M (2015) Therapeutic drug monitoring of imatinib, nilotinib, and dasatinib for patients with chronic myeloid leukemia. Biol Pharm Bull 38: 645-654.
- Herviou, P, Thivat E, Richard D, Roche L, Dohou J, et al. (2016) Therapeutic drug monitoring and tyrosine kinase inhibitors. Oncol lett 12: 1223-1232.
- Ajimura TO, Borges KB, Ferreira AF, Castro FA, Gaitani CM, et al. (2011) Capillary electrophoresis method for plasmatic determination of imatinib mesylate in chronic myeloid leukemia patients. Electrophoresis 32: 1885-1892.
- Saita T, Shin M, Fujito H (2013) Development of a specific and sensitive enzyme-linked immunosorbent assay for the quantification of imatinib. Biol Pharm Bull 36: 1964-1968.
- Miura M, Takahashi N, Sawada KI (2011) Quantitative determination of imatinib in human plasma with high-performance liquid chromatography and ultraviolet detection. J chromatogr sci 49: 412-415.
- Pirro E, Francia S, Martino F, Racca S, Carlo F, et al. (2011) A new HPLC-UV validated method for therapeutic drug monitoring of tyrosine kinase inhibitors in leukemic patients. J chromatogr sci 49: 753-757.
- Yang JS, Cho EG, Huh W, Ko JW, Jung JA, et al. (2013) Rapid determination of imatinib in human plasma by liquid chromatography-tandem mass spectrometry: Application to a pharmacokinetic study. Bull Korean Chem Soc 34: 2425-2430.
- Titier K, Stephane P, Dominique D, Emmanuelle T, Nicholas M, et al. (2005) Quantification of imatinib in human plasma by high-performance liquid chromatography-tandem mass spectrometry. Ther Drug Monit 27: 634-640.
- Rezende VM, Rivellis A, Novaes MMY, Chamone DAF, Bendit I, et al. (2013) Quantification of imatinib in human serum: validation of a high-performance liquid chromatography-mass spectrometry method for therapeutic drug monitoring and pharmacokinetic assays. Drug Des Devel Ther 7: 699-710.
- Zhang Y, Qiang S, Yu Z, Zhang W, Xu Z, et al. (2014) LC-MS-MS determination of imatinib and N-desmethyl imatinib in human plasma. J chromatogr sci 52: 344-350.
- Harmonised I (2019) Bioanalytical method validation M10. Europ Med Agen. 1-45.
- Rezende VM, Rivellis AJ, Gomes MM, Dorr FA, Novaes MMY, et al. (2013) Determination of serum levels of imatinib mesylate in patients with chronic myeloid leukemia: Validation and application of a new analytical method to monitor treatment compliance. Rev Bras Hematol Hemoter 35: 103-108.
- Borman P, Elder D (2017) Q2 (R1) validation of analytical procedures. ICH Qual 5: 127-166.
- Rousselot P, Ansah HJ, Huguet F, Legros L, Barbe ME, et al. (2015) Personalized daily doses of imatinib by therapeutic drug monitoring increase the rates of molecular responses in patients with chronic myeloid leukemia. Final results of the randomized OPTIM imatinib study. Blood 126: 133.
- Nakahara R, Sumimoto T, Tanaka R, Ogata M, Itoh H, et al. (2021) Successful determination of imatinib dosage by therapeutic drug monitoring in a case of chronic myeloid leukemia initiating dialysis for acute renal dysfunction. Clin Case Rep 9: e04357.
- Cortes J, Giles F, Brien S, Thomas D, Manero GG, et al. (2003) Result of high-dose imatinib mesylate in patients with Philadelphia chromosome-positive chronic myeloid leukemia after failure of interferon-α. Blood 102: 83-86.
- Roth O, Varoquaux OS, Bouchet S, Rousselot P, Castaigne S, et al. (2010) Imatinib assay by HPLC with photodiode-array UV detection in plasma from patients with chronic myeloid leukemia: Comparison with LC-MS/MS. Clin Chim Acta 411: 140-146.
- Schleyer E, Pursche S, Kohne CH, Schuler U, Renner U, et al. (2004) Liquid chromatographic method for detection and quantitation of STI-571 and its main metabolite N-desmethyl-STI in plasma, urine, cerebrospinal fluid, culture medium and cell preparations. J Chromatogr B 799: 23-36.
- Oostendorp RL, Beijnen JH, Schellens JHM, Tellingen OV (2007) Determination of imatinib mesylate and its main metabolite (CGP74588) in human plasma and murine specimens by ion‐pairing reversed‐phase high‐performance liquid chromatography. Biomed Chromatogr 21: 747-754.
- Widmer N, Beguin A, Rochat B, Buclin T, Kovacsovics T, et al. (2004) Determination of imatinib (Gleevec®) in human plasma by solid-phase extraction-liquid chromatography-ultraviolet absorbance detection. J Chromatogr B 803: 285-292.
- Peng B, Hayes M, Resta D, Poon AR, Druker BJ, et al. (2004) Pharmacokinetics and pharmacodynamics of imatinib in a phase I trial with chronic myeloid leukemia patients. J Clin Oncol 22: 935-942.
- Kawaguchi T, Hamada A, Hirayama C, Nakashima R, Nambu T, et al. (2009) Relationship between an effective dose of imatinib, body surface area, and trough drug levels in patients with chronic myeloid leukemia. International journal of hematology 89: 642-648.
 Spanish
  Chinese
  Russian
  German
  French
  Japanese
  Portuguese
  Hindi
Hindi 