Research Article, Biomater Med Appl Vol: 1 Issue: 1
Evaluation of In Vitro Biofilm Formation on Titanium Nitride Specimens
Anna Arvidsson1,2*, Ingela Mattisson1 and Kristina Blom3
1Dentsply Sirona Implants, Box 14, SE 431 21 Mölndal, Sweden
2University of Gothenburg, Institute of Odontology, Box 450, SE 405 30 Göteborg, Sweden
3Medibiome AB, Kråketorpsgatan 30, SE-431 53 Mölndal, Sweden
*Corresponding Author : Arvidsson A
Dentsply Sirona Implants, Box 14, SE 431 21 Mölndal, Sweden
Tel: 46-31-3763148
E-mail: anna.arvidsson@dentsplysirona.com
Received: August 08, 2017 Accepted: September 11, 2017 Published: September 18, 2017
Citation: Arvidsson A, Mattisson I, Blom K (2017) Evaluation of In Vitro Biofilm Formation on Titanium Nitride Specimens. Biomater Med Appl 1:1.
Abstract
Objective: The purpose is to characterize the surface properties of specimens coated with titanium nitride (TiN) and to investigate the in vitro biofilm formation on TiN coated specimens.
Methods: Ti6Al4V specimens were coated with a <1 μm thick coating of TiN. Surface roughness, surface chemistry, and wettability were measured using 2D stylus profilometry, SEM/EDX, XPS, XRD, and contact angle analysis, respectively. The specimens were preconditioned with artificial saliva and thereafter incubated with a coculture of Streptococcus sanguinis, Actinomyces oris, and Porphyromonas gingivalis. Biofilm formation was evaluated with plate counts, qPCR, Live/dead, and Crystal Violet staining.
Results: Except for surface chemistry no significant differences regarding surface characteristics were found. EDX analysis showed oxygen content of the outermost part of the TiN coating, which was confirmed with XPS. XRD also showed the presence of TiNxOy compounds. Viable counts of the bacterial load on TiN after 24 hours incubation showed a log 2 reduction (p<0.05), but no difference was seen with qPCR.
Conclusion: TiN coatings are covered by a thin layer of TiNxOy. A biological effect could be shown based on bacterial viability. Its potential benefit for a dental application and the elucidation of the underlying mechanism require further investigation.
Keywords: Titanium nitride; Physical vapor deposition; Surface modification; Biofilm formation; Plate counts; qPCR; Live/dead; Crystal violet staining
Introduction
Biomaterial associated infections are challenging to treat due to bacterial biofilm formation [1-4]. Infections around dental implants with bone loss (so called peri-implantitis) may occur both shortly after implantation as well as after several years [5,6]. Some risk factors are patient related, such as a prior history of periodontitis, plaque accumulation/poor oral hygiene, and smoking [7,8]. However, the possible impact of product properties on the risk, progression, and resolution of peri-implantitis has also been investigated and discussed [9-11]. It is hypothesized that anti-biofilm surface modifications may have a counteracting effect in the progress of infection and thereby reducing the risk of infection [2,12-14]. Antibacterial surface modifications can be categorized as non-adhesive, bactericidal, or combined non-adhesive and bactericidal [2,13,15,16].
Titanium nitride (TiN) has been used for several years for coatings of medical devices, such as surgical instruments, hip replacement implants, and dental implant devices. Physical Vapour Deposition (PVD) is one of the most commonly used techniques for deposition of TiN. With PVD, TiN is formed by the reaction of pure titanium and nitrogen gas in a vapour phase before deposition. The coating thickness is typically in the range of one to some microns. TiN is a very hard ceramic material with favourable characteristics such as improved resistance against wear and corrosion [17-19].
TiN coatings are used for customized dental abutments (ATLANTIS abutments, Dentsply Sirona Implants) due to its golden colour, but different in vitro and in vivo studies have shown that TiN coatings reduce bacterial adhesion [20-22]. Using monocultures of Streptococcus sanguinis (S. sanguinis) and Streptococcus mutans (S. mutans), and an incubation time of 1 hour, the amounts of adhering bacteria were measured with fluorescence microscopy [20]. A statistically significant reduction of S. sanguinis, but not S. mutans, was found on TiN compared to Ti [20]. In another study using intraoral splints and 60 hours intraoral exposure, lower bacterial cells counts were found on TiN compared to Ti, by evaluating with SYBR green staining and fluorescence microscopy [21]. Scarano et al. also performed a study with intraoral exposure of Ti and TiN, but for 24 hours [22]. They evaluated the bacterial adherence with Scanning Electron Microscopy (SEM) and reported a lower percentage of implant surface coverage of bacteria on TiN compared to Ti [22].
The mechanisms behind the antibacterial effect of TiN are not well understood, although there are hypotheses that relate to the impact of electron transfer and surface resistivity on bacterial adhesion to Ti- O-N [23,24]. Thus, there is limited knowledge on the possible mode of action of anti-biofilm properties of TiN. Therefore, the purpose of this study is to characterize the surface properties of TiN and to investigate biofilm formation on TiN using different in vitro methods.
Materials and Methods
Surface preparation
Circular discs (Ø: 6.25 mm, thickness: 2 mm) of titanium alloy (Ti6Al4V) were used in the study. The specimens were cleaned, and dried in ambient temperature. Half the amount of specimens served as a control and were not subjected to any further surface treatment. Using Physical Vapor Deposition (PVD), 0.5-1 μm thick coatings of TiN were deposited on the other specimens. After TiN coating, the specimens, as well as the uncoated controls, were packaged in plastic containers, and sterilized with electron beam irradiation.
Surface characterization
Scanning electron microscopy/energy dispersive X-ray analysis (SEM/EDX): Surface morphology and surface chemistry were analyzed with Environmental Scanning Electron Microscopy (XL30 ESEM, Philips, Netherlands) / Energy Dispersive Spectroscopy (Genesis System, EDAX Inc., US) at an acceleration voltage of 30 kV (SEM analysis) or 10 kV (EDX analysis), at a 500x magnification.Three specimens per surface group were analyzed at three different areas (n=9). In addition, EDX was used to analyze a cross section made with ion etching (6 kV).
X-ray photoelectron spectroscopy (XPS): Surface chemistry was also analyzed with X-ray Photoelectron Spectroscopy (XPS, Physical Electronics, US), which is a more surface sensitive technique than EDX. As X-ray source monochromatic AlKα was used. The beam was focused to 100 μm in diameter. Two samples per surface group were analyzed at three different areas (n=6).
X-ray diffraction (XRD) and gracing incident angle X-ray diffraction (GIXRD): X-ray diffraction and gracing incident angle x-ray diffraction was used to identify the presence of crystalline phases and structuring in the metal phase. The samples were analyzed using a Siemens D5000 diffractometer utilizing CuKa radiation (lambda=1.54056 Å) and a fast scan position sensitive detector (PSD). Two samples per surface group were analyzed at three different areas (n=6).
2D Stylus profilometry: The surface roughness was measured with 2D stylus Profilometry (Hommel T1000 wave, Hommelwerke GmbH, Germany). A vertical measuring range of 320 μm and an assessment length of 4.8 mm were used. Three specimens of each type were included in the analysis, and three measurements per specimen were performed (n=9). The surface roughness in terms of arithmetic mean value of vertical deviations of the roughness profile from a mean line (Ra) was calculated after using a filtering process, with cutoff at 0.800 mm.
Contact angle analysis: In order to investigate the wettability, contact angles were measured using a contact angle measuring system (Drop Shape Analysis System DSA 100, Kruss GmbH, Germany). Measurements (n=6 per surface group) were performed with deionized water (1 μl drop, 0.5mm needle diameter).
Evaluation of biofilm formation
Preparation of bacterial inoculums: All bacterial strains used in the present study were ordered from Culture Collection University of Gothenburg (CCUG, Gothenburg, Sweden): Streptococcus sanguinis (S. sanguinis, CCUG 17826), Actinomyces oris (A. oris, CCUG 60842), and Porphyromonas gingivalis (P. gingivalis, CCUG 25893T). Streak plates were made for S. sanguinis and A. oris by culturing for 18-24 hours on horse blood agar plates and for P. gingivalis by culturing 4-5 days on FAA plates. Colonies of S. sanguinis, A. oris, and P. gingivalis were inoculated to 5 ml BHI with supplements: glucose 10 g/l, cysteine hydrochloride 0.5 g/l, yeast extract 5 g/l and inactivated horse serum 10% and grown anaerobically at 37 ± 1°C. The optical density was adjusted to 0.1 at 600 nm, which equals to 1-3×10⁷ CFU/ ml for S. sanguinis, A. oris, and P. gingivalis according to Perismay and Kolenbrander [25]. The species were mixed to obtain the coculture and diluted so that the final bacterial load was 3×10⁵ CFU/ml of each species.
Preconditioning of test specimens: Test specimens were prepared aseptically and preconditioned with artificial saliva [26] for one hour at room temperature to allow pellicle formation [27].
Film contact method: A film contact method [28] was used to evaluate antibacterial activity. Pre-conditioned TiN coated and uncoated Ti6Al4V specimens were put in respective well of a 12 well plate (n=3) and the coculture was inoculated on the specimens. As control to check that bacteria grow as anticipated, the same volume of bacteria in supplemented brain heart infusion (BHI) was pipetted in one well of a 12-well plate. Thin transparent plastic films à 5 mm were punched, and sterilized using 70% ethanol followed by drying in a laminar air flow (LAF) chamber. A 15 μl drop of bacteria in supplemented BHI was applied on each specimen. One thin plastic film per specimen was carefully placed over the inoculums so that the inoculums were evenly spread over the specimen surface, ensuring good contact. Directly after inoculation a “0” sample was taken from the control sample only. After incubation under anaerobic conditions for 24 hours at 36 ± 1°C, the film of each specimen was aseptically removed and washed by pipetting 1 ml phosphate buffer solution (PBS) over the surface into a separate 2 ml Eppendorf tube per specimen. Then the specimens were transferred to the same Eppendorf tubes as used when washing the film. First each specimen surface was washed by pipetting the very same PBS as the film was previously washed with. Next, the specimens were sonicated for 1 minute and vigorously vortexed for 1 minute in the very same tube as previously used when washing the film. Serial dilutions and plate count were performed. Plates were incubated for 24 hours and colony numbers were counted and recorded.
Static assay: The static assay was performed according to the previous publication [29]. A synthetic soft tissue was prepared with 2 mg/ml collagen, 0.05% mucin and 6.8% serum proteins, and cured at 37°C for one hour. 15 μl bacterial suspensions of the coculture of S. sanguinis, A. oris, and P. gingivalis were added to the gel casted wells and incubated for 15 minutes to allow bacterial colonization in the gel. Then the preconditioned test specimens were applied in triplicate on top of the gel. After incubation under anaerobic conditions for 24 hours at 37°C under humid conditions (>75%) three different evaluations were performed.
Analysis of zone of inhibition: Evaluations were done by photography and assessment of zone of inhibition.
Plate counts of bacterial load in synthetic soft tissue and on specimens: The gel exposed to the specimens was punched à 19.6 mm2 and 2.1 mm deep, and enzymatically broken down in a total volume of 1 ml PBS. Then the solution was serial diluted and spread on plates in duplicates. The titanium specimens were removed and transferred to 1 ml PBS. The bacteria were recovered by vortexing and sonication, and then serial diluted and spread on plates in duplicates.
Quantitative Polymerase Chain Reaction (qPCR) analysis of amounts of bacterial DNA: Bacterial samples were recovered from the test specimens and pelleted, and then stored at -20°C until DNA isolation. For DNA extraction, the pelleted cells were resuspended and lysed with lysozyme-containing TE Buffer. Once the cells were lysed the extracted proteins and RNA were discarded before the DNA was extracted by spin column purification steps including binding of the DNA followed by washing of bound DNA and elution of clean DNA to DNAse/RNAse free Eppendorf tubes. Concentration of DNA extracts and quality was determined by using a DropSense 96 spectrophotometer. Primers were selected from literature (Table 1). For qPCR analysis the plate was set with mastermix (TATAA SYBR GrandMaster mix, DNAse/RNAse free water, Primermix, dsDNAse and DTT) and DNA samples. Three different standard curves were included, one for each bacterial species. All samples were run in triplicate and then in the qPCR reaction as duplicate. The qPCR was run with decontaminated mastermix and according to a program shown in Table 2.
| Species | Name | Sequence |
|---|---|---|
| S. sanguinis | SsF | GAT ACA TAG CCG ACC TGA G |
| SsR | CCC ATT GCC GAA GAT TCC | |
| A. oris | AvF | GGC TGC GAT ACC GTG AGG |
| AvR | TCT GCG ATT ACT AGC GAC TCC | |
| P. gingivalis | PgF | TGG GTT TAA AGG GTG CGT AG |
| PgR | CAA TCG GAG TTC CTC GTG AT |
Table 1: Primer sequences specific to 16S rRNA according to Perisamy et al, 2009 [50]. Annealing temperature was 60°C.
| Step 1 | Hold | 95°C, 30s | ||
| Step 2 | Cycling x40 | 95°C, 5s | 62°C, 15s | 72°C, 10s |
| Step 3 | Melt | 95°C, 5s | 60°C, 15s | 95°C, 15s |
Table 2: Program used for the qPCR analysis.
Crystal violet staining: The Crystal violet staining was performed according to Djordjevic et al. [30], with slight modifications. Preconditioned specimens were transferred to a 48 well plate and moved to an anaerobic box at 37°C where 500 μl coculture was inoculated to each well, at a final load of 2.5×10⁵ CFU/well. As sterile control, media without bacteria was used as blank. After incubation for 4 hours, 24 hours, and 96 hours, respectively, the medium from each well was gently removed and discarded and each specimen was gently washed in prefilled wells containing 500 μl sterile water to remove loosely associated bacteria. The specimens were then transferred to a new 48-well plate and allowed to dry in air for 45 minutes before staining with 1% (w/v) crystal violet for 45 minutes. After staining, the crystal violet solution was removed and discarded and the specimens were rinsed thrice with distilled water by dipping in sterile water. The stain was then extracted by adding 95% ethanol for 45 minutes upon and by sonication for 5 minutes in the ultrasound bath Bransonic according to Bjerkan et al. [31]. Extracted stain was transferred à 100 μl in duplicate to a 96-well plate and absorbance measured at OD 595 nm in a microtiterplate spectrophotometer, Epoch.
Baclight live/dead staining: Preconditioned specimens were transferred to a 48 well plate and moved to an anaerobic box at 37°C where 500 μl coculture was inoculated to each well, at a final load of 2.5x10⁵ CFU/well. After incubation for 24 and 96 hours, the medium from each well was gently removed and discarded. Each specimen was then gently washed in prefilled wells containing 500 μl sterile water to remove loosely associated bacteria. The 40 l prepared Filmtracer Live/ Dead solution (1:1 SYTO®9 stain: propidium iodide stain), in sterile distilled water, was added on top of each specimen. After incubation for 20 to 30 minutes in darkness, excess stain was gently rinsed with filter-sterilized water.
Confocal Laser Scanning Microscopy (CLSM) was used for analysis. Z-stack images were obtained from CLSM and combined to obtain 3D images. The average thickness of the biofilm was determined by representative side view images.
Results
Surface characterization
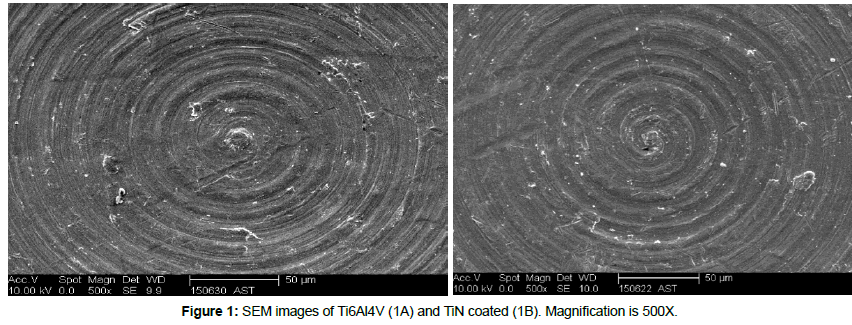
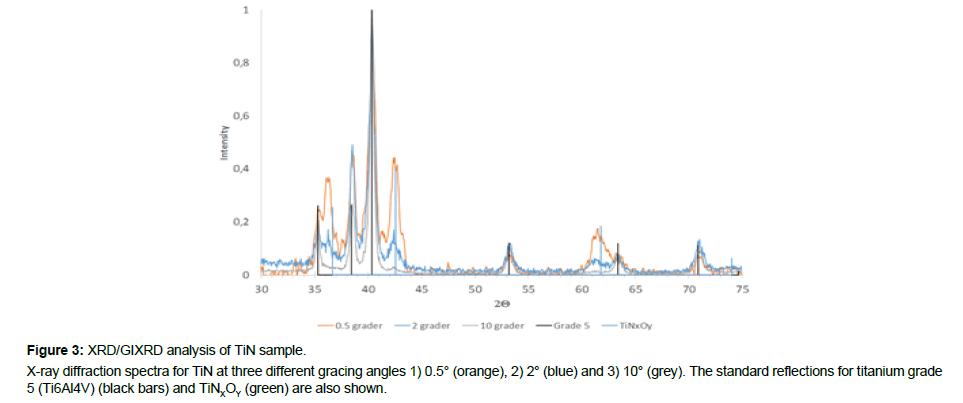
No differences in terms of surface morphology could be detected between Ti6Al4V and TiN (Figure 1), and the EDX analysis showed expected composition of Ti6Al4V and TiN, respectively (Table 3). The EDX analysis of the cross section confirmed Ti and N content of the coating, but also oxygen in the outermost part of the coating (Figure 2). The XPS analysis also showed the presence of oxygen in the outermost part of the TiN coating (Table 3). The XRD analysis confirmed the presence of TiNxOy compounds in the TiN coating (Figure 3).
| Analytical technique | Test specimen | Chemical composition, (at%) | ||||||
|---|---|---|---|---|---|---|---|---|
| Ti | Al | V | N | O | C | Ca | ||
| EDX | Ti6Al4V | 85.6 (0.2) | 11.9 (0.1) | 2.5 (0.1) | - | - | - | - |
| TiN | 70.0 (1.0) | - | - | 30.0 (1.1) | - | - | - | |
| XPS | Ti6Al4V | 14.9 (0.4) | 1.2 (0.4) | - | 1.1 (0.4) | 42.1 (0.3) | 40.1 (0.3) | 0.4 (0.1) |
| TiN | 28.5 (0.7) | - | - | 29.7 (0.5) | 23.4 (0.7) | 18.4 (1.5) | - | |
Table 3: The chemical composition of surface coatings as evaluated with EDX and XPS. The EDX analysis gives a normalized answer i.e. 100% in total. Numbers are means, standard deviations within parenthesis.
The surface roughness (Ra) was 0.20 ± 0.07 μm for Ti6Al4V and 0.24 ± 0.06 μm for TiN, which was not statistically significant different (p>0.05). The contact angle of Ti6Al4V (63 ± 5°) was slightly lower than the contact angle of TiN (70 ± 3°), but not statistically significant (p>0.05) as evaluated with a t-test (SPSS Inc., US).
Evaluation of biofilm formation
Film contact method: Viable counts of the bacterial load on TiN showed a log 2 reduction (p<0.05) in comparison to Ti6Al4V (Table 4).
| Test specimen | Log CFU/ml |
|---|---|
| Control S. sanguinis + A. oris (0h) | 6.0 (0.1) |
| Control P. gingivalis (0h) | 5.5 (0.1) |
| Bacteria recovered from the Ti6Al4V surfaces after 24 h incubation | 5.2 (0.1) |
| Bacteria recovered from the TiN surfaces after 24 h incubation | 3.0 (0.9)* |
*The viable counts for TiN was statistically significant lower compared to Ti6Al4V (p<0.05), as evaluated with a t-test.
Table 4: Viable counts (log CFU/ml) of biofilms formed on Ti6Al4V and TiN surfaces after 24 hours incubation using the Film contact method. Numbers are means, standard deviations within parenthesis.
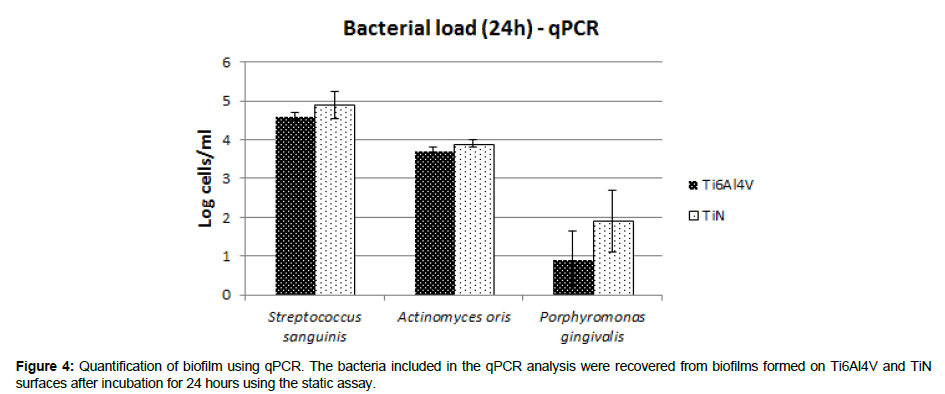
Static assay: No zones of inhibition could be detected for any of the test specimens. Plate counts of the bacterial load on test specimens showed a log 2 reduction (p<0.05) on TiN in comparison to Ti6Al4V (Table 5), but no difference in bacterial load in the synthetic soft tissue. Furthermore, no differences of bacterial load on Ti6Al4V and TiN, respectively, were found when analyzing bacterial DNA amounts with qPCR (Figure 4).
| Test specimen | Bacterial load in the synthetic soft tissue adjacent to the test specimens (Log CFU/ml) | Bacterial load on the test specimens (Log CFU/ml) |
|---|---|---|
| Ti6Al4V | 5.86 (0.18) | 4.23 (0.17) |
| TiN | 5.59 (0.14) | 1.91 (0.55) * |
* The bacterial load on test specimens is statistically significant lower on TiN compared to Ti6Al4V (p<0.05), as evaluated with a t-test.
Table 5: Viable counts (log CFU/ml) of biofilm after 24 incubation with a coculture using the static assay. The plate counts were performed separately for bacteria recovered from the synthetic soft tissue and from bacteria recovered from the surfaces of the test specimens, as presented below. Numbers are means, standard deviations within parenthesis.
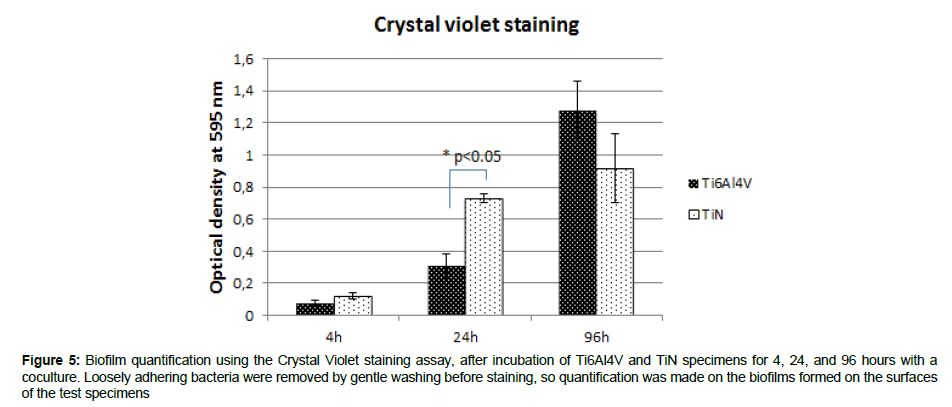
Crystal violet staining: The average biofilm mass increased with time of incubation for Ti6Al4V and TiN (Figure 5). The biofilm mass after 24 hours incubation was larger (p<0.05) on TiN than on Ti6Al4V (Figure 5).
Figure 5: Biofilm quantification using the Crystal Violet staining assay, after incubation of Ti6Al4V and TiN specimens for 4, 24, and 96 hours with a coculture. Loosely adhering bacteria were removed by gentle washing before staining, so quantification was made on the biofilms formed on the surfaces of the test specimens
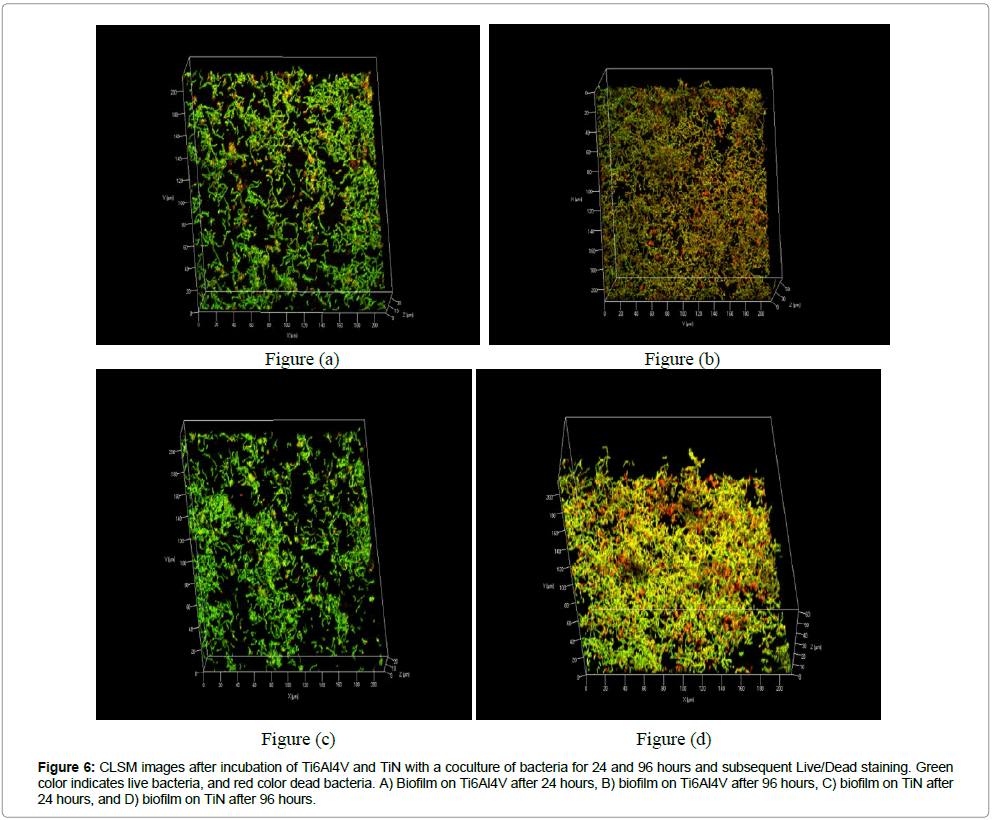
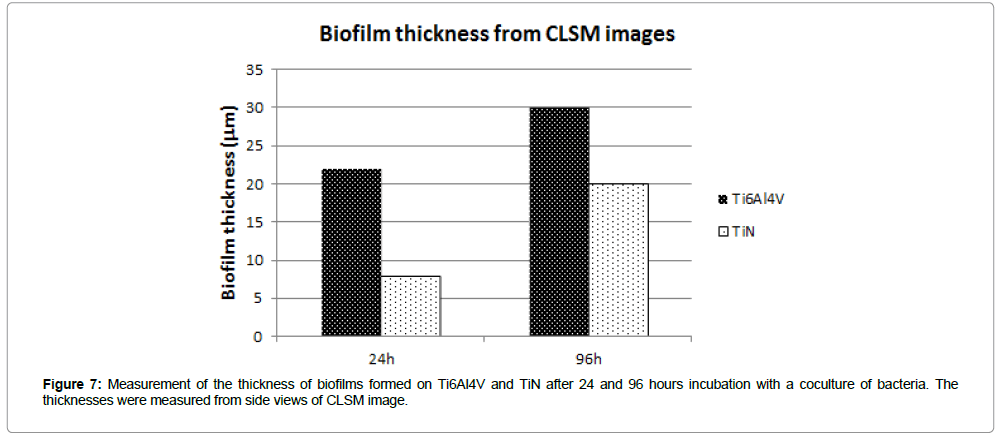
Baclight live/dead staining: The CLSM images indicated mainly live bacteria after 24 hours, but more dead bacteria after 96 hours (Figure 6). The average thickness was lower on TiN compared to Ti6Al4V (Figure 7).
Figure 6: CLSM images after incubation of Ti6Al4V and TiN with a coculture of bacteria for 24 and 96 hours and subsequent Live/Dead staining. Green color indicates live bacteria, and red color dead bacteria. A) Biofilm on Ti6Al4V after 24 hours, B) biofilm on Ti6Al4V after 96 hours, C) biofilm on TiN after 24 hours, and D) biofilm on TiN after 96 hours.
Discussion
Plate counts in the present study indicated an anti-biofilm activity of TiN compared to Ti6Al4V, but no difference was found with qPCR and Crystal violet staining. The surface modifications were characterized in terms of surface chemistry, surface morphology, surface roughness, and wettability, and except for surface chemistry no significant differences regarding surface characteristics were found.
The surface structure and composition of biomaterials are of high importance for its clinical outcome, and are always different from its bulk composition and structure. Thus, surface-sensitive techniques are needed for proper surface characterization. In the present study XPS analysis was used to determine what kind of elemental compositions that can be found on the surfaces of the two different sample groups, TiN and Ti6Al4V respectively. These results are compared with EDX analysis of corresponding samples in order to compare the surface composition with the bulk. The surface compositions obtained from the both elemental analyses are summarized in Table 3.
According to the traditional XPS analysis carbon, nitrogen, oxygen, and titanium were observed on both samples. In addition, aluminum was observed on the Ti6Al4V sample while the energy from the vanadium signal is so close to the titanium signal so it is hidden in the broad titanium peak. From a more detailed analysis of the XPS data, using the CASA XPS software, it can be concluded that the surface of the nitride samples are constituted of TiN which, due to the exposure to air at room temperature after the PVD treatment, seems to be covered by a thin oxidized over layer. Both titanium and oxygen show signals which indicate that this over layer consist mainly of an oxynitride.
There are differences between surface and bulk composition, which are easy to separate using XPS and EDX together. The main difference from the XPS analysis is the absence of carbon, and oxygen in the bulk, which is expected since carbon is a surface contamination and the bulk is not oxidized. Further, both vanadium and aluminum signals from the titanium Grade 5 (Ti6Al4V) is detected by EDX.
According to the values in Table 3 the Ti/N ratio for the TiN samples as determined from XPS surface is just below 1 indicating that the surface is primarily TiN. For the EDX analysis this ratio increases, which means that the amount of nitrogen decreases in relation to titanium within the bulk material. This is expected since TiN appears as a thin layer on Ti. These results are also verified by the cross section analysis presented in Figure 2, where titanium and nitrogen are observed close to the surface of the sample which represents the TiN coating. On top of the nitrogen signal, oxygen is present which shows that the surface is oxidized in agreement with the XPS results.
As a complement to the elemental analysis X-ray diffraction (XRD) was used for identification of crystalline phases and structuring of the TiN surfaces. From the TiN reference spectra, Figure 3, all titanium peaks are present as can be seen when compared to the standard reflections for Ti6Al4V shown by the black bars. It can also be observed from this diffractogram that there is no structuring of the metal signal for any of the incident angles indicating that neither bulk nor surface of this sample is structured. Further, it can be observed that the surface of the TiN sample is covered by a thin TiNxOy layer, which is expected for an oxidized TiN surface coating and was also verified by the cross section and XPS analysis.
The machining tracks were visible on both uncoated Ti6Al4V and TiN coated surfaces, and no major morphological differences could be observed (Figure 1). This was in accordance with the surface roughness analysis, which could not find any significant differences between surface groups. However, it should be emphasized that 2D Stylus Profilometry with the current filter size used, reflects the surface roughness at the micrometer level. It is possible that there are surface roughness differences at the nanometer level, which need to be studied with other analytical techniques, such as Atomic Force Microscopy (AFM). The Ra parameter describes the 2D amplitude variation, but for a complete characterization of surface roughness, other types of surface roughness parameters (e.g. spatial and hybrid parameters) should also be evaluated. Surfaces can have a similar Ra value, although the surface morphology is completely different [32]. In general, bacterial adhesion/retention is reduced as surface roughness is decreased, but when Ra<0.2 μm Bollen et al. found that the roughness has no further effect on plaque accumulation [33]. In a review by Subramani et al. it was concluded that increased surface roughness facilitates biofilm formation on dental implant and abutment surfaces [34]. In the present study, both groups had a surface roughness close to that threshold.
Both Ti6Al4V and TiN showed hydrophilic properties with contact angles <90°, although the uncoated Ti6Al4V was found to be slightly more hydrophilic than TiN. Hydrophilicity is one of the physicochemical properties of a material that affect microbial adhesion [12,35,36]. It has been suggested that hydrophilic coatings can prevent bacterial adhesion due to the hydrophobic nature of bacterial surfaces [12]. Hydrophilic surfaces have also been described to improve the early stages of soft tissue adhesion, as well as osseointegration [37-39].
In the present study the specimens were pre-conditioned with artificial saliva to simulate the salivary pellicle that rapidly is formed on all surfaces introduced in the oral cavity [40]. Artificial saliva, and not whole human saliva, was selected since it is reproducible, simple to prepare, and has a good shelf life. The recipe of the artificial saliva has the same protein content (mucins) as what has been measured for whole saliva, and supports growth of the oral pathogens [26]. In the oral cavity there are more than 700 different bacterial species [41], but three species were selected as a coculture. Gram-positive Streptococci was used since it is a primary colonizer and the most prevalent microorganism present in the gingival crevicular fluid during various stages of implant treatment [42-44]. A. oris is a Grampositive facultatively anaerobic bacterium, and was selected as a representative of an early colonizer of oral surfaces that interacts with other initial colonizers and gram-negative anaerobes and thereby promotes biofilm development [45-47]. P. gingivalis is a Gramnegative anaerobe, and was selected as one of the pathogenic bacteria involved in peri-implant mucositis and as one that can form mutualistic biofilm with e.g. A. oris [44,48]. The bacterial concentration can influence the biofilm formation, but in the present study an inoculum size of 1-3×10⁵ CFU/ml of each species was used since it reflects concentrations present sub-mucosally around dental implants [44]. Follow-up times were selected to reflect the different stages of biofilm formation. Initial adhesion is reflected by the 4 hour time-point, and after 4-7 days a mature biofilm has been formed.
The biofilm formation was evaluated with different methods in order to allow investigation from different perspectives. The Film contact method is modified from the standard JIS Z:2801:2000 “Antimicrobial products – test for antimicrobial activity and efficacy”, and is described in a publication by Yasuyuki et al. [28]. The static assay is a qualitative and quantitative biofilm method with in vivo like 3D soft tissue combining visual rapid screening and quantitative evaluation of the antimicrobial activity in both synthetic tissue and on devices [29]. No zone of inhibition could be observed around the specimens, which indicates that there is no release of antimicrobial compounds from the TiN surface, or that the release is below the minimal inhibitory concentration. The bacterial load was quantified with two different methods, with diverging results. This might be explained by the fact that plate counts only quantifies metabolically active bacteria, while qPCR analyses the total amount of bacterial DNA from both live and dead bacteria. In the present study plate counts from both the Film contact method and the static assay showed a log 2 reduction (Tables 4 and 5), but qPCR did not indicate any difference (Figure 4). The results are in accordance with a previous publication by Grossner-Schreiber et al. that found indications of a lower metabolic activity on nitride coatings than on Ti surfaces, as measured by RNA fingerprints [21].
Crystal violet staining is a method used for biofilm biomass quantification, and consists in staining negatively charged molecules by the basic dye crystal violet [49]. Crystal violet binds indifferently to negatively charged bacteria and polysaccharides of the extracellular polymeric substances. After staining the adsorbed crystal violet is eluted using a solvent. The amount of dye solubilized by the solvent is measured by optical absorbance at 590 nm, and is directly proportional to biofilm size [49]. Results indicated that the biomass increased with increasing time of incubation for both groups (Figure 5). However, more experiments would be needed to determine any differences between TiN and Ti6Al4V.
The Live/Dead Baclight assay is another established and commonly used method for analysis of microbial biofilm colonization [49]. It distinguishes between live and dead bacteria, and may give valuable information on mode of action. The method does not allow a total count of bacterial cells, but the method provides semi-quantitative data [50]. The biofilm was indicated to be thinner on TiN coated specimens compared to uncoated controls (Figure 7), but more analyses would be needed in order to allow a statistical calculation and a definite conclusion.
In previous publications showing reduced biofilm formation on TiN, incubation times used were not as long as the longest incubation time used in the present study. Monocultures as well as intraoral exposures were previously used, in difference to a culture used in the present study. However, despite the different model settings, the overall result presents a certain degree of anti-biofilm properties of TiN, which is in accordance with previous publications on TiN. However, to better understand the mode of action further in vitro and in vivo studies are needed, addressing e.g. the mechanical stability of the biofilm or the impact on long term biofilm formation. Additionally, an enhanced understanding of the chemical processes occurring at the TiN/biofilm interface would facilitate the further development of anti-biofilm surface modifications.
Conclusion
From the surface characterization, it can be concluded that TiN is covered by a thin TiNxOy layer, which was verified by different surface sensitive techniques. No differences concerning surface morphology, surface roughness, or wettability could be observed between uncoated and TiN coated specimens The plate counts showed a significant reduction of metabolic active bacteria in biofilms formed on TiN than Ti6Al4V, and Live/Dead indicated a thinner biofilm on TiN than Ti6Al4V. However, qPCR and Crystal Violet staining performed in the current study did not indicate any anti-biofilm activity of TiN.
Acknowledgements
The authors thank Dentsply IH AB for financial support, and the Wilhelm and Martina Lundgren Science Foundation and the Royal Society of Arts and Sciences in Göteborg for supporting the study with grants.
We acknowledge the Centre for Cellular Imaging at the University of Gothenburg and the National Microscopy Infrastructure, NMI (VR-RFI 2016- 00968) for providing assistance in microscopy.
References
- Costerton JW, Montanaro L, Arciola CR (2005) Biofilm in implant infections: its production and regulation. Int J Artif Organs 28: 1062-1068.
- Busscher HJ, van der Mei HC, Subbiahdoss G, Jutte PC, van den Dungen JJ, et al. (2012) Biomaterial-associated infection: locating the finish line in the race for the surface. Sci Transl Med 4: 153-163.
- Lynch AS, Robertson GT (2008) Bacterial and fungal biofilm infections. Annu Rev Med 59: 415-428.
- Norowski PA Jr, Bumgardner JD (2009) Biomaterial and antibiotic strategies for peri-implantitis: a review. J Biomed Mater Res B Appl Biomater 88: 530-543.
- Zitzmann NU, Berglundh T (2008) Definition and prevalence of peri-implant diseases. J Clin Periodontol 35: 286-291.
- Koldsland OC, Scheie AA, Aass AM (2010) Prevalence of peri-implantitis related to severity of the disease with different degrees of bone loss. J Periodontol 81: 231-238.
- Renvert S, Quirynen M (2015) Risk indicators for peri-implantitis. A narrative review. Clin Oral Implants Res 26: 15-44.
- Heitz-Mayfield LJ (2008) Peri-implant diseases: diagnosis and risk indicators. J Clin Periodontol 35: 292-304.
- Albouy JP, Abrahamsson I, Berglundh T (2012) Spontaneous progression of experimental peri-implantitis at implants with different surface characteristics: an experimental study in dogs. J Clin Periodontol 39: 182-187.
- Renvert S, Polyzois I, Claffey N (2011) How do implant surface characteristics influence peri-implant disease? J Clin Periodontol 38: 214-222.
- Peixoto CD, Almas K (2016) The implant surface characteristics and peri-implantitis. An evidence-based update. Odontostomatol Trop 39: 23-35.
- Francolini I, Donelli G (2010) Prevention and control of biofilm-based medical-device-related infections. FEMS Immunol Med Microbiol 59: 227-238.
- Hasan J, Crawford RJ, Ivanova EP (2013) Antibacterial surfaces: the quest for a new generation of biomaterials. Trends Biotechnol 31: 295-304.
- Hetrick EM, Schoenfisch MH (2006) Reducing implant-related infections: active release strategies. Chem Soc Rev 35: 780-789.
- Banerjee I, Pangule RC, Kane RS (2011) Antifouling coatings: recent developments in the design of surfaces that prevent fouling by proteins, bacteria, and marine organisms. Adv Mater 23: 690-718.
- Fu J, Ji J, Yuan W, Shen J (2005) Construction of anti-adhesive and antibacterial multilayer films via layer-by-layer assembly of heparin and chitosan. Biomaterials 26: 6684-6692.
- Braun M (2013) Magnetron Sputtering Technique, in Handbook of Manufacturing Engineering. Springer-Verlag: London.
- Endo K, Sachdeva R, Araki Y, Ohno H (1994) Effects of titanium nitride coatings on surface and corrosion characteristics of Ni-Ti alloy. Dent Mater J 13: 228-239
- Alsabeeha NH, Swain MV, Payne AG (2011) Clinical performance and material properties of single-implant overdenture attachment systems. Int J Prosthodont 24: 247-254.
- Grossner-Schreiber B, Griepentrog M, Haustein I, Muller WD, Lange KP, et al. (2001) Plaque formation on surface modified dental implants. An in vitro study. Clin Oral Implants Res 12: 543-551.
- Groessner-Schreiber B, Hannig M, Duck A, Griepwntrog M, Wenderoth DF, et al. (2004) Do different implant surfaces exposed in the oral cavity of humans show different biofilm compositions and activities? Eur J Oral Sci 112: 516-522.
- Scarano A, Piattelli M, Vrespa G, Caputi S, Piattelli A, et al (2003) Bacterial adhesion on titanium nitride-coated and uncoated implants: an in vivo human study. J Oral Implantol 29: 80-85.
- Koerner RJ, Butterworth LA, Mayer IV, Dasbach R, Busscher HJ, et al. (2002) Bacterial adhesion to titanium-oxy-nitride (TiNOX) coatings with different resistivities: a novel approach for the development of biomaterials. Biomaterials 23: 2835-2840.
- Poortinga AT, Bos R, Busscher HJ (2001) Charge transfer during staphylococcal adhesion to TiNOX coatings with different specific resistivity. Biophys Chem 91: 273-279.
- Periasamy S, Kolenbrander PE (2009) Mutualistic biofilm communities develop with Porphyromonas gingivalis and initial, early, and late colonizers of enamel. J Bacteriol 191: 6804-6811.
- Roger P, Delettre J, Bouix M, Beal C (2011) Characterization of Streptococcus salivarius growth and maintenance in artificial saliva. J Appl Microbiol 111: 631-641.
- Aykent F, Yondem I, Ozyesil AG, Gunal SK, Avunduk MC, et al. (2010) Effect of different finishing techniques for restorative materials on surface roughness and bacterial adhesion. J Prosthet Dent 103: 221-227.
- Yasuyuki M, Kunihiro K, Kurissery S, Kanavillil N, Sato Y, et al. (2010) Antibacterial properties of nine pure metals: a laboratory study using Staphylococcus aureus and Escherichia coli. Biofouling 26: 851-858.
- Hakonen B, Lonnberg LK, Larko E, Blom K (2014) A Novel Qualitative and Quantitative Biofilm Assay Based on 3D Soft Tissue. Int J Biomater 768136.
- Djordjevic D, Wiedmann M, McLandsborough LA (2002) Microtiter plate assay for assessment of Listeria monocytogenes biofilm formation. Appl Environ Microbiol 68: 2950-2958.
- Bjerkan G, Witso E, Bergh K (2009) Sonication is superior to scraping for retrieval of bacteria in biofilm on titanium and steel surfaces in vitro. Acta Orthop 80: 245-250.
- Thomas TR (1999) Rough Surfaces. Second ed., London: Imperial College Press.
- Quirynen M, Bollen CM, Papaioannou W, Van Eldere J, van Steenberghe D, et al. (1996) The influence of titanium abutment surface roughness on plaque accumulation and gingivitis: short-term observations. Int J Oral Maxillofac Implants 11: 169-178.
- Subramani K, Jung RE, Molenberg A, Hammerle CH (2009) Biofilm on dental implants: a review of the literature. Int J Oral Maxillofac Implants 24: 616-626.
- Song F, Koo H, Ren D (2015) Effects of Material Properties on Bacterial Adhesion and Biofilm Formation. J Dent Res 94: 1027-1034.
- Almaquer-Flores A, Olivares-Navarrete R, Wieland M, Ximénez-Fyvie LA, Schwartz Z, et al. (2012) Influence of topography and hydrophilicity on initial oral biofilm formation on microstructured titanium surfaces in vitro. Clin Oral Implants Res 23: 301-307.
- Schwarz F, Wieland M, Schwartz Z, Zhao G, Rupp F, et al. (2009) Potential of chemically modified hydrophilic surface characteristics to support tissue integration of titanium dental implants. J Biomed Mater Res B Appl Biomater, 88: 544-557.
- Baier RE, Mayer AE, Natiella JR, Natiella RR, Carter JM, et al. (1984) Surface properties determine bioadhesive outcomes: methods and results. J Biomed Mater Res 18: 337-355.
- Gittens RA, Scheideler L, Rupp F, Hyzy SL, Geis-Gerstorfer J, et al. (2014) A review on the wettability of dental implant surfaces II: Biological and clinical aspects. Acta Biomater 10: 2907-2918.
- Baier RE, Glantz PO (1978) Characterization of oral in vivo films formed on different types of solid surfaces. Acta Odontol Scand 36: 289-301.
- Parahitiyawa NB, Scully C, Leung WK, Yam WC, Jin LJ, et al. (2010) Exploring the oral bacterial flora: current status and future directions. Oral Dis 16: 136-145.
- Nakazato G, Tsuchiya H, Sato M, Yamauchi M (1989) In vivo plaque formation on implant materials. Int J Oral Maxillofac Implants 4: 321-326.
- Socransky SS, Haffajee AD, Cugini MA, Smith C, Kent RL Jr, et al. (1998) Microbial complexes in subgingival plaque. J Clin Periodontol 25: 134-144.
- Herekar M, Sethi M, Prithviraj DR, Bhat K, Fernandes A, et al. (2015) A Clinical Study Evaluating Changes in the Microbial Flora Around Dental Implants During Various Stages of Implant Restoration. Implant Dent 24: 527-532.
- Mishra A, Wu C, Yang J, Cisar JO, Das A, et al. (2010) The Actinomyces oris type 2 fimbrial shaft FimA mediates co-aggregation with oral streptococci, adherence to red blood cells and biofilm development. Mol Microbiol 77: 841-854.
- Caous JS, Lovenklev M, Faldt J, Langton M (2013) Adhesion of Streptococcus mitis and Actinomyces oris in co-culture to machined and anodized titanium surfaces as affected by atmosphere and pH. BMC Oral Health 13: 4.
- Thurnheer T, Belibasakis GN, Bostanci N (2014) Colonisation of gingival epithelia by subgingival biofilms in vitro: role of "red complex" bacteria. Arch Oral Biol 59: 977-986.
- Albertini M, Lopez-Cerero L, O'Sullivan MG, Chereguini CF, Ballesta S, et al. (2015) Assessment of periodontal and opportunistic flora in patients with peri-implantitis. Clin Oral Implants Res 26: 937-941.
- Pantanella F, Valenti P, Natalizi T, Passeri D, Berlutti F, et al. (2013) Analytical techniques to study microbial biofilm on abiotic surfaces: pros and cons of the main techniques currently in use. Ann Ig 25: 31-42.
- Periasamy S, Chalmers NI, Du-Thumm L, Kolenbrander PE (2009) Fusobacterium nucleatum ATCC 10953 requires Actinomyces naeslundii ATCC 43146 for growth on saliva in a three-species community that includes Streptococcus oralis 34. Appl Environ Microbiol 75: 3250-3257
 Spanish
  Chinese
  Russian
  German
  French
  Japanese
  Portuguese
  Hindi
Hindi 