Research Article, Vol: 14 Issue: 1
Forecasting Social Cost of Carbon with Predictive Machine Learning Models for CO2 and GHG Emissions
Pratyayan Sarkar1*, Arindam Chowdhury2
1Department of Civil Engineering, Jadavpur University, Kolkata, India
2Department of Biotechnology, Vellore Institute of Technology, Vellore, India
*Corresponding Author: Pratyayan Sarkar, Department of Civil Engineering, Jadavpur University, Kolkata, India, E-mail: pratyayan.pgp22@iimshillong.ac.in
Received date: 10 April, 2024, Manuscript No. EOEB-24-131944; Editor assigned date: 12 April, 2024, PreQC No. EOEB-24-131944 (PQ); Reviewed date: 26 April, 2024, QC No. EOEB-24-131944; Revised date: 04 March, 2025, Manuscript No. EOEB-24-131944 (R); Published date: 11 March, 2025, DOI: 10.4172/2325-9655.1000236
Citation: Sarkar P, Chowdhury A (2025) Forecasting Social Cost of Carbon with Predictive Machine Learning Models for COâ?? and GHG Emissions. Expert
Opin Environ Bio 14:1.
Abstract
Purpose: The purpose of this study is to ascertain the connection between oil and gas businesses' carbon emissions and the upkeep of their carbon emission monitoring systems. To forecast the carbon emissions in India, China, and all of Asia, we also want to build a machine-learning model utilizing data on carbon emissions from 1850 to 2021. This study analyses data from “Our World In Data” over a 170-year span to develop a model that forecasts future carbon emissions in Asia, particularly in India and China.
Design/methodology/approach: After extensive research, we collected data on carbon emissions, monitoring, and statistics from various sources, covering the period from 1850 to 2021. Utilizing SKLearn and Scikit-Learn libraries, we pre-processed the dataset, replaced NaN values, and split it into test and training sets (80% and 20%). Employing linear regression and decision tree regressor algorithms, we forecasted future CO2 and GHG emissions in China, India, and Asia. The decision tree model outperformed linear regression in predicting emissions accurately. Additional data visualization aided in understanding actual versus predicted emissions.
Findings: 95% is the selected level of confidence. The logistic regression model indicates that p is bigger than alpha. Considering this, we adopt the null hypothesis. The difference between actual and expected data is not very significant, according to the chi-square (2) value of 0.3241, which assesses the disagreement between observed and predicted frequencies of outcomes of a set of events or variables. We concluded that the outcomes produced by the decision tree regressor algorithm were superior and less error-prone than those obtained by linear regression.
Originality/value: Machine learning model for forecasting CO2 and GHG emissions. Hypothesis formulation and using logistic regression to accept the null hypothesis: Companies monitoring carbon emissions emit less carbon.
Keywords: Social cost of carbon; Decision tree regression; Predictive modeling; Machine learning; Integrated assessment models; Logistics regression
Keywords
Social cost of carbon; Decision tree regression; Predictive modeling; Machine learning; Integrated assessment models; Logistics regression
Introduction
The social cost of carbon
The "social cost of carbon" refers to the predicted economic losses associated with each additional tonne of Carbon Dioxide (CO2) emissions. This indicator is commonly used by governments and organizations to inform policy decisions and balance the benefits and drawbacks of reducing greenhouse gas emissions. Since companies routinely make investment decisions that take the financial implications of climate change into account, corporate finance professionals are especially important in this subject. We will investigate the social cost of carbon and its effects on corporate finance in this research [1].
One type of scenario maximizes the sum of discounted benefits minus costs; another type satisfies a specific physical policy objective, such as keeping global warming below 2C; and a third type is a baseline, with no further climate policies.
Information about the integrated assessment model "In general, integrated assessment techniques are used to determine the cost." These models show how an additional tonne of emissions changes atmospheric concentrations, which then alters global average surface temperatures and precipitation. The consequences of agriculture and sea level on biophysical processes then negatively affect our economy and quality of life.
To determine the cost, "integrated assessment models" are typically employed. These models are first used by researchers to recreate the track of climate change without altering policies. In order to note how much harm and climate change result from an additional tonne of emissions, they then tweak the model. The variation in damage is explained by the social cost of carbon.
We will examine the impact of the social cost of carbon on the global economy in more detail and look into the potential contribution of corporate finance professionals to lowering the social cost of carbon through ethical investing techniques.
SCC in oil and gas industry
The "Social Cost of Carbon" (SCC) refers to the financial costs associated with Greenhouse Gas (GHG) emissions, particularly Carbon Dioxide (CO2), as a result of the adverse effects of climate change on society. It is a forecast of the possible economic damage caused by an additional tonne of CO2 emissions every year. An important source of global GHG emissions is the oil and gas sector, which is directly impacted by the concept of SCC. A mechanism for assessing the overall economic costs of GHG emissions, including their effects on future generations, is provided by the SCC. As a result, while making decisions about corporate finance, businesses in the oil and gas sector must take it into account.
The concept of SCC has received more attention in recent years as people's concern over the effects of climate change has increased. In the coming decades, it is predicted that the cost of GHG emissions will surpass several trillion dollars globally, with the most vulnerable communities suffering a disproportionately large percentage of the price. A more accurate representation of the true costs of GHG emissions is made possible by the SCC, which provides a method for incorporating these prices into people's and companies' decisionmaking processes.
Due to the considerable GHG emissions generated during the extraction, transportation, and use of fossil fuels, the SCC is essential to the oil and gas industry [2]. With more than 70% of all global CO2 emissions coming from this industry, it significantly contributes to climate change. As governments and consumers put more pressure on companies to address climate change, the SCC plays a bigger role in corporate finance decisions for oil and gas companies.
The SCC serves as a foundation for calculating the cost of carbon emissions and guides policy decisions through mechanisms like carbon taxes or emissions trading schemes. Businesses must purchase GHG emission allowances under these systems, and the SCC sets the price of these allowances. Because reducing emissions will boost their bottom line, businesses have an economic incentive to do so. As a result, the SCC has a greater influence over the financing and investment decisions made by businesses in the oil and gas industry.
The value of oil and gas reserves is also impacted by the SCC. There is growing concern that as the world moves towards a lowcarbon future, some of the fossil fuel reserves may become "stranded assets," meaning that they cannot be economically exploited and sold. The SCC provides a methodology for assessing the oil and gas sector's potential financial impact from such "stranded assets," empowering companies to make informed decisions about current operations and future investments.
However, there is a great deal of disagreement and ambiguity surrounding the SCC calculation. Since diverse approaches and assumptions may lead to estimates of the SCC that are significantly different, it can be difficult for oil and gas businesses to accurately estimate the costs of GHG emissions. Policymakers may run into issues when trying to implement laws and regulations based on the SCC because of this ambiguity.
Despite these challenges, the SCC idea is increasingly important for the oil and gas industry, and companies who fail to take the SCC into account when making corporate finance decisions run the risk of missing out on major opportunities and potential risks. Businesses that are proactive in managing their GHG emissions and include the SCC into their business planning are better able to adapt to the challenges posed by climate change and are more likely to prosper in the long run.
The social cost of carbon is a key concept for the oil and gas sector because it provides a foundation for calculating the actual financial costs of GHG emissions and their consequences on society. It applies to decisions made in corporate finance, including those related to financing and investing.
Materials and Methods
The economic harms brought on by each unit of Carbon Dioxide (CO2) emissions are calculated as the "Social Cost of Carbon" (SCC). The SCC takes into account things like how climate change may affect agriculture, human health, and property damage. Models that connect emissions to atmospheric concentration, temperature change, and ultimately damage are used to determine the SCC. The price of lowering one unit of emissions, which rises over time with population and economic development, is the marginal social cost of carbon. In estimating societal costs, the discount rate a variable used to determine the present value of future costs is a key component [3]. Although new research implies that discount rates for long-term challenges like global warming should decrease over time, the standard method assumes a constant discount rate. In order to account for the fact that the developing world is disproportionately more affected by the effects of global warming, the Clarkson-Deyes study developed the idea of equity weighting. Based on the degree of uncertainty around the discount rate, Newell and Pizer demonstrated using the Nordhaus- Boyer "DICE" model that the marginal social cost of carbon needs to be compounded by a number of factors. In conclusion, it is possible to evaluate the social costs of greenhouse gas emissions and consider them when assessing climate change initiatives. These estimates depend on the model used, and some more recent models have taken adaptability into account, which has resulted in lower societal cost estimates. In climate change analysis, discount rates must take uncertainty and the potential effects of equity weighting into account.
The social cost of carbon is calculated using straightforward criteria, which raises a number of problems. First off, the models ignore the need for immediate policy changes and assume a balanced development path. Second, several theories put forth on the harms caused by high temperatures or CO2 levels conflict with other theories. Thirdly, the regulations should be based on ideal GDP rather than on models of optimal growth, which correlate social cost with real GDP. The effectiveness of basic rules and first-best approaches is also contrasted in the study.
The Social Cost of Carbon Dioxide (SC-CO2) and the harms brought on by CO2 emissions are examined in Kevin Rennert. According to a 2017 assessment by the US National Academies of Sciences, Engineering, and Medicine, the present figures are out of date. The SC-CO2 estimate is now $185 per metric tonne of CO2, which is 3.6 times more expensive than the current US government estimate of $51 per tonne. This rise is the result of improved predictions, models, damage functions, and discounting techniques. The revised estimates take into account the most recent findings and suggestions and are based on the new Greenhouse Gas Impact Value Estimator (GIVE) model. The predicted advantages of reducing greenhouse gas emissions and the anticipated net benefits of stricter climate policies are increased by the higher SC-CO2 values.
The difficulties faced by nations that produce oil and gas are also covered in Ploeg, including low pricing, climate policies, and technological improvements. Countries must invest in strong institutions, human capital, and diversified economies in order to deal with these issues. A social cost of carbon accounting system can also aid in lowering the demand for fossil fuels and encouraging investment in renewable energy sources and carbon capture and sequestration. The risks associated with climate change can be reduced and stranded assets can be avoided by implementing a worldwide carbon price or trading emission allowances [4]. Thus, the Social Cost of Carbon (SCC) can be a useful instrument in resolving the issues facing nations that produce oil and gas. It can encourage the switch to renewable energy sources and encourage investment in green technology by pricing carbon emissions. It can also promote sustainable economic growth and lessen the adverse effects of global warming. Oil and gas producing nations can use the Social Cost of Carbon (SCC) as a useful tool for managing their problems. It can encourage the switch to renewable energy sources and encourage investment in green technology by pricing carbon emissions. Additionally, it can encourage sustainable economic growth and lessen the adverse effects of global warming.
Overall, the literature analysis convinced us that SCC can help policymakers assess the financial viability of various carbon reduction strategies. The SCC has drawbacks, such as the degree of uncertainty surrounding its assessment and the difficulty of considering the longterm effects of climate change. However, accurate calculations and the right data can greatly aid in the development of improved policies, which are particularly helpful in the context of the oil and gas industries. The oil and gas industries may be significantly impacted by the Social Cost of Carbon (SCC) calculations. If the SCC is set high enough, these industries might have to pay more money and be subject to more rules. The SCC may have an impact on these industries' investment and technological choices. Lower SCC values, however, might make it less appealing for businesses to make the switch to more sustainable practices [5]. In the end, the SCC may have an impact on how the oil and gas sectors develop and how much they contribute to global warming.
Research gap
The focus of integrated assessment models is on parameters that are clearly defined and for which we have reliable information on the financial losses brought on by certain changes in temperature, precipitation, or other environmental elements. A few examples of these costs include increases in agricultural production, health effects, sea level rise and coastal property damage, changes in energy use, and declines in labor productivity.
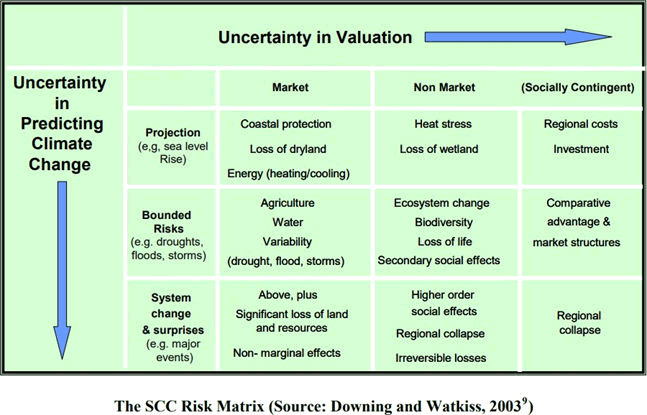
However, not all the impact categories of climate change are included in the literature studies, and most researchers think it is more likely that there will be unpleasant shocks than pleasant ones [6]. To determine whether they would be underestimating the overall SCC, the research evaluated the valuation studies' coverage. This was done using the risk matrix shown below (Figure 1), which considered both the uncertainty of value and the uncertainty of the implications of climate change.
Figure 1: The social cost of carbon risk matrix.
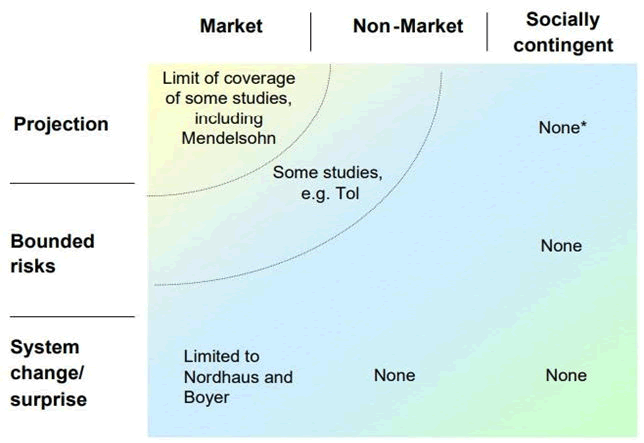
Most of the research and models only occupied the top left corner of the matrix when the literature studies were mapped onto it. Few studies look at potential hazards from extreme weather or non-market damages (floods, storms, etc.). Few, if any, discuss the potential for long-term ramifications and catastrophic events, and none discuss socially dependent effects. As a result, the uncertainty of the SCC values encompasses both the ‘real' value of impacts that are considered by the models and uncertainty surrounding consequences that have not yet been identified and evaluated [7]. The most important discovery may be that it shows that values in the literature represent a subset of the entire SCC how much of a subset is unknown. Figure 2 shows the coverage of Social Cost of Carbon (SCC) studies against the risk matrix.
Figure 2: The coverage of SCC studies against the risk matrix.
Objective
The purpose of this study is to ascertain the connection between oil and gas businesses' carbon emissions and the upkeep of their carbon emission monitoring systems. To forecast the carbon emissions in India, China, and all of Asia, we also want to build a machine-learning model utilizing data on carbon emissions from 1850 to 2021. This study analyses data from “Our World In Data” over a 170-year span to develop a model that forecasts future carbon emissions in Asia, particularly in India and China.
Data and Methodology
We were ultimately able to learn about the facility's carbon emissions and whether they are being attempted to be maintained after extensive research.
Facilities ID, facility name, carbon emissions, and emission monitoring (either 1 or 0) were the main pieces of information. We were also able to gather data on the carbon emissions of China and India, two of Asia's major contributors, as well as statistics on Asia as a whole, in addition to this data set [8].
Both annual carbon usage and CO2 emissions are included in the data set. The period covered by the data collection is from 1850 to 2021. This allowed us to establish the:
Figure 3, presents a data snippet (25 out of 470 records) containing key information on facility id, facility name, basin location, total reported emissions from onshore oil and gas production (in units of *10000), and emission monitoring status (0=N/1=Y).
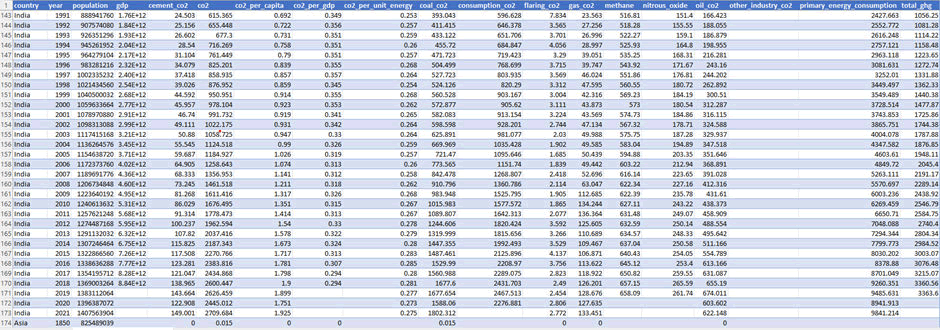
Figure 4, showcases a data snippet from a comprehensive dataset (516 records) consisting of country, year, population, GDP, and various emissions-related variables including cement_co2, co2, co2_per_capita, co2_per_gdp, co2_per_unit_energy, coal_co2, consumption_co2, flaring_co2, gas_co2, methane, nitrous_oxide, oil_co2, other_industry_co2, primary_energy_consumption, total_ghg.
Figure 3: Summary of onshore oil and gas production emissions data.
Figure 4: Summary of emissions and energy data across India, China, and Asia.
Social cost of carbon=Change in carbon consumption/Change in carbon emission
Information on emissions from various sources is also provided, such as information on CO2 emissions per person, CO2 from petrol, CO2 from coal, etc. We selected the data to fit our needs.
With the help of the SKLearn and Scikit-Learn libraries, we have pre-processed or refined the data. The NaN values we had in the dataset have been replaced with the median of the data that is currently accessible [9]. We subsequently divided the data set into test and training data sets in percentages of 20 and 80 in accordance with industry standards.
Problems with the dataset:
- The dataset was small.
- The dataset contained many of NaN values.
Methods
In the ML model, we used both the linear regression algorithm and the decision tree regressor algorithm.
To forecast future emissions of carbon dioxide, total greenhouse gas, methane, nitrous oxide, etc. in India, China, and Asia as a whole, linear regression and decision tree regression are utilized.
The decision tree regressor algorithm is one of the most well-liked and effective techniques for supervised learning. It can be used to solve both regression and classification tasks, while classification is more typically applied in real-world scenarios. This tree-structured classifier contains three different types of nodes [10].
Additional data visualization has been done to help comprehend the connection between actual and anticipated carbon emissions and consumption.
After calculating the errors for the decision tree regression model and the linear regression model, we concluded that the decision tree model is significantly more effective in predicting future emissions.
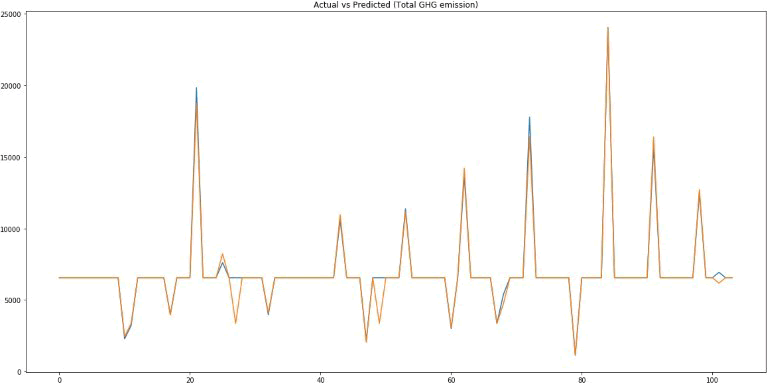
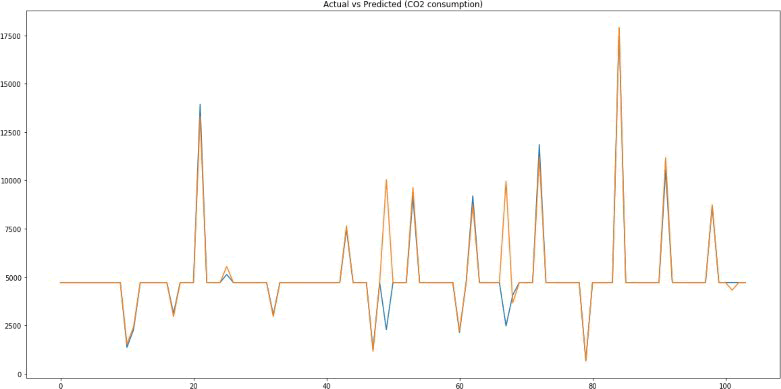
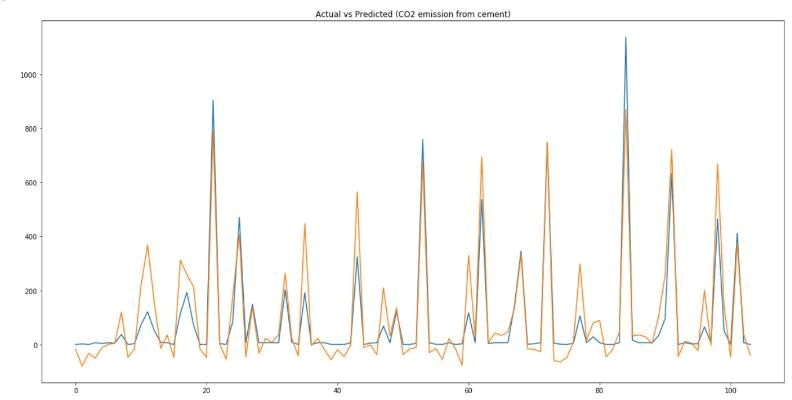
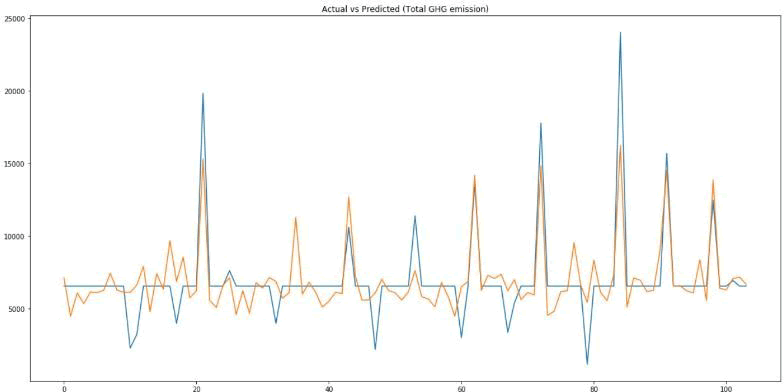
Figures 5 and 6 illustrate the outcomes derived from the application of the Decision Tree Regression algorithm. These figures depict a considerable overlap between the actual and predicted values, indicative of the algorithm's robust predictive capability. Conversely, Figures 7 and 8 showcase the results obtained using the linear regression algorithm. Here, a greater degree of variance is observed between the actual and predicted values, suggesting less predictive accuracy compared to the decision tree regression approach. Upon comparative analysis of both algorithms, it becomes evident that the decision tree regression model demonstrates superior efficiency in prediction [11]. Consequently, it is recommended as the more effective choice over the linear regression model for tasks requiring high predictive accuracy.
Decision tree regression algorithm results:
Figure 5: Actual vs. predicted (Total GHG emissions).
Figure 6: Actual vs. predicted (CO2 consumption).
Figure 7: Actual vs. predicted (CO2 emissions from cement).
Figure 8: Actual vs. predicted (Total GHG emissions).
Cons of the model:
We have taken 4 independent variables:
- Country
- Population
- GDP
- Year
If the dataset had been bigger, we could have added more independent variables to get more precise results.
Results and Discussion
H0: Companies monitoring carbon emissions emit less carbon.
HA: Companies monitoring carbon emission do not emit less carbon.
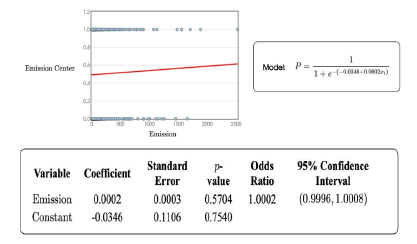
We have verified the hypothesis using logistic regression. Equation for the logistic regression model is given below (Figure 9).
Figure 9: Equation for the logistic regression.
95% is the selected level of confidence. The logistic regression model indicates that p is bigger than alpha. Considering this, we adopt the null hypothesis.
The difference between actual and expected data is not very significant, according to the chi-square (2) value of 0.3241, which assesses the disagreement between observed and predicted frequencies of outcomes of a set of events or variables.
We concluded that the outcomes produced by the decision tree regressor algorithm were superior and less error-prone than those obtained by linear regression.
Chi-square=0.3241; df=1; p-value=0.5692
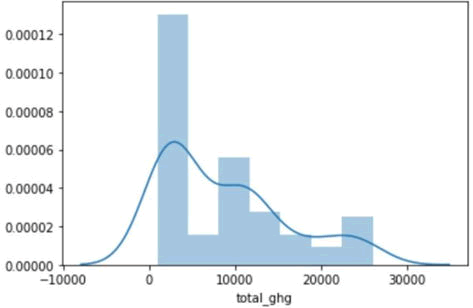
Figure 10 presents the distribution of total greenhouse gas emissions, depicted through a Kernel Density Estimation (KDE) plot.
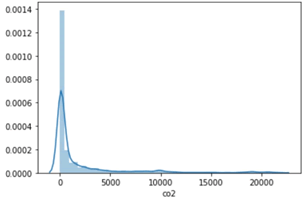
Similarly, Figure 11 visualizes the distribution of Carbon Dioxide (CO2) emissions, also utilizing a KDE plot for representation. A comparative analysis of these figures reveals a marked difference in the distribution patterns of these emissions. The greenhouse gas emissions exhibit a more uniform distribution, indicating a relatively even spread across the observed range [12]. In contrast, the distribution of CO2 emissions is notably skewed towards the right, suggesting a concentration of higher emission values within the dataset. This skewness in the CO2 emissions distribution underscores the variability and concentration of these emissions compared to the broader category of greenhouse gases.
Figure 10: Total GHG emissions distribution (using Kernel- Destiny estimation plot).
Figure 11: Total CO2 emissions distribution (using Kernel- Destiny estimation plot).
Consequences of the study
We are closely monitoring the consumption of carbon throughout Asia, particularly in China and India. The emissions are assumed to originate in the west because that is where the hydrocarbon production fields are located. While India imports 25% of its total crude oil from Russian extraction and 7% from USA basins, China buys 15.4% of the crude oil it uses globally from the Anadarko Basin.
We also learned through analysis that facilities with a high social cost of carbon are making an effort to keep track of the carbon they are generating. These elements could be too to blame for this:
- Horizontal research time. Aggregate models predict positive shortterm climate change impacts but negative long-term climate change consequences (even in the absence of significant events). Extending the temporal horizon, even with discounting, can substantially increase the SCC for present emissions (note that alternative discounting assumptions can make this considerably more significant). On the other hand, findings will be worse if the time period is constrained (for example, to only 100 years).
- Equitable weighting is a method for weighing effects across many locations. Because most medium-term implications occur in developing countries, the decision of whether to employ compensation values or to alter estimates using a type of distributional or equity weighting has a significant impact on the results. As stock weighing is applied more frequently, the values increase.
- Industry requirements or geopolitical considerations.
For example:
Centennial resource production, LLC facility, In response to findings that emissions of carbon dioxide, methane, and other Green House Gases ("GHGs") endanger public health and the environment, the EPA has adopted regulations under existing CAA provisions that, among other things, establish Prevention of Significant Deterioration ("PSD") preconstruction and title V operating permit reviews for certain large stationary sources that are already likely major sources of certain principal, or criteria, pollutants. The "best available control technology" standards, which are frequently established by state authorities, must also be followed by facilities that are required to get PSD licenses for their GHG emissions. Several of our companies are among the onshore and offshore producers of natural gas, oil, and NGLs that must disclose their GHG emissions annually under laws imposed by the EPA. However, the date of the federal implementation of the 2016 methane rule is undetermined at this time (as was previously detailed) [13]. Methane emissions have been the focus of government regulatory action on GHG emissions from the oil and gas sector. As per their 2019, annual report.
The few institutions that are not tracking the social cost of carbon are not doing so because a key model input, the valuation of centuryscale climate harm, is mainly unknown for fundamental reasons, according to more detailed research into these facilities. Fuel economy regulations may be expensive to implement, but they are outweighed by the advantages to society, according to a Stanford University analysis.
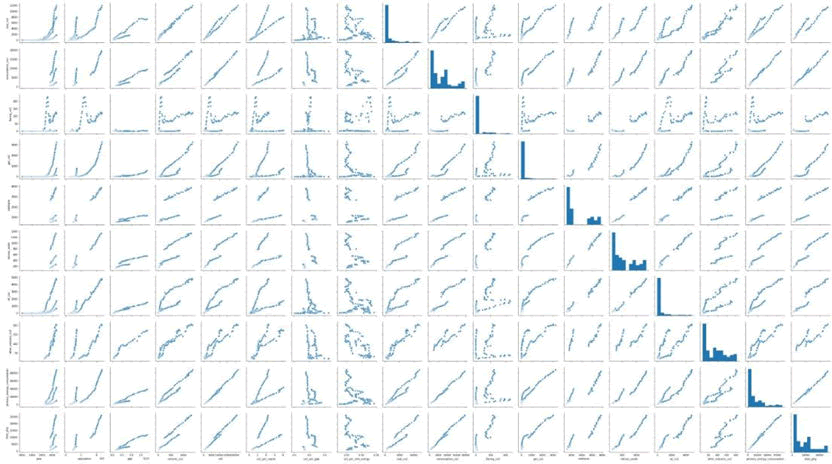
Figure 12 exhibits a comprehensive series of trend graphs, each constructed to elucidate the interdependencies among all the attributes under study. These plots, arranged in a matrix format, provide a visual exploration of pairwise relationships, allowing for the inspection of trends, correlations, and patterns within the multidimensional data set.
Figure 12: Trend Graphs plotted for visualizing dependencies of all attributes on each other.
Sustainability and SCC
When businesses and economies take the social cost of carbon into consideration, there are various benefits from a sustainability standpoint. Thus, it is becoming increasingly clear that mitigation strategies or scenarios meant to reduce greenhouse gas emissions might also have unintended consequences. These might have several benefits, including:
- Reduction in air pollution.
- Reduction in other environmental concerns
- Reduction of oil imports and improvement of energy security
- Increased employment and improved lifestyle
- Innovation
Air quality
Improved air quality is one of the largest unintended benefits of GHG mitigation, as shown by numerous researches. Even while the full impact of greenhouse gas reductions resulting from stronger climate action may not be seen until future generations, the current generation will benefit from the climate policy's collateral advantages for air quality. The potential negative consequences of greenhouse gas reduction initiatives have been assessed by a number of more recent studies.
Reduction in other environmental concerns
Ecosystems gain from measures to cut methane and nitrogen dioxide emissions from agriculture. Reduced nitrogen fertilizer use also aids in avoiding ecosystem acidification and eutrophication. In addition to better water quality brought on by a drop in ammonia emissions, agricultural GHG regulations also help ecosystems and biodiversity.
Forests planted as carbon sinks may also produce ancillary advantages including improved biodiversity, wildlife habitats, landscape, timber supply, and recreational activities, depending on the site type and forest management.
Energy security and oil imports
Recent energy estimates indicate a rising tendency in Europe towards energy imports, particularly for oil and gas. The following issues are brought up by this:
- Energy security (security of supply, including shocks to fuel prices and disruptions)
- Energy diversity
- Macroeconomic implications from imports
Because of increased supply diversity linked to likely increases in renewables, nuclear generation, coal generation with sequestration, and improvements in energy efficiency, low carbon technologies are generally assumed to have ancillary benefits from decreasing dependence on imports and increasing energy security.
Increased employment
The effects of environmental laws on employment, trade, and competitiveness are still up for discussion. Numerous studies have shown that the impact of labor costs far outweighs the effects of present environmental legislation, which are minimal. However, there have been concerns that these effects might have a greater impact on climate policy due to the substantial structural adjustments that would be required.
A change in lifestyle may be required to make the transition to a low-carbon civilization. For instance, air travel costs may rise. A modified way of life might also include giving the community and the environment more consideration.
Innovation
Numerous studies using low carbon modeling have found that nuclear power utilization has increased somewhat.
Concerns concerning waste management, safety, and (perhaps) proliferation may arise if this alternative is widely used, especially in developing countries without nuclear power plants. These issues do not exist with carbon capture and storage, which may develop into a significant substitute for large-scale power generation.
Limitations
The uncertainty of the IAM parameters, the variability of Earth’s systems and inability of the model to account for human and societal damages are significant limitations of the SCC calculation model.
The limitations have been broadly classified under these 3 headers.
High unknow ability of the key IAM parameters and the resulting range of SCC values: A key model tenet is that the centenary Climatic Damage valuation Function (CDF) will "always" remain mainly unknowable. The Social Cost of Carbon (SCC), a carbon price derived from cost-benefit based integrated assessment models and used to guide some climate policy, is computed using the CDF. The wide range of SCCs that result from different values of critical parameters like discount rates, climate sensitivity, and the CDF in this case, the unreliability of a leading model's warming projections to climate scientists, and the vehement criticisms of conventional CDFs by many climate economists all serve to highlight current disagreements.
IAM parameters not up to date and are restricted to a few “quantifiable” factors: IAMs work by transforming greenhouse gas emissions into effects of climate change and estimating the annual cost of those effects. IAMs consider a variety of factors in addition to changes in the planet's temperature, including changes in agricultural output, sea level rise, and changes in rainfall, extreme weather, and health issues.
Such impacts are "quantifiable" in the sense that they can be given a monetary value. However, it is not generally accepted that the IAMs used by the US government to calculate SCC are entirely up to date in terms of the most current scientific discoveries. They typically draw their inspiration from writing from the 1990s and the early decade of the 2000s, a time when the science has made considerable strides.
According to the NAS, there aren't enough IAMs to address issues like rising sea levels, extreme heat, tropical storms, agriculture, and labor productivity. However, none of the models used to calculate SCC account for the ocean acidification process, which is the oceans' gradual acidification because of absorbing too much CO2. Ocean acidification is now recognized as a global problem due to the damage it does to fisheries and ecosystem services.
Conclusion
In terms of monetary costs, some socioeconomic implications of climate change can be challenging to estimate. Migration and civil conflict are two instances of consequences that are "identifiable but hard to quantify." Some models might partially or entirely neglect some factors, such as the reduction in biodiversity and the provision of environmental services. It has been argued that because of these limitations, the IAMs are inherently biased in favor of inaction because it is easier to assess the costs of mitigation than the benefits of not emitting.
Human impact: Intricate human-climate links, such as how resource competition impacts food prices, are starting to be understood in scientific literature, but these connections are too complex for the simplified IAMs used to calculate SCC. The same is true of effects that travel from one industry or location to another. Some claim that until IAMs are better able to reflect the full depth and range of known climate consequences, they will continue to grossly underestimate the risks and remain disconnected from economic reality.
References
- Allen MR, Frame DJ, Huntingford C, Jones CD, Lowe JA, et al. (2009) Warming caused by cumulative carbon emissions towards the trillionth tonne. Nature 458: 1163-1166.
[Crossref] [Google Scholar] [PubMed]
- Andersson M, Bolton P, Samama F (2016) Hedging climate risk. Financ Anal J 72: 13-32.
- Downing T, Watkiss P (2003) The marginal social costs of carbon in policy making: Applications, uncertainty and a possible risk-based approach.
- Helm D (2012) The carbon crunch: How we're getting climate change wrong and how to fix it. Yale. ORIM.
- Lemoine D (2021) The climate risk premium: How uncertainty affects the social cost of carbon. J Assoc Environ Resour Econ 8: 27-57.
- Newell RG, Pizer WA (2003) Discounting the distant future: How much do uncertain rates increase valuations?. J Environ Econ Manag 46: 52-71.
- Pearce D (2003) The social cost of carbon and its policy implications. Oxf Rev Econ Policy 19: 362-384.
- Rennert K, Errickson F, Prest BC, Rennels L, Newell RG, et al. (2022) Comprehensive evidence implies a higher social cost of CO2. Nature 610: 687-692.
[Crossref] [Google Scholar] [PubMed]
- Richard ST (1995) The damage costs of climate change toward more comprehensive calculations. Environ Resour Econ 5: 353-374.
- Van der Ploeg F (2016) Fossil fuel producers under threat. Oxf Rev Econ Policy 32: 206-222.
- Watkiss P, Anthoff D, Downing T, Hepburn C, Hope C, et al. (2005) The social costs of carbon (SCC) reviewâ??methodological approaches for using SCC estimates in policy assessment. Final Report. AEA Technology Environment, Harwell.
- Weitzman ML (1998) Why the far-distant future should be discounted at its lowest possible rate. J Environ Econ Manag 36: 201-218.
- Withagen C (2022) On simple rules for the social cost of carbon. Environ Resour Econ 82: 461-481.
 Spanish
  Chinese
  Russian
  German
  French
  Japanese
  Portuguese
  Hindi
Hindi 