Spanish
  Chinese
  Russian
  German
  French
  Japanese
  Portuguese
  Hindi
Hindi Research Article, J Pharm Drug Deliv Res Vol: 10 Issue: 10
Formulation and Evaluation of Microemulgel Containing Tizanidine Hydrochloride
Sanjay Kumar GN*, Lavanya Nallaguntla, Gururaj S Kulkarni
Department of pharmaceutics, The oxford college of pharmacy, Bangalore, 560068, Karnataka
- *Corresponding Author:
- Sanjay Kumar GN
Department of pharmaceutics,
The oxford college of pharmacy,
Bangalore, 560068,
Karnataka,
Tel: 8310279393;
Email: sanjaykumargn177@gmail.com
Received date: August, 23, 2021; Accepted date: November 18, 2021; Published date: November 29, 2021
Citation: Sanjay Kumar GN, Nallaguntla L, Kulkarni GS (2021) Formulation and Evaluation of Microemulgel Containing Tizanidine Hydrochloride. J Pharm Drug Deliv Res 10: 10.
Abstract
The transdermal applications of a drug to the oral mucosa offer the potential advantages of delivering the drug directly to the site of action and possibly delivering the drug for an extended period of time. Recently Microemulgel has emerged as one of the most interesting topical preparations pharmaceutics field. They are relatively free of serious side effects .The use of Microemulgel as a delivery system has several advantages such as thixotropic, easily spreadable, non-staining, emollient, bio-friendly, clear, transparent & elegant appearance, the objectives of this study was aimed to develop and formulate Tizanidine hydrochloride, as a skeletal muscle relaxant. Tizanidine hydrochloride is used for the treatment of painful muscle spasm, spinal cord injury and in the treatment of muscle spasticity in spinal cord disease.
Keywords: Tizanidine hydrochloride, Micro emulsion, Microemulgel, Transdermal delivery, skeletal muscle relaxant.
Introduction
Introduction to Transdermal Drug Delivery System [1-5]
Transdermal drug delivery system is a localized drug delivery system in the body which delivers the drug through various routes such as ophthalmic, rectal, vaginal and skin. Currently, transdermal drug delivery is one of the most promising methods for drug application. It avoids the first pass metabolism, gastrointestinal metabolic degradation and irritation associated with oral administration. Transdermal drug delivery system can be defined as direct application of formulation containing medication to the skin to get localized effect of drug. It is the potential route to deliver the drug producing low side effect in comparison with any other dosage forms. Drug concentration can be optimized to low concentration due to lack of metabolic elimination of drug before reaching the targeted site. There are many conventional dosage forms for transdermal applications as ointment, cream, gel, but they show fluctuation in bioavailability of drugs and are associated with other limitation as gel is limited to deliver the hydrophilic drugs, ointment is limited for hydrophobic drug. Recently there have been novel approaches in the transdermal delivery to control the fluctuation of drug, deliver in a controlled manner as per our need and to decrease the limitation associated with conventional preparation and to improve their properties for patient compliance. In developing a transdermal delivery system, two criteria are considered: one is achieving adequate flux across the skin and the other is minimizing the lag time in skin permeation. One strategy overcoming this constraint is the incorporation of various chemical skin enhancers into the vehicle. Another strategy is a choice of an appropriate vehicle that corresponds to the drug being used for the dermal route of administration.
Advantages of Tdds
• Avoidance of first pass metabolism
• Avoidance of gastro intestinal incompatibility
• Predictable and extended duration of activity
• Minimizing undesirable side effects
• Provides utilization of drugs with short biological half life
• Narrow therapeutic window
• Improving physiological and pharmacological response
• Avoidance the fluctuation in drug levels
• Termination of therapy is easy at any point of time
• Greater patient compliance due to elimination of multiple dosing
profile
• Ability to deliver drug more selectively to a specific site
• Provide suitability for self-administration
• Enhance therapeutic efficacy
Limitations of Tdds
• Unsuitable for drugs that irritate or sensitize the skin
• cannot deliver in a pulsatile fashion
• Cannot deliver large doses of drugs through skin
• cannot administer drugs that require high blood levels
• May cause irritation or sensitization
• Not practical, when the drug is extensively metabolized in the skin
and when molecular size is great enough to prevent the molecules
from diffusing through the skin
• Not suitable for a drug, which doesn’t possess a favourable , O/W
partition coefficient
• The barrier functions of the skin changes from one site to another on
the same person, from person to person and with age.
• Skin irritation on contact dermatitis may occur due to the drug or
excipients.
The Human Skin
One highly successful alternative delivery method is transdermal delivery. To deliver a drug into the body through transdermal layer of skin, it is necessary to understand about the skin.
The skin is the outer covering of the body. In humans, it is the largest organ of the integumentary system made up of multiple layers of epithelial tissues and guards the underlying muscles, bones, ligaments and internal organs. For the average adult human, the skin has a surface area between 1.5 to 2 m2 (16.1-21.5 sq ft), most of it is between 2.3mm (0.10 inch) thick. The average square inch (6.5cm2) of skin holds 650 sweat glands, 20 blood vessels, 60,000 melanocytes and more than a thousand nerve endings. It performs several essential functions. The different layers of the human skin are shown in fig 1.
Anatomy of the Skin
Structurally, the skin consists of two principle parts. The outer thinner portion, which is composed of epithelium, is the epidermis. The epidermis is attached to the inner thicker, connective tissue part called the dermis. Beneath the dermis is a subcutaneous layer. This layer is also called the superficial fascia or hypodermis. It consists of areole and adipose tissues. Fibers from the dermis extend down into the subcutaneous layer and anchor the skin to it. The subcutaneous layer in turn attaches to underlying tissues and organs.

Figure 1: Anatomy of Human skin
Epidermis
In the word epidermis, “epi’ came from the Greek meaning “over” or “upon”. It is the outermost layer of the skin. It forms the water proof, protective wrap over the body’s surface and is made up of stratified squamous epithelium with an underlying basal lamina. It contains no blood vessels and cells in the deepest layer are nourished by diffusion from blood capillaries extending to the upper layers of the dermis.
Dermis
Dermis is 3 to 5mm thick layer and is composed of a matrix of connective tissue, which contains blood vessels, lymph vessels and nerves. The cutaneous blood supply has essential function in regulation of body temperature. It also provides nutrients and oxygen to the skin while removing toxins and waste products. Capillaries reach to within 0.2 mm of skin surface and provide sink conditions for most molecules penetrating the skin barrier. The blood supply thus keeps the dermal concentration of a permeant very low and the resulting concentration difference across the epidermis provides the essential concentration gradient for transdermal permeation. It contains hair follicles, sweat gland, sebaceous glands, apocrine glands, lymphatic vessels and blood vessels.
Hypodermis
The hypodermis or subcutaneous fat tissue supports the dermis and epidermis. It serves as a fat storage area. This layer helps to regulate temperature, provides nutritional support and mechanical protection. It carries principle blood vessels and nerves to skin and may contain sensory pressure organs. For transdermal drug delivery, drug has to penetrate through all these three layers and reach into systemic circulation while in case of topical drug delivery only penetration through stratum corneum is essential and then retention of drug in skin layers is desired. It consists of loose connective tissue and elastic. The main cell types are fibroblasts, macrophages and adipocytes.
Introduction to Micro emulsions
In 1943, Hoar and Schulman visualized the existence of small emulsion- like structures by electron microscopy and subsequently coined the term “microemulsions”.
Micro emulsions are thermodynamically stable isotropically clear dispersion of two immiscible liquids, such as oil and water, stabilized by an interfacial film of surfactant molecules, with a size range of 5-200 nm and have very low interfacial tension. Because of their unique solubilization properties, micro emulsion have attracted increasing attention as potential drug delivery systems, either as vehicles for topical applications or as bioavailability enhancers for poor water soluble active pharmaceutical ingredients (API). The existence of microdomains of different polarity within the same single-phase solution enables both hydrophilic and lipophilic materials to be solubilized. Advantages associated with microemulsions include their thermodynamic stability, optical clarity, ease of preparation, and high diffusion and absorption rates when compared with solvent without the surfactant system.

Figure 2: Microemulsion
Introduction to Microemulgel
A new approach in the field of topical drug delivery is introduced to deliver the hydrophilic drug that can enjoy the gelling property and whose rate can be controlled named Microemulgel. Even though microemulsions offer several advantages for topical delivery, it is difficult to stabilize the system because of low viscosity. This problem can be overcome by formulating microemulsion-based gel It is simply the preparations where microemulsion of the drug is prepared and are incorporated in the gel. Microemulgel are transparent and thermodynamically stable as their droplet size range from 10-100 nm. They have the combined advantage of both microemulsion and gel. Both hydrophilic and hydrophobic drugs can be incorporated into the dosage form.They provide a large surface area for drug absorption and oil portion increases the bioavailability by improving permeability of drugs. Microemulgel for dermatological use have several advantages like thixotropic, greaseless, easily spreadable, easily removable, emollient, non-staining, long shelf life, bio-friendly, transparent and pleasing appearance.

Figure 3: Microemulgel
Advantages of Microemulgel
• Hydrophobic drugs can be easily incorporated into gels using o/w
Micro emulsions
• Better stability
• Better loading capacity
• Production feasibility and low preparation cost
• No intensive sonication
• Prolongs the release of the drug
• Used for both hydrophobic (o/w microemulgel) and hydrophilic
drugs (w/o micro-emulsion).
Disadvantages of Microemulgel
• Drugs of large particle size are not easy to absorb through the skin
• skin irritation on contact dermatitis
• possibility of allergenic reactions
• Occurrence of the bubble during the formulation of Microemulgel.
Ideal properties of Microemulgel:
• Should be inert, compatible with other additives
• Should be free from microbial contamination
• Should be non-toxic
• Should be economical
• Should be maintained all rheological properties of the gel
• Should be washed with water and free from staining nature
• Should be convenient in handling and its application
• Should be stable at storage condition
Materials and Methods
Materials
Tizanidine hydrochloride was received as a gift sample from Symed labs, Telangana. India. Oleic acid, Isopropyl alcohol, Triethanolamine was received from S.D Fine chem. Ltd. Mumbai, India. Tween 80 and carbopol 934 obtained from Rolex chemical industries, Mumbai, India. And HPMC K 100-M obtained from Yarrow chem, products, mumbai, India.
Screening of Oil, Surfactant and Co-surfactant
Saturation solubility of drug in various oils (olive oil, oleic acid, castor oil , arachis oil , olive oil and liquid paraffin), surfactant (tween 80, tween 20, Span 80 and span 20) and co-surfactant (propylene glycol Isopropyl alcohol , polyethylene glycol – 400, Ethanol ) was determined. Excess of tizanidine hydrochloride was added to 5 ml of each oil, surfactant and co-surfactant. It was stirred for 48 hours on a magnetic stirrer at 500 rpm at room temperature. The solutions were then filtered through Whatman filter paper and scanned by UV spectrophotometer at λmax 228 nm. The experiments were repeated in triplicate. The solubility of drug in solvents was determined in mg/ml.
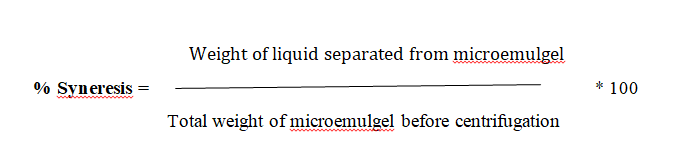
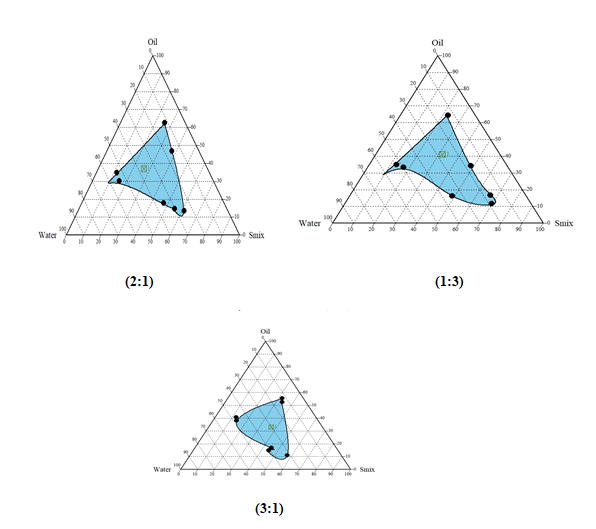
Construction of Pseudo Phase Diagram
Pseudo-ternary phase diagrams was constructed for obtaining concentration range of components for existing Micro emulsion regions by using Chemix School ternary diagram software.
The surfactant and co-surfactant used were Tween 80 and Isopropyl alcohol. The pseudo-ternary phase diagrams of oil, surfactant, cosurfactant, and water were constructed using water titration method to obtain the components and their concentration ranges that can results in large existence area of micro emulsion. Surfactant was blended with co-surfactant in fixed weight ratios (1:1, 1:2, and 1:3, 2:1 and 3:1). Aliquots of each surfactant and co-surfactant mixture (Smix) were then mixed with oil at room temperature. For each phase diagram, the ratios of oil to Smix were varied as 1: 9, 2:8, 3:7, 4: 6, 5:5, 6:4, 7:3, 8:2, and 9:1 (w/w). Water was added drop wise to each mixture under vigorous stirring by using magnetic stirrer. No heating was done during the preparation. Then, each mixture was visually observed for transparency. The samples were marked as points in the phase diagram. The area covered by these points was considered as the microemulsion region of existence.
| Formulation | Tizanidine Hydrochloride (mg) | Oleic acid ( ml ) |
Tween 80 ( ml ) |
Isopropyl alcohol (ml) | Water ( ml ) |
Ratio of Smix ( ml ) |
|---|---|---|---|---|---|---|
| ME-1 | 10 | 2 | 2.5 | 2.5 | 3 | 01:01 |
| ME-2 | 10 | 2 | 5 | 2 | 4.5 | 03:01 |
| ME-3 | 10 | 2 | 2 | 5 | 4 | 01:03 |
| ME-4 | 10 | 2 | 3.54 | 1.77 | 3.3 | 02:01 |
| ME-5 | 10 | 2 | 1.77 | 3.54 | 4.7 | 01:02 |
Table 1: Composition of the selected microemulsion formulations.
Formulation of Microemulsion
0.1 % of drug was weighed accurately and dissolved in oil by stirring on a magnetic stirrer. Water and surfactant were mixed together. This mixture was then added drop-wise to an oily solution of drug and mechanically stirred to form an emulsion. Co-surfactant was added drop wise to the emulsion. Formation of the transparent solution indicated the formation of Microemulsion.
Evaluation of Microemulsion
The prepared Microemulsion was evaluated for the following parameters:
% Transmittance Measurement
Microemulsion was diluted 100 times with distilled water. % transmittance of formulation was measured using UV Visible spectrophotometer at 228 nm wavelength against continuous phase (pH buffer of 5.5 ) as blank.
Particle Size Measurement
Particle size determination: Particle size of optimized microemulsion formulations were determined by dynamic light scattering Malvern Zetasizer. Sample preparation was done by diluting 0.1ml of microemulsion in distilled water i.e. dispersion medium.
Zeta Potential Measurement
Malvern Zeta Sizer (Malvern Instruments, UK) was used to measure the zeta potential of the globules. Samples were placed in clear disposable zeta cell and results were recorded.
Dilution Test
This test was carried out to find out which type of microemulsion was formed. The prepared microemulsion was diluted with water which was external /continuous phase.
Electro conductivity measurement
Electrical conductivity of MEs was measured with a conductivity meter for testing microemulsion type using conductivity cells with a cell constant of 1.0 and consisting of two platinum plates separated by desired distance and having liquid between the platinum plate acting as a conductor.
pH
The pH meter was calibrated with standard buffer solution having pH 4 and 7 before use.
And then prepared Microemulsion formulations was dissolved in distilled water and stirred until it forms uniform suspension, kept it aside for 2 hr. The volume made up to 100 ml and pH of the suspension can be measure with the digital pH meter. The measurements of pH of each formulation were performed in triplicate.
Density
Density was measured using a specific gravity bottle (density bottle). Weight of empty specific gravity bottle was noted as W1, weight of specific gravity bottle with distilled water noted as W2 and weight of specific gravity bottle with microemulsion was noted down as W3.
It can be calculated by the formula

Viscosity
Brookfield programmable DVII+ Model pro II type viscometer was used for viscosity studies. The prepared microemulsion formulations (100 ml) were placed in a beaker and were allowed to equilibrate for 5 minutes before measuring the dial reading using spindle No. 62 at a speed of 50 rpm.
Centrifugation
This is used to specify the stability of the microemulsion whether it is monophasic or not. The prepared microemulsion was centrifuged at ambient temperature at 5000 rpm for 10 minutes to evaluate the system for creaming or phase separation. The microemulsion was observed visually for appearance.
Drug content
The drug content was determined by dissolving amount of the formulation equivalent to 10 mg of active drug in 100ml of phosphate buffer pH 5.5. The volumetric flasks were kept for 2 hour over a rotary shaker to mix it properly. The solution was filtered and drug content was measured spectrophotometrically at 228 nm.
In-vitro drug release studies
The in vitro drug release studies were performed by using Franz diffusion cell with cellophane paper. The water jacketed recipient compartment had total capacity of 25 ml and it had 2 arms, one for sampling and another for thermometer. The donor compartment had internal diameter of 2 cm. The donor compartment was placed in such a way that it just touches the diffusion medium in receptor compartment. The receptor compartment contained phosphate buffer (pH 5.5) that was maintained at 37°C ± 1°C. The membrane was equilibrated before application of the microemulsion equivalent to 10 mg of drug onto the donor side. 5ml of Samples were periodically withdrawn from the receptor compartment, replacing with the same amount of fresh Phosphate buffer pH 5.5 solutions, and assayed by using a spectrophotometer at 228 nm.

Figure 4: Formation of Microemulgel
| Sl. No | Ingredients ( % w/w) | F1 | F2 | F3 | F4 | F5 | F6 | F7 | F8 | F9 |
|---|---|---|---|---|---|---|---|---|---|---|
| 1 | Tizanidine | 0.1 | 0.1 | 0.1 | 0.1 | 0.1 | 0.1 | 0.1 | 0.1 | 0.1 |
| Hydrochloride | ||||||||||
| 2 | Oleic acid | 3.5 | 3.5 | 3.5 | 3.5 | 3.5 | 3.5 | 3.5 | 3.5 | 3.5 |
| 3 | Tween 80 | 2 | 2 | 2 | 2 | 2 | 2 | 2 | 2 | 2 |
| 4 | Isopropyl alcohol | 1.75 | 1.75 | 1.75 | 1.75 | 1.75 | 1.75 | 1.75 | 1.75 | 1.75 |
| 5 | Carbopol 934 | 0.3 | 0.5 | 0.7 | 0.3 | 0.5 | 0.7 | 0.3 | 0.5 | 0.7 |
| 6 | HPMC K-100m | 0.6 | 0.6 | 0.6 | 0.8 | 0.8 | 0.8 | 1 | 1 | 1 |
| 7 | Triethanolamine | 1 | 1 | 1 | 1 | 1 | 1 | 1 | 1 | 1 |
| 8 | Water | q.s | q.s | q.s | q.s | q.s | q.s | q.s | q.s | q.s |
Table 2: Microemulsion based gel formulation table.
Development of Microemulsion Based Gel
Carbopol 934 and HPMC K100 M polymers were used as a gelling agent in the formulation of microemulsion based gel. Both the polymers were soaked separately in water for 24 hours. They were mixed to form gel phase. The prepared microemulsion was then added to the gel phase to form microemulsion based gel and mixed until the smooth, elegant gel was obtained.
Evaluation of Microemulgel
The Prepared Microemugel was evaluated for the following parameters:
• Physical examination
• Extrudability test
• Syneresis measurement
• pH
• Spreadability test
• Rheological study
• Drug content
• Invitro diffusion study
Physical Examination
Prepared microemulsion based emulgel was checked for their colour, and consistency.
Extruability test
It is test performed to determine the force required to extrude the material from tube. The formulations were filled in the collapsible tubes. The extruability of the formulation was determined in terms of weight required to extrude 0.5 cm ribbon of microemulgel in 10 second .When more quantity is extruded, extrudability is considered to be better. The percentage of gel extruded was calculated and recorded.
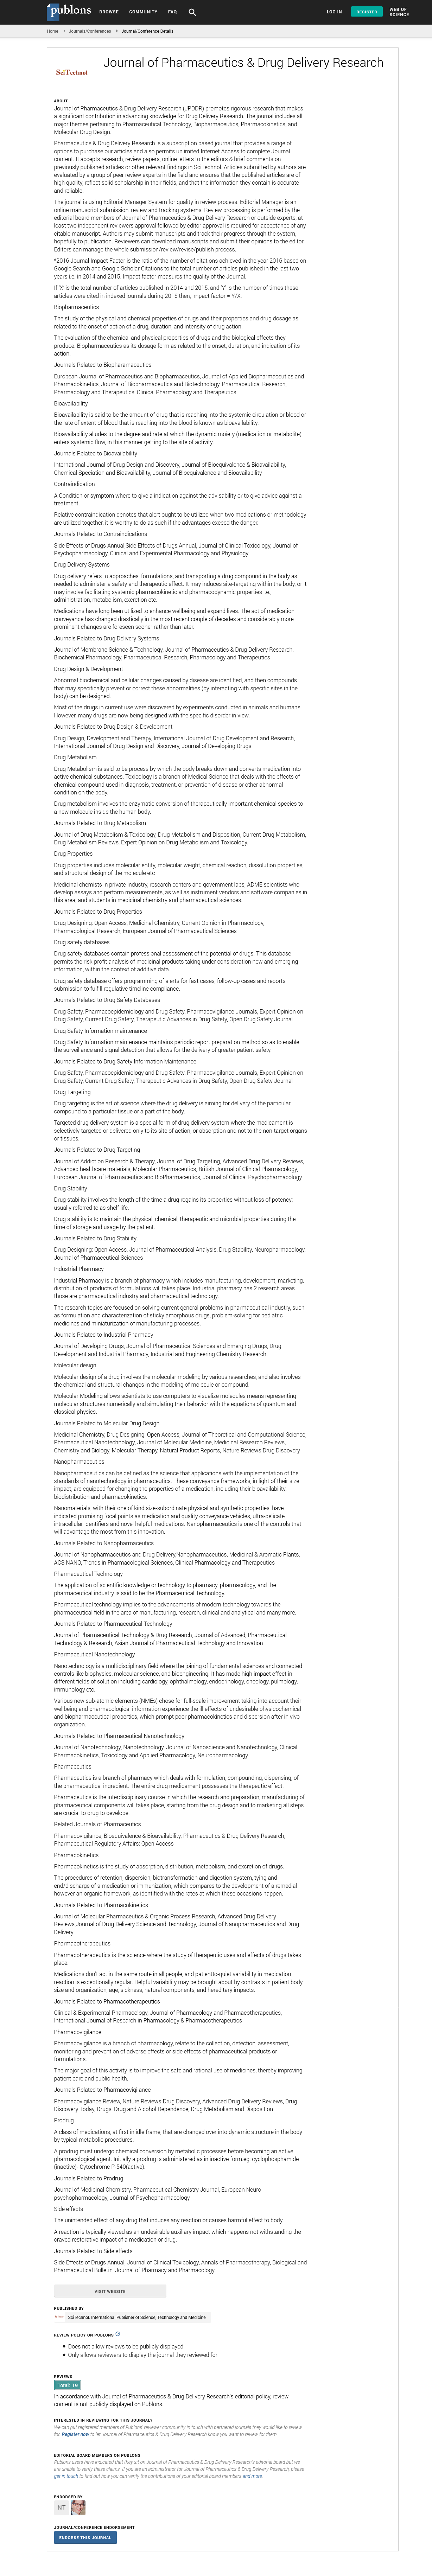
Syneresis measurement
After microemulgel was visually inspected, it was tested for any possible phase separation. Upon standing, gel sometimes shrinks and little liquid is pressed out. This phenomenon is called syneresis. It is expressed as percent syneresis. This test involves the use of a centrifuge machine. The formulation was added in a cylindrical tube which had a perforated bottom which was covered with Whatman filter paper. The tube was placed in the centrifuge and centrifuged for 15 minutes. Tube and liquid separated from microemulgel were weighed. Percent syneresis was calculated using formula.
pH
The pH value of Microemulgel formulation can be measured by using pH meter (Digital pH meter). The pH meter was calibrated with standard buffer solution having pH 4 and 7 before use. And then the 1% aqueous solution of the prepared Microemulgel can be made. 1 gm of formulation was dissolved in distilled water and stirred until it forms uniform suspension, kept it aside for 2 hr. The volume made up to 100 ml and pH of the suspension can be measured with the digital pH meter. The measurements of pH of each formulation were performed in triplicate.
Spreadability Test
Spreadability was performed by using two glass slides of length 7.5 cm. 350 mg of microemulgel was weighed accurately and it was taken on one glass slide. Another glass slide was placed above it from a height of 5 cm. A weight of 5 gm was kept on the upper slide and after 1min; diameter of circle that was spread was noted in cm. The observed .
Viscosity
Brookfield DV-II + Pro viscometer was employed for measurement of viscosity. Approximately 1g of microemulgel was taken on the plate of Brookfield viscometer and it was allowed to settle for 5-10 min and then spindle 62 was placed on the plate containing gel and rotated at a speed of 50 rpm with the help of spindle. The temperature was maintained at 25°C and corresponding dial reading was noted down. Reading indicates the viscosity of the formulations in cps.
Drug Content
Determination of drug content is necessary to evaluate the uniform distribution of drug in the formulation. It ensures a minimum batch to batch variation. Tizanidine hydrochloride content in microemulgel was determined by dissolving the known quantity of formulation in phosphate buffer pH 5.5 by sonication. The solution was stirred for 3-4 hours on magnetic stirrer to ensure complete dissolution of formulation in methanol. Later, the solution was filtered through Whatman filter paper. Their absorbance was measured at 228 nm using diameter indicates the type of gel UV Visible spectrophotometer. All the experiments were performed In triplicate.
In-vitro Diffusion Study
In-vitro drug release study of Microemulgel was carried out in a modified Franz diffusion cell using Cellophane membrane. Cellophane membrane (cut to suitable size) was stored in phosphate buffer pH 5.5 for 12 hours before use and was placed in between donor and receptor compartment.1g of Tizanidine hydrochloride microemulgel was spread on cellophane membrane. The entire surface of membrane containing formulation was in contact with receptor compartment containing 100 ml of phosphate buffer pH 5.5 Cell was agitated on a magnetic stirrer at 50 rpm and the temperature of receptor medium was maintained at 37 ± 1°C. Aliquots of 5 ml were withdrawn at predetermined intervals up to 480 minutes. The absorbance of samples was measured at 228 nm . All the experiments were performed in triplicate.
Drug-Excipient Compatibility Studies
Assessing the possible incompatibility between active ingredients and various excipients is an important part of the pre-formulation stage of the formulation development process. The use of FTIR technique allows pointing out the implication of the different functional groups of drug and excipients by analyzing the significant changes in the shape and position of the absorbance bands.
The FTIR used here is Bruker Alpha II FTIR spectrometer with a Zinc Selenide Crystal ATR (Attenuated Total internal Reflectance) accessory. The measurement of liquid and solid samples can be performed directly, without the need for salt plates or special sample processing. The spectrometer is operated using software Opus 7.8.
Procedure: Samples are placed directly on the Zinc selenide crystal plate. For a solid sample apply enough powder to coat the crystal with approximately 1 mm thickness of material. Position the pressure arm over the sample and apply pressure to the sample.
Here transmission of the IR radiation through the sample is not measured; we are measuring how much the IR radiation is attenuated by the sample. The sample is placed on a crystal with a high refractive index. The intensity of the incident rays is known. When the light rays strike the interface between the Zinc selenide crystal and the sample, they undergo total internal reflectance. An evanescent wave travels beyond the surface of the crystal into the sample approximately 0.5 to 5 μm before being refracted back into the crystal. This is why the sample must be in tight contact with the crystal. The evanescent wave will be attenuated in regions where the sample absorbs IR radiation. The spectral range is 4000 – 400 cm-1. The IR beam exits at the opposite end of the crystal and passes to the detector which measures the attenuation. Thus, unlike a transmittance spectrum which is showing the % transmittance of IR light, this shows the amount of IR energy that is absorbed. But there is a button for converting between absorbance and transmittance. Clicking on the indicated button will convert the spectrum into the traditional transmission spectrum appearance.
Kinetics of Drug release
To study the kinetics and mechanism of drug release, the release data of the in- vitro diffusion study of Tizanidine hydrochloride microemulgel formulaions were fitted in various kinetic models.
Stability study
Stability study for the optimised batch was carried out as per ICH guidelines. Short term accelerated stability of gel was carried at 40°C ± 2°C /75% ± 5% RH for 3 months. The microemulgel formulation were tested and checked at regular intervals for changes in Physical appearance, consistency, pH ,viscosity , Spreadability , and drug content.
Results and discussion
| Sl no | Solvent | Solubility ( mg/ml ) |
|---|---|---|
| 1 | Distilled water | 1.23 |
| 2 | Methanol | 1.41 |
| 3 | Phosphate buffer pH 5.5 | 3.67 |
| 4 | Chloroform | 0.89 |
| 5 | Ether | 0.74 |
Table 3: Solubility studies of drug in various solvents
| Sl. No. | Oils | Solubility (mg/ml) |
|---|---|---|
| 1 | Olive oil | 2.7 |
| 2 | Arachis oil | 1.93 |
| 3 | Castor oil | 1.62 |
| 4 | Oleic acid | 3.46 |
| 5 | Liquid paraffin | 2.95 |
Table 4: Solubility of Tizanidine hydrochloride in various oils.
| Sl. no. | Surfactants | Solubility (mg/ml) |
|---|---|---|
| 1 | Tween 20 | 2.92 |
| 2 | Tween 80 | 4.33 |
| 3 | Span 80 | 1.951 |
| 4 | Span 20 | 1.69 |
Table 5: Solubility of Tizanidine hydrochloride in various surfactants.
| Sl. no. | Co-surfactants | Solubility (mg/ml) |
|---|---|---|
| 1 | Propylene glycol | 2.9 |
| 2 | Isopropyl alcohol | 3.21 |
| 3 | Polyethyenene glycol 400 | 2.11 |
| 4 | Ethanol | 1.78 |
Table 6: Solubility of Tizanidine hydrochloride in various co-surfactants.
Among surfactants Tween 80 having highest solubility and was selected as a surfactant in tizanidine hydrochloride microemulsion formulation. The drug tizanidine hydrochloride showed maximum solubility in oleic acid among various oils. Among all studied surfactants, Tizanidine hydrochloride showed maximum solubility in tween 80 and Propylene glycol showed maximum solubility among co-surfactant.
Construction of Pseudo-ternary phase diagrams:
Largest transparent microemulsion region was found with Smix ratio 1:2 and therefore it was selected for preparation of microemulsion.
Drug-excipient compatibility studies:

Figure 5: IR band of Tizanidine hydrochloride

Figure 6: IR band of Tizanidine hydrochloride drug + oleic acid + tween 80 + Isopropyl alcohol + Carbopol 934 + HPMC K -100M + Triethanolamine
Evaluation of Microemulsion
% Transmittance
Percentage transmittance was used as one of the responses to optimize the amount of Smix and oil to get the desired microemulsion. All five batches showed good transmittance proving transparency of the Microemulsion. The microemulsion (ME-5) showed maximum 5 transparencies of 97.9%. (Table 7)
Particle Size Measurement
Particle size of microemulsion ME-5 was found to be 198.8 nm , which did not show a conclusive pattern to correlate with formulation components.

Figure 7: particle size of ME-5
Zeta Potential
The zeta potential of optimized ME-5 was found to be-34.5 mV, the negative zeta potential indicates that globules of microemulsion had no charge, that is, the system was stable. As there was no charge on globules, no flocculation of globules occurred and hence, microemulsion was found to be stable.

Figure 8: Zeta potential graph of Microemulsion ME-5
Conductivity Measurement
The conductivity of microemulsion ME-1 – ME-5 was found in between 0.067 – 0.136 Ms/cm. From the electro-conductivity study it can be concluded that the five batches are of O/W type. (Table 7)
Centrifugation
All the 5 microemulsion batches not shown any phase separation which indicates that it has a good stability. (Table 7)
| Formulation Code | % Transmittance | Conductivity (mS/cm) | Centrifugation |
|---|---|---|---|
| ME-1 | 95.4±0.251 | 0.136 | No phase separation |
| ME-2 | 96.7±0.220 | 0.134 | No phase separation |
| ME-3 | 96.3±0.226 | 0.105 | No phase separation |
| ME-4 | 97.6±0.158 | 0.067 | No phase separation |
| ME-5 | 97.9±0.208 | 0.125 | No phase separation |
Table 7: Evaluation of % transmittance, conductivity and centrifugation.
Ph
PH of microemulsion (ME-1 to ME-5) was found to be in the range of 6.6 to 5.7. (Table 8)
Density
All the 5 microemulsion formulations showed density close to 1 g/ml. (Table 8)
Viscosity
The viscosity of microemulsion formulations ME-1 to ME-5 were found in between 2934 to 4495 cps. (Table 8)
Drug Content
The drug content for the Tizanidine hydrochloride microemulsions was ranging from 98.45 ± 0.281 % to 82.86 ± 0.989 %.( Table 8)
| Formulation | pH | Density | Viscosity (cps) | Drug content |
|---|---|---|---|---|
| (g/ml) | ||||
| ME-1 | 5.7±0.305 | 0.357 | 4495 ± 21.82 | 82.86 ± 0.989 |
| ME-2 | 6.4±0.360 | 0.36 | 3864 ± 24.78 | 91.17 ± 0.354 |
| ME-3 | 5.9±0.325 | 0.372 | 4107 ± 17.57 | 87.88 ± 0.507 |
| ME-4 | 6.1±0.257 | 0.387 | 3267 ± 15.52 | 96.29 ± 0.848 |
| ME-5 | 6.6±0.342 | 0.381 | 2934 ± 17.24 | 98.45 ± 0.281 |
Table 8: Evaluation of pH, density, viscosity and drug content.
Invitro Drug Release
% Drug release of microemulsion formulations ME-1 to ME- 5 were found to be in the range of 98.30 ± 0.883 to 7.57 ± 0.900.Among the 5 microemulsion formulations ME-5 has shown maximum drug release of 98.30 ± 0.883 % compared to other formulations.
| TIME | % DRUG RELEASE | ||||
| (min) | ME-1 | ME-2 | ME-3 | ME-4 | ME-5 |
|---|---|---|---|---|---|
| 0 | 0 | 0 | 0 | 0 | 0 |
| 15 | 6.16 ± 1.182 | 5.66 ± 1.163 | 6.08 ± 0.612 | 5.78 ± 0.558 | 7.57 ± 0.900 |
| 30 | 28.87 ± 1.060 | 18.96 ± 0.503 | 28.79 ± 0.794 | 30.50 ±0.423 | 29.12 ± 0.815 |
| 45 | 44.63 ± 0.969 | 41.21 ± 1.500 | 45.48 ± 0.818 | 54.30 ±1.872 | 43.67 ± 2.403 |
| 60 | 63.38 ± 0.538 | 58.70 ± 1.563 | 63.25 ± 1.058 | 65.39 ±4.526 | 57.37 ± 2.752 |
| 90 | 75.50 ± 1.272 | 82.27 ± 1.864 | 78.31 ± 1.228 | 76.19 ±1.488 | 78.97 ± 3.191 |
| 120 | 85.86 ± 0.317 | 92.31 ± 0.471 | 88.23 ± 0.956 | 95.84 ±0.513 | 98.30 ± 0.883 |
Table 9: Invitro drug release of microemulsion.
Evaluation of Microemulgel
Physical Examination
Microemulgel was found to be white, viscous and smooth in consistency.
F1, F2 and F4 formulations were found to have very good consistency and smooth appearance compared to other formulations.
Extrudability Test
Extrudability of F1, F2, F3 and F4 formulations were found to be better than other formulations. (Table 10)
% Syneresis Measurement
% Syneresis of microemulgel was found to be very less which indicates that microemulgel showed stability at room temperature. (Table 10)
| Formulation | Extrudability(%) | % Syneresis |
|---|---|---|
| F1 | 92.59± 2.9 | 3.34 ± 0.48 |
| F2 | 95.71 ± 4.3 | 1.63 ± 0.62 |
| F3 | 94.23 ± 3.8 | 1.89 ± 0.43 |
| F4 | 97.66±4.1 | 2.44 ± 0.74 |
| F5 | 89.81 ±4.6 | 3.78 ± 0.67 |
| F6 | 88.04 ±4.2 | 2.91 ± 0.93 |
| F7 | 86.32 ±4.5 | 4.47 ± 0.41 |
| F8 | 83.29 ± 5.3 | 3.18 ± 0.53 |
| F9 | 81.24 ± 5.6 | 1.93 ± 0.39 |
Table 10: Evaluation of extrudability and syneresis.
ph
The pH of the topical formulations should be compatible with skin pH. A change in the pH may cause irritation or disruption of skin. The pH of all formulations was modified and when measured, it was found between 5.7 and 6.5, which is acceptable for skin preparations. (Table 11)
Spreadability Test
The values of spreadability indicate that the gel is easily spreadable on the application of a small amount of shear and spreadability was found to be in the range of 14.7 to 13.2gm.cm/sec. (Table 11)
Rheological Study
Viscosity of the Tizanidine microemulgel was found to be between 7585 ± 8.504 to 9516 ± 17.38 cps (Table 11)
Drug Content
The drug content was found to be in the range of 94.27 ± 1.838 to 75.21 ± 0.372%. Formulation F1 has shown maximum drug content among all other batches (Table 11)
| Formulation Code | pH | Spreadability | Viscosity (cps) | Drug content % | ||
|---|---|---|---|---|---|---|
| (gm.cm/s) | ||||||
| F1 | 6.5 ± 0.208 | 14.7 ± 0.171 | 7585 ± 8.504 | 94.27 ± 1.838 | ||
| 91.78 ± 1.230 | ||||||
| F2 | 6.4 ± 0.159 | 14.4 ± 0.251 | 7917 ± 11.015 | |||
| F3 | 6.2 ± 0.231 | 14.2 ± 0.143 | 8183 ± 11.532 | 88.77 ± 1.389 | ||
| F4 | 6.1 ± 0.217 | 13.9 ± 0.248 | 8261 ± 11.583 | 87.08 ± 1.492 | ||
| F5 | 5.9 ± 0.351 | 13.8 ± 0.203 | 8396 ± 8.185 | 84.36 ± 1.568 | ||
| F6 | 5.8 ± 0.358 | 13.5 ± 0.159 | 8453 ± 14.730 | 82.67 ± 0.923 | ||
| F7 | 5.8 ± 0.264 | 13.4 ± 0.236 | 8786 ± 9.165 | 80.93 ± 0.848 | ||
| F8 | 5.7 ± 0.152 | 13.4 ± 0.252 | 9129± 13.051 | 79.90 ± 0.775 | ||
| F9 | 75.21 ± 0.372 | |||||
| 5.5 ± 0.174 | 13.2 ± 0.178 | 9516 ± 17.385 | ||||
Table 11: Determination of pH ,Spreadability, viscosity and drug content of microemulgel.
In-vitro diffusion study:
Among the 9 microemulgel formulations, F1 has shown maximum drug release of 97.36 ± 1.41 %. (Table 12, 13)
| TIME | % DRUG RELEASE | ||||
|---|---|---|---|---|---|
| (min) | F1 | F2 | F3 | F4 | F5 |
| 0 | 0 | 0 | 0 | 0 | 0 |
| 15 | 3.50 ± 0.742 | 3.38 ±0.798 | 3.04±0.572 | 4.11±0.308 | 5.28±0.318 |
| 30 | 7.08 ± 1.333 | 8.01 ±1.741 | 6.83±1.096 | 9.60±0.423 | 11.38±1.343 |
| 45 | 14.35 ± 1.132 | 14.76 ±2.818 | 12.08±1.599 | 17.25±0.702 | 20.05±0.797 |
| 60 | 19.37 ± 2.092 | 19.36 ±1.255 | 18.60±2.374 | 25.13±2.696 | 27.77±2.630 |
| 90 | 27.52 ± 0.745 | 28.35 ±3.560 | 26.39±3.617 | 33.55±3.654 | 34.37±2.711 |
| 120 | 35.93 ± 1.799 | 36.67 ±3.772 | 33.98±4.292 | 43.86±4.233 | 42.49±3.004 |
| 180 | 44.84 ± 1.883 | 43.76 ±2.755 | 44.03±6.326 | 54.86±6.525 | 57.79±8.235 |
| 240 | 57.76 ± 2.256 | 59.81 ±4.668 | 56.14±3.735 | 62.09±7.559 | 60.97±1.525 |
| 300 | 64.91 ± 1.464 | 67.86 ±4.170 | 65.22±3.999 | 68.35±6.765 | 69.97±3.081 |
| 360 | 76.58 ± 1.459 | 76.69 ±1.732 | 76.07±3.290 | 77.42±4.121 | 78.11±1.796 |
| 420 | 89.32 ± 1.265 | 86.03 ±6.152 | 87.66±4.483 | 85.58±2.025 | 84.64±1.135 |
| 480 | 97.36 ± 1.415 | 94.41 ±0.702 | 93.17±2.000 | 91.11±0.522 | 89.63±0.440 |
Table 12: invitro drug release table of Microemulgel formulations (F1 – F5).
| TIME | % DRUG RELEASE | |||
| (min) | F6 | F7 | F8 | F9 |
|---|---|---|---|---|
| 0 | 0 | 0 | 0 | 0 |
| 15 | 7.45 ±0.638 | 5.43±0.870 | 8.17±0.561 | 8.50±0.540 |
| 30 | 12.62 ±2.248 | 12.07±2.097 | 12.99±1.117 | 16.84±1.085 |
| 45 | 21.39 ±0.983 | 20.18±2.847 | 21.50±1.186 | 24.16±0.278 |
| 60 | 28.49 ±2.819 | 26.98 ± 4.133 | 29.60±2.579 | 32.57±0.137 |
| 90 | 36.99 ±4.008 | 36.10±4.803 | 36.72±3.040 | 41.22±0.001 |
| 120 | 45.65 ±4.830 | 42.05±3.435 | 44.43±2.370 | 46.98±0.135 |
| 180 | 54.87 ±5.018 | 50.36±4.020 | 50.81±0.919 | 55.22±0.269 |
| 240 | 64.53 ±4.876 | 58.18±5.540 | 58.59±3.969 | 61.14±0.272 |
| 300 | 70.21 ±5.925 | 63.97±4.176 | 63.85±2.718 | 68.99±0.268 |
| 360 | 77.28 ±5.527 | 70.83±4.491 | 67.98±2.466 | 73.97±0.538 |
| 420 | 84.30 ±1.644 | 79.44±2.225 | 72.84±2.676 | 78.30±0.806 |
| 480 | 88.61 ±0.739 | 87.56±0.674 | 85.81±0.580 | 81.61±0.411 |
Table 13: invitro drug release table of Microemulgel formulations (F6 – F9).

Figure 9: invitro drug release graph of Tizanidine Hcl microemulgel formulations (F1 – F9)
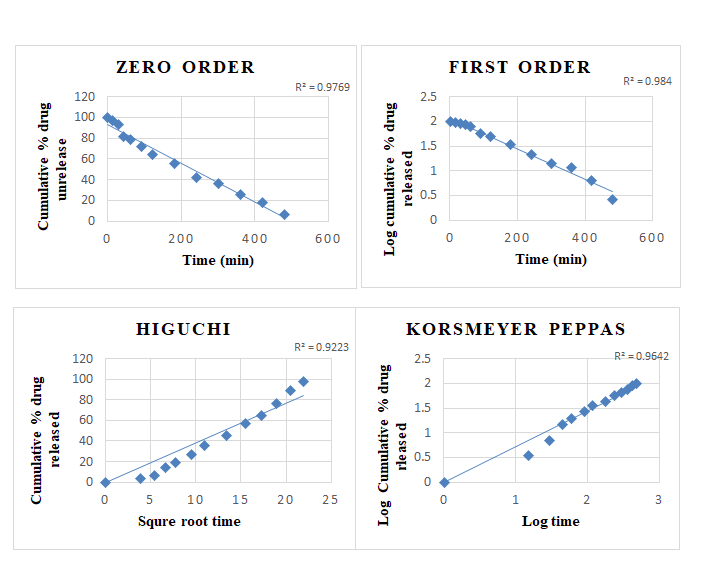
Kinetics of Drug Release
Drug release from all the batches of the microemulgel was evaluated for best fit model. Various kinetic models are zero order, first order, Higuchi, and Korsmeyer Peppas are performed.
| FORMULATION | ZERO | FIRST | HIGUCHI | KORSMEYER | |
|---|---|---|---|---|---|
| ORDER | ORDER | ||||
| R2 | R2 | R2 | R2 | N | |
| F1 | 0.976 | 0.984 | 0.922 | 0.964 | 0.795 |
| F2 | 0.961 | 0.975 | 0.932 | 0.966 | 0.792 |
| F3 | 0.93 | 0.988 | 0.919 | 0.953 | 0.801 |
| F4 | 0.944 | 0.98 | 0.962 | 0.973 | 0.778 |
| F5 | 0.937 | 0.989 | 0.972 | 0.983 | 0.757 |
| F6 | 0.929 | 0.993 | 0.981 | 0.986 | 0.736 |
| F7 | 0.939 | 0.993 | 0.977 | 0.982 | 0.739 |
| F8 | 0.915 | 0.957 | 0.984 | 0.978 | 0.709 |
| F9 | 0.899 | 0.987 | 0.985 | 0.972 | 0.71 |
Table 14: Release kinetics of tizanidine hydrochloride microemulgel.
Stability study
Stability study Optimized formulation was examined after 30 days for any changes in pH, rheological properties and drug release profiles. pH was found to be increased slightly. Viscosity was found to be increased at room temperature and then decreased at accelerated temperature. Drug release was found to be slightly decreased with temperature. Not much deviation was observed from optimized formulation F1, so it can be concluded that it showed acceptable stability on a given temperature and humidity. [Table 8]
| Sl. No | Formulation F1 | Before | Stored at 400C ± 20C and 75%±5% RH | ||
|---|---|---|---|---|---|
| storage | |||||
| 1st month | 2nd month | 3rd month | |||
| Physical | White and | No change | No change | No change | |
| 1 | Appearance | smooth | |||
| 2 | Consistency | Viscous | No change | No change | No change |
| 3 | Viscosity(cps) | 7585 | 7564 | 7558 | 7572 |
| 4 | pH | 6.5 | 6.4 | 6.4 | 6.5 |
| 5 | Spreadability (gm.cm/sec) |
14.7 | 14.8 | 14.7 | 15.1 |
| 6 | Drug content (%) | 94.27% | 94.18% | 94.09% | 94.22% |
Table 15: stability of optimized formulation F1.
Conclusion
Tizanidine hydrochloride was successfully formulated in the form of microemulgel by using microemulsion with carbopol 934 and Hpmc k 100 m as gelling agent. Microemulsions were prepared by varying Tween 80 and isopropyl alcohol concentration in five emulsions. And ME-5 was selected as optimized emulsion based on surface area distribution of globules (MA), and physical stability. ME-5 showed globule area of 198.8 nm. ME-5 showed good physical stability. Microemulgel was prepared by incorporation of ME-5 emulsion in formulation F1, F2, F3, F4, F5, F6, F7 F8 and F9 respectively. The prepared microemulgel was pleasant in appearance and showed drug content ranged from 94.27 ± 1.838 to 75.21 ± 0.372%. pH of all the formulations was within a range of 5.5 to 6.5 which is in accordance with skin pH indicating compatibility with skin. The viscosity of all formulations ranged from 7585 to 9516 cps. All formulations showed pseudoplastic behavior. Spreadability values ranged from 13.2 to 14.7gm.cm/sec. All the formulations belong to fluid gel category. The percentage cumulative drug diffusion was found to be in the range of 8.50±0.540 to 97.36 ± 1.415 % after 8 hr. F1 formulation was selected as optimized formulation based on physical appearance, drug content, viscosity ,pH, spreadability.
References
- Singh J, Roberts MS (1998) Transdermal delivery of drugs by iontophoresis: a review. Drug design and delivery. 4(1):1-2.
- Barrett DA, Rutter N (1994) Transdermal delivery and the premature neonate. Critical reviews in therapeutic drug carrier systems. 11(1):1-30.
- Rizwan M, Aqil M, Ahad A, Sultana Y, Ali MM (2008) Transdermal delivery of valsartan: I. Effect of various terpenes. Drug develop indust pharm. 34(6):618-26.
- Merkle HP (1989) Transdermal delivery systems. Methods and findings in experimental and clinical pharmacology. 11(3):135-53.
- Ramesh P (1997) Transdermal delivery of drugs. Ind J Pharmacol. 29(3):140.
- Strey R (1994) Microemulsion microstructure and interfacial curvature. Colloid Poly Sci. 272(8):1005-19.
- Acharya DP, Hartley PG (2012) Progress in microemulsion characterization. Curr Opinion in Colloid Inter Sci. 17(5):274-80.
- Rosano HL, Clausse M, editors. (1987) Microemulsion systems. Crc Press;
- Rosano HL, Clausse M, editors. (1987) Microemulsion systems. Crc Press;
- Pawbake GR, Shirolkar SV. (2020) MICROEMULGEL: A PROMISING APPROACH TO IMPROVE THE THERAPEUTIC EFFICACY OF DRUG. J Crit Review. 7(14):1137-43.
- Ashara KC, Paun JS, Soniwala MM, Chavada JR, Mori NM (2014) Micro-emulsion based emulgel: a novel topical drug delivery system. Asian pacific J Trop dis. 4:S27-32.
- Mehta DP, Rathod HJ, Shah DP, Shah CN (2015) A review on microemulsion based gel: A recent approach for topical drug delivery system. Res J Technol. 8(2):118-26.
- Ashara KC, Paun JS, Soniwala MM, Chavda JR, Mendapara VP, Mori NM (2016) Microemulgel: An overwhelming approach to improve therapeutic action of drug moiety. Saudi Pharm J. 24(4):452-7
- Kumar B, Jain SK, Prajapati SK. Effect of penetration enhancer DMSO on in-vitro skin permeation of acyclovir transdermal microemulsion formulation. Int J Drug Deliv. 3(1).
- Ashara KC, Paun JS, Soniwala MM, Chavada JR, Mori NM (2014) Micro-emulsion based emulgel: a novel topical drug delivery system. Asian pacific J Trop dis. 4:S27-32.
- Mehta DP, Rathod HJ, Shah DP, Shah CN (2015) A review on microemulsion based gel: A recent approach for topical drug delivery system. Res J Technol. 8(2):118-26.
- Malakar J, Sen SO, Nayak AK, Sen KK (2011) Development and evaluation of microemulsions for transdermal delivery of insulin. International Scholarly Research.
- Kumar B, Jain SK, Prajapati SK. Effect of penetration enhancer DMSO on in-vitro skin permeation of acyclovir transdermal microemulsion formulation. Int J Drug Deliv. 3(1).
- TOLE K, Deshmukh G (2018) Design and characterization of microemulsion gel for transdermal drug delivery system of duloxetine hydrochloride .Asian J Pharm Clin Res 11(11):157-61.
- Zhu W, Guo C, Yu A, Gao Y, Cao F, Zhai G (2009) Microemulsion based hydrogel formulation of penciclovir for topical delivery. Int J Pharm 378(1-2):152-8.
- Patel MR, Patel RB, Parikh JR, Patel BG (2016) Novel isotretinoin microemulsion-based gel for targeted topical therapy of acne: formulation consideration, skin retention and skin irritation studies. Applied Nanoscience. 6(4):539-53.
- Mutalik S, Parekh HS, Davies NM, Nayanabhirama U (2009) A combined approach of chemical enhancers and sonophoresis for the transdermal delivery of tizanidine hydrochloride. Drug delivery. 16(2):82-91.
- Jagdale S, Chaudhari B (2017) Optimization of microemulsion based transdermal gel of triamcinolone. Recent patents on anti-infective drug discovery. 12(1):61-78.
- Shaik NB, Mortha SD, Lakshmi PK, Kukati L (2020) Formulation and evaluation of tizanidine hydrochloride loaded ethosomes for transdermal delivery. J Pharm Sci Res 12(11):1400-10.
- Shrestha S, Pokhrel S, Sharma S, Manandhar M, Alam I (2017) Formulation and evaluation of topical microemulgel loaded with terbinafine HCl microemulsion. Int J Pharm Sci Res 8(11):4716-23.
- Sarafian G, Afshar M, Mansouri P, Asgarpanah J, Raoufinejad K, Rajabi M (2015) Topical turmeric microemulgel in the management of plaque psoriasis; a clinical evaluation. Iran J Pharm res IJPR 14(3):865.
- El Nagar MH, Mahdy M, Selem M, El Maghraby G (2016) Transdermal delivery of kojic acid from microemulgel. J Appl Pharm Sci 6(03):008-1
- Yang C, Shen Y, Wang J, Ouahab A, Zhang T, Tu J. Cationic polymer-based micro-emulgel with self-preserving ability for transdermal delivery of diclofenac sodium. Drug delivery. 2015 Aug 18;22(6):814-22.
- Sriarumtias FF, Najihudin A, Putri IR, Akmal A, Hamdani S (2019) Microemulgel formulation of Kepok banana peel extract (Musa paradisiaca L) as an antioxidant. InJournal of Physics: Conference Series (Vol. 1402, No. 5, p. 055090). IOP Publishing.
- Wagstaff AJ, Bryson HM. Tizanidine (1997) A review of its pharmacology, clinical efficacy and tolerability in the management of spasticity associated with cerebral and spinal disorders. 53(3):435-52.
- Prasad R, Koul V, Anand S, Khar RK (2007) Effect of DC/mDC iontophoresis and terpenes on transdermal permeation of methotrexate: In vitro study. Int J Pharm 333(1-2):70-8.
- Fouad SA, Basalious EB, El-Nabarawi MA, Tayel SA (2013) Microemulsion and poloxamer microemulsion-based gel for sustained transdermal delivery of diclofenac epolamine using in-skin drug depot: in vitro/in vivo evaluation. International journal of pharmaceutics 453(2):569-78.
- Dandagi PM, Pandey P, Gadad AP, Shivamurthy V (2020) Formulation and Evaluation of Microemulsion Based Luliconazole Gel for Topical Delivery. INDIAN JOURNAL OF PHARMACEUTICAL EDUCATION AND RESEARCH 54(2):293-301.
- Jagdale SC, Deore GK, Chabukswar AR (2018 ) Development of microemulsion based nabumetone transdermal delivery for treatment of arthritis. Recent patents on drug delivery & formulation. 12(2):130-49.
- Fonseca VR, Bhide PJ, Joshi MP (2019) Formulation, Development and Evaluation of Etoricoxib Nanosize Microemulsion Based Gel for Topical Drug Delivery. INDIAN JOURNAL OF PHARMACEUTICAL EDUCATION AND RESEARCH 53(4):S571-9
- Lataste X, Emre M, Davis C, Groves L (1994 ) Comparative profile of tizanidine in the management of spasticity. Neurology. 44(11 Suppl 9):S53-9
- Prasad R, Koul V, Anand S, Khar RK (2007) Effect of DC/mDC iontophoresis and terpenes on transdermal permeation of methotrexate: In vitro study. Int J Pharm 333(1-2):70-8.
- Beard SM, Hunn A, Wight J. Treatments for spasticity and pain in multiple sclerosis: a systematic review.
- Fouad SA, Basalious EB, El-Nabarawi MA, Tayel SA (2013) Microemulsion and poloxamer microemulsion-based gel for sustained transdermal delivery of diclofenac epolamine using in-skin drug depot: in vitro/in vivo evaluation. International journal of pharmaceutics 453(2):569-78.
- Wade A, Weller PJ (1994) Hand book of pharmaceutical excipients. 2nd edition; Pharmaceutical Press.
- Yazicioglu D, Caparlar C, Akkaya T, Mercan U, Kulaçoglu H (2016) Tizanidine for the management of acute postoperative pain after inguinal hernia repair: A placebo-controlled double-blind trial. European Journal of Anaesthesiology| EJA 33(3):215-22.
- Malanga G, Reiter RD, Garay E (2008) Update on tizanidine for muscle spasticity and emerging indications. Expert opinion on pharmacotherapy 9(12):2209-15.
- Shabbir M, Sajid A, Hamid I, Sharif A, Akhtar MF, Raza M, Ahmed S, Peerzada S, Amin MU (2019) Influence of different formulation variables on the performance of transdermal drug delivery system containing tizanidine hydrochloride: in vitro and ex vivo evaluations. Braz J Pharm Sc. 8;54.
- Kumar R, Katare OP (2005) Lecithin organogels as a potential phospholipid-structured system for topical drug delivery: a review. Aaps Pharmscitech 6(2):E298-310.
- Sujatha K, Chitra K, Hettiarachchi DS, Krishna MV, Vasantha J (2003) Spectrophotometric determination of tizanidine hydrochloride. Ind J Pharm sci 65(5):519.
- Amnuaikit C, Ikeuchi I, Ogawara KI, Higaki K, Kimura T (2005) Skin permeation of propranolol from polymeric film containing terpene enhancers for transdermal use. Int J Pharm289 (1-2):167-78.
- Trotta M, Morel S, Gasco MR (1997) Effect of oil phase composition on the skin permeation of felodipine from o/w microemulsions. Die Pharmazie 52(1):50-3.
- Moghimipour E, Salimi A, Eftekhari S (2013) Design and characterization of microemulsion systems for naproxen. Advanced pharmaceutical bulletin 3(1):63.
- Kawakami K, Yoshikawa T, Moroto Y, Kanaoka E, Takahashi K, Nishihara Y, Masuda K (2002) Microemulsion formulation for enhanced absorption of poorly soluble drugs: I. Prescription design. Journal of Controlled Release 81(1-2):65-74.
- Butani D, Yewale C, Misra A (2014) Amphotericin B topical microemulsion: formulation, characterization and evaluation. Colloids and Surfaces B: Biointerfaces. 116:351-8.
- Kumar A, Kushwaha V, Sharma PK (2014) Pharmaceutical microemulsion: Formulation, characterization and drug deliveries across skin. Int J Drug Dev Res 6(1):1-21.
- Aggarwal N, Goindi S, Khurana R (2013) Formulation, characterization and evaluation of an optimized microemulsion formulation of griseofulvin for topical application. Colloids and Surfaces B: Biointerfaces 105:158-66.
- Francoeur ML, Golden GM, Potts RO (2014) Oleic acid: its effects on stratum corneum in relation to (trans) dermal drug delivery. Pharmaceutical research. 7(6):621-7.
- Barakat N, Fouad E. Enhancement of skin permeation and anti-inflammatory effect of indomethacin using microemulsion. Asian Journal of Pharmaceutics (AJP): Free full text articles from Asian J Pharm 5(3).
- Lee JM, Park KM, Lim SJ, Lee MK, Kim CK (2002) Microemulsion formulation of clonixic acid: solubility enhancement and pain reduction. Journal of pharmacy and pharmacology 54(1):43-9.
- Patel MR, Patel RB, Parikh JR, Solanki AB, Patel BG (2009) Effect of formulation components on the in vitro permeation of microemulsion drug delivery system of fluconazole. Aaps Pharmscitech 10(3):917-23.
- Mei Z, Chen H, Weng T, Yang Y, Yang X (2003) Solid lipid nanoparticle and microemulsion for topical delivery of triptolide. European journal of pharmaceutics and biopharmaceutics 56(2):189-96.
- Baroli B, López-Quintela MA, Delgado-Charro MB, Fadda AM, Blanco-Méndez J (2000) Microemulsions for topical delivery of 8-methoxsalen. J Control Release 69(1):209-18.