Research Article, Ecdr Vol: 5 Issue: 2
Growth Hormone Stimulation Test: Results and Predictive Factors
Al Hassani N1*, Kaplan W2, Oulhaj A3 and Hadi S1
1Department of Pediatrics, Division of Endocrine & Diabetes, Tawam Hospital, P O Box 15258, Al Ain, UAE
2Beacon Medical Group, Memorial Children's Hospital, 100 Navarre Place, Suite 5550, South Bend, IN 46601, USA
3Institute of Public Health, College of Medicine and Health Sciences, United Arab Emirates University, PO Box 17666, Al Ain, UAE
*Corresponding Author : Al Hassani N
Department of Pediatrics, Division of Endocrine & Diabetes, Tawam Hospital, P O Box 15258, Al Ain, UAE
Tel: 0097137074311
Fax: 0097137072731
E-mail: nohassani@seha.ae
Received: June 24, 2019 Accepted: July 13, 2019 Published: July 24, 2019
Citation: Al Hassani N, Kaplan W, Oulhaj A, Hadi S (2019) Growth Hormone Stimulation Test: Results and Predictive Factors. Endocrinol Diabetes Res 5:2.
Abstract
Objective: Growth hormone stimulation test (GHST) has become a standard test in the assessment of short stature. Our objectives are to determine if there are predictive factors for post stimulation growth hormone (GH) level and to assess the correlation between the peak GH level and the first year response to treatment.
Method: It is a descriptive retrospective study of 113 subjects with short stature who were admitted to Tawam Hospital, UAE, from January 2010 to May 2016 for GHST, excluding Turner syndrome, small for gestational age or chronic renal insufficiency. The subject’s baseline characteristics as well as labs and imaging were retrieved. All statistical analysis was done using R software version 3.0.3.
Results: Weight (Wt) SDS and insulin like growth factor-1 (IGF-I) were constant significant factors across the different cut-off levels of 10, 7 and 5 ng/ml, with all P vales ≤ 0.01. There was +0.4 (± 0.34) change in the height SDS by the end of first year of GH treatment (P<0.0001) with a significant negative correlation with IGF-1 level (P=0.012) and positive correlation with insulin like growth factor binding protein -3 (IGF-BP3) level (P=0.039).
Conclusion: The normal Wt and low IGF-1 level were constant risk factors for low GH response regardless of the cut-off peak stimulated GH level used, which could be considered as potential predicators of GH status. On the other hand, low IGF-1 and normal IGF-BP3 can predict the GH response during the first year of treatment.
Keywords: Growth hormone stimulation test; Growth hormone deficiency; IGF-1; IGF-BP3; Weight; Growth hormone treatment.
Introduction
The diagnosis of growth hormone deficiency (GHD) in children cannot be made on the basis of abnormal auxological criteria alone as those abnormalities are common in a variety of growth disorders related to different causes [1]. Growth Hormone Stimulation Test (GHST) has become a standard test in the assessment of short stature. However, clinical features, additional biochemical measures and imaging findings often contribute to the decision of performing this test.
GHST is used mainly to differentiate between GHD and idiopathic short stature (ISS) and it might help predicting the potential benefit of GH therapy in some children. The documentation of an insufficient response of GH to at least two separate stimulants is consistent with the diagnosis of GHD. However, the diagnostic cut-off peak of GH concentration varies between 5, 7 and 10 ng/ml [2,3]. Additionally, the cut-off level does not take in consideration the different GH assays, the stimulus, and the variation in response due to gender, age, puberty or BMI [4]. Therefore, many studies demonstrated that GHST lack the precision, accuracy and disease concordance [2,3,5-8]. Consequently, recent guidelines recommend against reliance on GHST result as the sole diagnostic criterion of GHD [9]. Furthermore, GHST is invasive, expensive and in view of its side effects, such as, severe hypoglycemia, is not very safe [10].
Our main two objectives of the study are 1) To determine if there are predictive factors for post stimulation GH level which could substitute the need for GHST in the future, and 2) To assess the correlation between the peak GH level and the first year response to treatment in a cohort of our local patients.
Methods
The present study was approved by Al Ain District Human Research Ethics Committee (Ref: 492/16).
Study subjects and design
This is a descriptive retrospective study of 135 children with short stature who were admitted to the Day Case Unit in Tawam Hospital, UAE, from January 2010 to May 2016 for GHST. Patients with approved indications for GH treatment such Turner syndrome, small for gestational age or chronic renal insufficiency were excluded. Final analysis included 113 subjects.
GHST was done by using two stimulants: oral clonidine (4 mcg/kg, for obese child 150 mcg/m2) and intramuscular glucagon (0.03 mg/kg, maximum 1 mg). Specimens for GH response were collected at baseline, 30, 60, 90 and 120 min post clonidine, and 45, 90, 120, 150 and 180 min post glucagon injection. None of the subjects received sex steroid priming prior to the stimulation test. Patient was considered to have GHD when the peak GH response was below 10 ng/ml.
Retrieved baseline patients characteristics included age, gender, weight (Wt) Standard Deviation Score (SDS), height (Ht) SDS and Tanner stage (Either pre-pubertal or pubertal). In addition, laboratory results of insulin like growth factor-1 (IGF-1), insulin like growth factor binding protein-3 (IGF-BP3), bone age and magnetic resonance imaging (MRI) of the pituitary gland were included. IGF-I and IGF-BP3 levels were considered low if they were below the minimum of the gender and age-matched reference ranges. Similarly, bone age was considered delayed if it was>2SDS behind the chronological age. Ht was reassessed after one year in those who were started on GH treatment, and the difference in Ht SDS from baseline reflects the treatment effect.
Statistical analysis
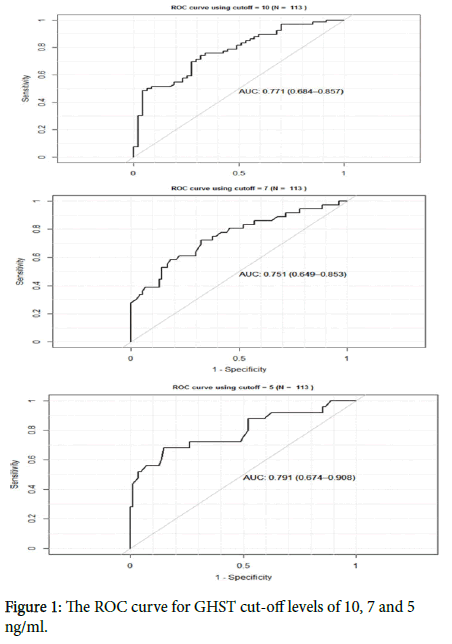
We used a multiple linear regression model with stepwise procedure to identify the set of factors that are significantly associated with peak GH response. We also used a multiple binary logistic regression with stepwise procedure to identify factors that increase the likelihood of deficiency. The latter was defined according to three GHST cut-offs: 10, 7 and 5 ng/ml. For each final binary logistic regression model, a ROC curve and its corresponding area under the ROC curve (AUC) are provided to show the ability of discriminating between deficient and non-deficient subjects. We believe that in this area of research, an AUC over 0.75 indicates a risk tools with a good discrimination power.
To study the effect of treatment defined as the difference between Ht SDS before and after treatment, a paired t-test was carried out. To find out which factors were significantly associated with the treatment effect (i.e. identify good responders), a multiple linear regression with a stepwise procedure where the difference in the test pre and post treatment was considered as the dependent variables was carried out.
All statistical analysis and data manipulation were carried out using the R software version 3.0.3. The “StepAIC” R package was used to perform the stepwise logistic regression for both linear and binary logistic regression models and package “pROC” was used to plot the ROC curves and to compute the AUC. All hypothesis testing were carried out for an alpha=0.05. No adjustment for multiplicity in hypothesis testing was done. We also did not use any method of data imputation. Missing data on covariates and/or on the dependent variable were excluded from the analysis. Baseline demographic and clinical characteristics were compared across gender and other characteristics using a non-parametric test such as the Mann-Whitney U test for continuous and ordinal data and the chi-square and Fisher’s exact test for other type of categorical data.
Results
The demographic and clinical characteristics of the 113 patients included in our study are shown in Table 1 variables are reported as mean (± SD). The age was 11.2 ± 2.6 yrs, 60% were male and 64% were pre-pubertal. Baseline Ht SDS was -2.7 (± 0.6) and Wt was -2.2 (± 1.3). Low IGF-1 level was seen in 44% of the subjects, low IGF-BP3 in 23%, and delayed bone age in 36%. The mean peak GH level in the whole cohort was 10.6 (± 7.6) ng/ml, with difference between males 9.5 (± 6.6) ng/ml and female 12.3 (± 8.8) ng/ml (P=0.072). 64 out of 113 (57%) had a peak GH level of <10 ng/ml and were considered GH deficient.
| Variables | Male n=68 | Female n=45 | Total N=113 |
|---|---|---|---|
| Age (years) | 11.5 ± 2.8 | 10.7 ± 2.3 | 11.2 ± 2.6 |
| Height SDS | -2.7 ± 0.6 | -2.5 ± 0.6 | -2.7 ± 0.6 |
| Weight SDS | -2.3 ± 1.3 | -2.1 ± 1.2 | -2.2 ± 1.3 |
| Tanner stage | |||
| Prepubertal (%) | 47 (65) | 25 (35) | 72 (64) |
| Pubertal (%) | 21 (51) | 20 (49) | 41 (36) |
| IGF -1 | |||
| Low (%) | 33 (66) | 17 (34) | 50 (44) |
| Normal for age (%) | 35 (56) | 28 (44) | 63 (56) |
| IGF-BP3 | |||
| Low (%) | 19 (73) | 7 (27) | 26 (23) |
| Normal for age (%) | 49 (56) | 38 (44) | 87 (77) |
| Bone age | |||
| Delayed (%) | 31 (76) | 10 (24) | 41 (36) |
| Average for age (%) | 37 (51) | 35 (49) | 72 (64 |
| Peak GH level (ng/ml) | 9.5 (± 6.6) | 12.3 (± 8.8) | 10.6 (± 7.6) |
| Peak GH<10 ng/ml (%) | 41 (64) | 23 (36) | 64 (57) |
Table 1: Demographic and clinical characteristics according to gender (mean ± SD).
A simple liner regression analysis showed a positive correlation of the peak GH response with age (P=0.04) and pubertal stage (P=0.001) and a negative correlation with Wt SDS (P=0.002). Surprisingly, there was no correlation with Ht SDS, IGF-1 level, IGF-BP3 level or bone age, however, in multiple liner regression with stepwise procedure analysis, Wt SDS and pubertal stage were the only significant predictors of the peak stimulated GH level (P=0.000, P=0.017 respectively).
With the exception of Wt and IGF-I, other correlating factors to the peak GH level varied between the different cut-off levels of 10, 7 and 5 ng/ml. The odds ratio (of deficiency) for Wt was 1.66 (P=0.010), 1.82 (P=0.003) and 2.54 (P<0.000) at cut-off level of 10, 7 and 5 ng/ml, respectively, while for IGF-1, the odds ratio was 0.20 (P=0.003), 0.26 (P=0.003) and 0.158 (P=0.001) at cut-off level of 10, 7 and 5 ng/ml, respectively. For more details on all selected variables across the three cut-offs please see Table 2.
| Risk Factors | Cut-off 10 | Cut-off 7 | Cut-off 5 | |||||||||
|---|---|---|---|---|---|---|---|---|---|---|---|---|
| OR | P | 2.50% | 97.50% | OR | P | 2.50% | 97.50% | OR | P | 2.50% | 97.50% | |
| Gender | 0.9 | 0.8 | 0.33 | 2.29 | 0.3 | 0 | 0.1 | 0.9 | 0.7 | 0.5 | 0.18 | 2.36 |
| Age | 1.3 | 0.1 | 1.01 | 1.61 | 1 | 0.8 | 0.82 | 1.32 | 1 | 0.8 | 0.73 | 1.28 |
| Ht SDS | 0.7 | 0.4 | 0.3 | 1.55 | 0.8 | 0.7 | 0.35 | 2.06 | 0.6 | 0.4 | 0.22 | 1.75 |
| Wt SDS | 1.8 | 0 | 1.17 | 2.87 | 1.8 | 0 | 1.22 | 2.87 | 2.8 | 0 | 1.72 | 5.07 |
| Tanner stage | 0.2 | 0 | 0.04 | 0.53 | 0.7 | 0.6 | 0.2 | 2.72 | 0.7 | 0.6 | 0.12 | 3.36 |
| IGF-1 | 0.2 | 0 | 0.06 | 0.54 | 0.3 | 0 | 0.095 | 0.69 | 0.2 | 0 | 0.04 | 0.5 |
| IGF-BP3 | 3.2 | 0.1 | 0.99 | 11.6 | 0.9 | 0.8 | 0.29 | 2.64 | 0.9 | 0.9 | 0.26 | 3.73 |
| Bone age | 1.4 | 0.5 | 0.52 | 3.68 | 1.8 | 0.2 | 0.67 | 5.29 | 1.1 | 0.9 | 0.33 | 0.94 |
Table 2: Multiple logistic regression results of all risk factors across all cut-off values.
For each cut-off level, we plotted the ROC curve and provided its corresponding AUC. This helps us to see if the risk factors retained at each cut-off level have a great ability to discriminate between deficient and non-deficient children. From our results, the area under the ROC curve was higher at cut-off level of 5 ng/ml (0.791, 95% CI 0.674-0.908) compared with the one obtained using cut-off 10 ng/ml (0.771, 95% CI 0.684-0.857) and 7 ng/ml (0.751, 95% CI 0.649-0.853) as it is shown in Figure 1.
Out of the total 113 subjects, 53 (47%) had an MRI of the pituitary gland; 10 (19%) showed abnormal pituitary findings (mostly anterior pituitary hypoplasia) while 43 (81%) showed normal MRI. Due to the small number of abnormal MRI subjects, no further analysis on this group done.
Out of the total subjects with GHD and ISS who were started on GH treatment, 71 have completed at least one full year. There was +0.4 (± 0.34) change in the height SDS by the end of year (P<0.0001). Using stepwise multiple regression analysis to select the relevant risk factors for the Ht difference, there was a significant negative correlation with IGF-1 level (P=0.012) and positive correlation with IGF-BP3 level (P=0.039). However, there was no correlation with the peak stimulated GH level and pretreatment Ht SDS (P=0.065 and 0.158, respectively).
Discussion
In this retrospective study, we looked at possible predictor factors of the stimulated peak GH level for patients with short stature, using three different cut-off levels 10, 7 and 5 ng/ml.
Wt and pubertal status were found to be the strongest predictors of the peak GH level. Our finding of negative correlation between the Wt and stimulated peak GH level is similar to other studies [11-14]. Same conclusion was reported by Stanley et al. who suggested that higher BMI SDS, even if it was within the normal range, may lead to over diagnosis of GHD [15]. Provocative GH level in our cohort correlated positively with the pubertal stage, and this is consistent with the findings of multiple previous studies [16-19]. Recent guidelines recommend sex steroid priming prior to provocative GH testing in prepubertal boys older than 11 and in prepubertal girls older than 10 years to prevent unnecessary GH treatment of children with constitutional delay of growth and puberty [9].
We have tested the risk factors to different cut-off levels 10, 7 and 5 ng/ml and we found that normal Wt and low IGF-1 levels were constant risk factors at all the three cut-off values. Therefore, they could be considered as predictors of GH status. The area under the ROC curve was higher at cut-off level of 5 than 10 or 7 ng/ml, which indicates higher sensitivity and specificity; nonetheless, 70% of pediatric endocrinologists use a cut-off of 10 ng/ml to differentiate between GH sufficiency and deficiency [8], we believe that this should be reconsidered.
The available evidence of GH treatment efficacy is derived from response to treatment in the first few years [20-22] as there are no studies that correlate GHST results with the effect of GH treatment on adult height [9]. One of the indicators of a successful first year response to GH treatment is a change in Ht SDS of more than 0.3-0.5 [23]. In our study, Ht has increased by +0.4 (± 0.34) SDS and we found that this change is correlated negatively with IGF-1 level and positively with IGF-BP3. This is similar to the findings of Abali and his colleagues who stated a negative correlation between the first year Ht response and the IGF-1 SDS [24]. However, there was no correlation in our study between stimulated peak GH levels or patient age and the response to treatment after first year, unlike other studies that have indicated a negative correlation between GH peak level, or patient age and the response to treatment [25-28]. The different findings in our study could be due to a different ethnic and geographic cohort, different underlying causes of idiopathic GHD or other cause that need further investigation.
Our study limitations were the small sample size, retrospective design, and absence of a control group. Further studies with larger cohorts and with control groups are required.
Conclusion
We concluded that the normal weight and low IGF-1 level were constant risk factors for low GH response regardless of the cut-off peak stimulated GH level used, which could be considered as potential predicators of GH status. On the other hand, low IGF-1 and normal IGF-BP3 can predict the GH response during the first year of treatment.
References
- Ranke MB (2003) Diagnostics of endocrine function in children and adolescents. Karger 107-128.
- Mauras N, Walton P, Nicar M, Welch S, Rogol AD (2000) Growth hormone stimulation testing in both short and normal statured children: Use of an immunofunctional assay. Pediatr Res 48: 614-618.
- Sizonenko PC, Clayton PE, Cohen P, Hintz RL, Tanaka T, et al. (2001) Diagnosis and management of growth hormone deï¬Âciency in childhood and adolescence Part 1: Diagnosis of growth hormone deï¬Âciency. Growth Horm IGF Res 11: 137-165.
- Chiara Guzzetti, Anastasia Ibba, Sabrina Pilia, Nadia Beltrami, Natascia, et al. (2016) Cut-off limits of the peak GH response to stimulation tests for the diagnosis of GH deficiency in children and adolescents: Study in patients with organic GHD. European J Endocrinol 175: 41-47.
- Rhee N, Young Oh K,Yang E M and Kim CJ (2015) Growth hormone responses to provocative tests in children with short stature. Chonnam Med J 51: 33-38.
- Badaru A, Wilson D M (2004) Alternatives to growth hormone stimulation testing in children. Trends Endocrinol Metab 15: 252-258.
- Rosenfeld RG (1997) Is growth hormone deficiency a viable diagnosis? J Clin Endocrinol Metab 82: 349-351.
- Gandrud L. M and Wilson D M (2004) Is growth hormone stimulation testing in children still appropriate? Growth Horm IGF Res 14: 185-194.
- Grimberg A, DiVall SA, Polychronakos C, Allen D B, Cohen L E, et al. (2016) Guidelines for growth hormone and insulin-like growth factor-I treatment in children and adolescents: Growth hormone deficiency, idiopathic short stature, and primary insulin-like growth factor-I deficiency. Horm Res Paediatr 86: 361-397.
- Duche L, Trivin C, Chemaitilly W, Souberbielle J C, Breart G, et al. (2008) Selecting short-statured children needing growth hormone testing: Derivation and validation of a clinical decision rule. BMC Pediatrics 8: 29.
- Misra M, Bredella MA, Tsai P, Mendes N, Miller KK, et al. (2008) Lower growth hormone and higher cortisol are associated with greater visceral adiposity, intramyocellular lipids, and insulin resistance in overweight girls. Am J Physiol Endocrinol Metab 295: E385-E392.
- Argente J, Caballo N, Barrios V, Pozo J, Muñoz MT, et al. (1997) Multiple endocrine abnormalities of the growth hormone and insulin-like growth factor axis in prepubertal children with exogenous obesity: Effect of short- and long-term weight reduction. J Clin Endocrinol Metab 82: 2076-2083.
- Kasa-Vubu JZ, Barkan A, Olton P, Meckmongkol T, Carlson NE, et al. (2002) Incomplete modified fast in obese early pubertal girls leads to an increase in 24-hour growth hormone concentration and a lessening of the circadian pattern in leptin. J Clin Endocrinol Metab 87: 1885-1893.
- Lee J, Yoon J, Kang MJ, Lee YA, Lee SY, et al. (2013) Influence of Body Mass Index on the growth hormone response to provocative testing in short children without growth hormone deficiency. J Korean Med Sci 28: 1351-1355.
- Stanley TL, Levitsky LL, Grinspoon SK, Misra M (2009) Effect of Body Mass Index on peak growth hormone response to provocative testing in children with short stature. The J Clin Endocrinol Metab 94: 4875-4881.
- Saggese G, Cesaretti G, Giannessi N, Bracaloni C, Cinquanta L (1992) Stimulated Growth Hormone (GH) secretion in children with delays in pubertal development before and after the onset of puberty: Relationship with peripheral plasma GH-releasing hormone and somatostatin levels. J Clin Endocrinol Metab 74: 272-278.
- Martinez AS, Domene HM, Ropelato MG, Jasper HG, Pennisi PA, et al. (2000) Estrogen priming effect on Growth Hormone (GH) provocative test: A useful tool for the diagnosis of GH deficiency. J Clin Endocrinol Metab 85: 4168-4172.
- Marin G, Domene HM, Barnes KM, Blackwell BJ, Cassorla FG, et al. (1994) The effects of estrogen priming and puberty on the growth hormone response to standardized treadmill exercise and arginine-insulin in normal girls and boys. J Clin Endocrinol Metab 79: 537-541.
- Gonc EN, Kandemir N, Ozon A, Alikasifoglu A (2008) Final heights of boys with normal growth hormone responses to provocative tests following priming. J Pediatr Endocrinol Metab 21: 963-971.
- Cole TJ, Hindmarsh PC, Dunger DB (2004) Growth hormone provocation tests and the response to GH treatment in GH deficiency. Arch Dis Child 89: 1024-1027.
- Wilson DM, Frane J (2005) A brief review of the use and utility of growth hormone stimulation testing in the NCGS: Do we need to do provocative GH testing? Growth Horm IGF Res 15: 21-25.
- Rogol AD, Blethen SL, Sy JP, Veldhuis JD (2003) Do growth hormone (GH) serial sampling, insulin-like growth factor-I (IGF-I) or auxological measurements have an advantage over GH stimulation testing in predicting the linear growth response to GH therapy? Clin Endocrinol(Oxf) 58: 229-237.
- Cohen P, Rogol AD, Deal CL, Saenger P, Reiter EO, et al. (2008) 2007 ISS Consensus Workshop participants. Consensus statement on the diagnosis and treatment of children with idiopathic short stature: A summary of the Growth Hormone Research Society, the Lawson Wilkins Pediatric Endocrine Society, and the European Society for Paediatric Endocrinology Workshop. J Clin Endocrinol Metab Nov 93: 4210-4217.
- Abali S, Bas S, Akbarzade A, Atay Z, Haliloglu B, et al. (2015) Evaluating first year response and final height to growth hormone treatment in growth hormone deficiency based on peak gh levels on testing. ESPE Abstracts 84: 3-969.
- Ranke MB, Lindberg A, Chatelain P, Wilton P, Cutfield W, et al.(1999) Price DA: Derivation and validation of a mathematical model for predicting the response to exogenous recombinant human growth hormone (GH) in prepubertal children with idiopathic GH deficiency. J Clin Endocrinol Metab 84: 1174-1183.
- Bright GM, Julius JR, Lima J, Blethen SL (1999) Growth hormone stimulation test results as predictors of recombinant human growth hormone treatment outcomes: Preliminary analysis of the National Cooperative Growth Study database. Pediatrics 104: 1028-1031.
- Fujieda K, Hanew K, Hirano T, Igarashi Y, Nishi Y, et al. (1996) Growth response to growth hormone therapy in patients with different degrees of growth hormone deficiency. Endocr J 43: S19-S25.
- Savage MO, Bang P (2012) The variability of responses to growth hormone therapy in children with short stature. Indian J Endocrinol Metab 16: 178-184.
 Spanish
  Chinese
  Russian
  German
  French
  Japanese
  Portuguese
  Hindi
Hindi 


