Spanish
  Chinese
  Russian
  German
  French
  Japanese
  Portuguese
  Hindi
Hindi Research Article, J Appl Bioinforma Comput Biol Vol: 6 Issue: 2
Iterative Image Processing for Early Diagnostic of Beta-Amyloid Plaque Deposition in Pre-Clinical Alzheimer’s Disease Studies
Nikolai V Slavine1*, Padmakar V Kulkarni2 and Roderick W McColl3
1Translational Research Department of Radiology, UT Southwestern Medical Center, 5323 Harry Hines Boulevard, Dallas, Texas, USA
2Pre-Clinical Imaging Department of Radiology, UT Southwestern Medical Center, 5323 Harry Hines Boulevard, Dallas, Texas, USA
3Clinical Medical Physics Department of Radiology, UT Southwestern Medical Center, 5323 Harry Hines Boulevard, Dallas, Texas, USA
*Corresponding Author : Dr.Nikolai V Slavine
Translational Research Department of Radiology, UT Southwestern Medical Center, 5323 Harry Hines Boulevard, Dallas, Texas, USA
Tel: 75390-9071
E-mail: Nikolai.Slavine@UTSouthwestern.edu
Received: April 20, 2017 Accepted: May 23, 2017 Published: May 31, 2017
Citation: Slavine NV, Kulkarni PV, McColl RW (2017) Iterative Image Processing for Early Diagnostic of Beta-Amyloid Plaque Deposition in Pre-Clinical Alzheimer’s Disease Studies. J Appl Bioinforma Comput Biol 6:2. doi: 10.4172/2329-9533.1000134
Abstract
Purpose: To test and evaluate an efficient iterative image processing strategy to improve the quality of sub-optimal pre-clinical PET images. A novel iterative resolution subset-based method to reduce noise and enhance resolution (RSEMD) has been demonstrated on examples of PET imaging studies of Alzheimer’s disease (AD) plaques deposition in mouse brains.
Materials and Methods: The RSEMD method was applied to imaging studies of non-invasive detection of beta-amyloid plaque in transgenic mouse models of AD. Data acquisition utilized a Siemens Inveon® micro PET/CT device. Quantitative uptake of the tracer in control and AD mice brains was determined by counting the extent of plaque deposition by histological staining. The preclinical imaging software inviCRO® was used for fitting the recovery PET images to the mouse brain atlas and obtaining the time activity curves (TAC) from different brain areas.
Results: In all of the AD studies the post-processed images proved to have higher resolution and lower noise as compared with images reconstructed by conventional EM methods. In general, the values of SNR reached a plateau at around 10 iterations with an improvement factor of about 2 over sub-optimal PET brain images.
Conclusions: A rapidly converging, iterative deconvolution image processing algorithm with a resolution subsets-based approach RSEMD has been used for quantitative studies of changes in Alzheimer’s pathology over time. The RSEMD method can be applied to sub-optimal clinical PET brain images to improve image quality to diagnostically acceptable levels and will be crucial in order to facilitate diagnosis of AD progression at the earliest stages.
Keywords: Alzheimer’s disease; Beta-amyloid plaque; Transgenic mice model; Resolution subsets-based iterative method; Rapid converging; SNR improvement; Sub-optimal PET brain image recovery
Introduction
Alzheimer’s disease (AD) is a progressive brain disorder and remains with no known cause or cure [1,2]. The principal neuropathological features of AD are amyloid plaques and neurofibrillary tangles which are associated with brain dysfunction and contain beta-amyloid peptides (AP) [3]. Genetic studies show that all mutations that cause AD are closely related to amyloid precursor protein metabolism into AP. This strongly suggests that beta-amyloid deposition is an early and specific event in the pathogenesis of AD [4,5].
The development of radio-pharmaceuticals for AD medical imaging with PET/CT is a promising non-invasive methodology to enable early diagnosis, monitor AD progression and evaluate drug therapies in symptomatic patients. Clinical trials in AD patients have been reported [6-10] with several PET radiotracers indicating that detecting amyloid plaques in living brain with these imaging agents is very promising to clarify the onset and progression of amyloid plaques distribution. For example, the highest PIB [7] binding was observed in the frontal lobes, which was never predicted from postmortem studies. This is a great illustration how in vivo imaging might expand our knowledge about plaque deposition. Deposition of amyloid plaque protein is intimately associated with the presence of transition metal ions such as Cu2+ and Zn2+ [11]. Hydroxy Quinoline and its derivatives are under investigation for therapeutic applications based on extraction of metal ions and disaggregation of plaque [10,11]. Kinetically slow re-extraction of Zn could be useful potentially in imaging amyloid plaque using transition metal chelating agents.
The development of novel radiotracers for in vivo imaging betaamyloid plaques now is an active area of AD studies [12-14]. A novel series of benzofuran derivatives as potential PET radiotracers targeting amyloid plaques in Alzheimer’s disease were synthesized and evaluated in [5]. Radio-labeled ligands have been developed to enable amyloid plaques to be visualized by PET, and this has been successfully accomplished in humans. It is very important to develop and verify clinical PET imaging methods to follow in time brain changes in AD in individual subjects.
Anti-amyloid therapies that are currently being investigated would greatly benefit from development of methods for the in vivo detection and quantitation of beta-amyloid deposits in the brain. Towards this goal a number of scientific groups [5-10] have worked to develop radio-labeled ligands that bind beta-amyloid plaques, in an effort to visualize those plaques in living patients. The fourdimensional (space+time) images of Alzheimer’s disease in transgenic mice made possible by optimal imaging methods will allow us to better characterize the status of the disease and quantitatively evaluate its extent, as well as follow its progress or regression during and after treatment.
The reconstruction algorithm is an important component of any PET scanner. The most common iterative methods employed for PET image reconstruction are the Maximum Likelihood-Expectation Maximization (MLEM) [15], One-Pass List-Mode high resolution algorithm with System Matrix modeling (OPLEM) [16], Algorithm with Resolution Deconvolution (EMD) [17] and Ordered-Subsets EM iterative algorithm (OSEM) [18] and modifications. According to the existing standard procedures, PET images are reconstructed from projection data. The commercial Inveon® micro PET/CT device image reconstruction technique is based on the iterative 3D/2D OSEM method [19].
The immediate purpose of this study was to evaluate and test a novel rapidly converging iterative deconvolution method with the resolution subsets-based approach (RSEMD) [20] for already binned data (such as images from Inveon® PET or clinical PET scan). The RSEMD operates on Digital Imaging and Communications in Medicine (DICOM) images and can be employed retrospectively to de-noise and improve the quality of the PET images previously reconstructed with the OSEM or other conventional EM method.
Materials and Methods
We have succeeded in developing specific molecular imaging agents that cross the blood brain barrier rapidly and wash away from normal mice brains, and have a higher retention in AD mice brains (Figure 1). A novel radiotracer based on fluorinated 18 F-Hydroxy Quinolone (18 F-HQ) that specifically [21-23] as a highly sensitive and specific PET tracer for imaging amyloid plaques expressing elevated levels of metal ions. Double transgenic mice with double mutation (APP/PS1) for Alzheimer’s disease were used as the preclinical AD model. This particular model corresponds to a form of early onset of disease and expresses mutant human presenalin 1 (DeltaE9) and a chimeric mouse/human amyloid precursor protein ([21,22]).
PET/CT imaging
Imaging studies of plaque deposition were acquired from Siemens Inveon® micro PET/CT device [19] (Siemens Medical Solutions Inc., Knoxville, TN, USA). Total CT scan time was approximately 6 minutes. The PET imaging was acquired directly following the acquisition of the CT data. The tissues examined include the brain and muscle. The resulting quantitative data was expressed in percent Injected Dose per gram (% ID/g). Radiotracer was injected intravenously (50-90 μCi) via the tail vein. Immediately following the injection a 20 minute dynamic scan was performed. PET images with dynamic framing every 60 seconds were reconstructed using 2D/3D OSEM algorithm [18,24] and with a Maximum a Posteriori Method (MAP) [25]. For quantitative results, regions of interest (ROI) were placed in the areas expressing the highest activity as determined by visual inspection. After imaging studies, mouse brains were removed, fixed and brain tissue sections were stained with an antibody specific to beta-amyloid peptide.
Preliminary experimental results
In the study [21] control and transgenic AD mice ages 6, 12 and 15 months were imaged for 20 min starting immediately after IV administration of the radiotracer. Time activity curves (TAC) were generated for cortex and cerebellum. Initial uptake of the compound in the mouse brain was highly avid (8-10% ID/g) within less than a minute. Washout from the control mouse brain was very rapid; less than 20% of the compound was retained in the brain after 5 min. AD double transgenic mice had initial rapid brain uptake and had slower washout of the tracer. Activity in the brain as a function of time was expressed by a double exponential function (Figure 1).

Figure 1: A plot of the percent radioactivity retained in the brain of mice ages 6, 12 and 15 months injected with 18F-HQ as function on time. The time activity curves were generated for cortex and cerebellum.
In a next separate study [22], a control and two AD mice were injected with the 18F-HQ radioactive tracer. After 5 min of injection, PET+CT ex-vivo images of the heads were obtained for 15 min (Figure 2). After imaging studies, animal brains were taken out, fixed and brain and olfactory tissue sections were stained with an antibody specific to AP. Localization of the 18F-HQ tracer in the hippocampus region was observed; 3.5 minutes post injection of the tracer in AD mouse brain whereas the tracer had washed out from the control mouse brain. AD transgenic mice had initial high brain uptake and had slow washout of the tracer similar as shown on previous study (Figure 1). Quantitative uptake of the 18F-HQ tracer in control (Figure 3A) and two AD mice brains (Figure 3B, 3C) was measured by counting the extent of plaque deposition by histological staining. The plaque areas, intensity and percentages of the total area were quantitatively and automatically measured by image processing and analysis software. Immuno-histology confirmed the presence of plaques in cortex and olfactory bulbs in both AD mice (Figure 3).

Figure 2: Ex-Vivo Inveon® PET+CT transversal (left), coronal (center) and sagittal (right) images of heads for control WT and two AD transgenic mice injected with 18F-HQ. Mice were sacked 5 min PI and imaged for 15 min. After imaging studies, animal brains were taken out, fixed and brain and olfactory tissue sections were stained with an antibody specific to beta-amyloid peptides.

Figure 3: Ex-Vivo PET+CT images (top row) of control WT (a), transgenic mice AD1 (b), AD2 (c)corresponding immunohistology for beta-amyloid plaques (bottom row). Animals were sacked 5 min PI of 18F-HQ radioactive tracer and imaged for 15 min.
EM based iterative reconstruction
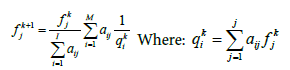
PET image reconstruction technique is based on the simple iterative back projection MLEM method [15]. The list-mode EM algorithm iterates the unknown activity value fkj of voxel j (image is assumed to be discretized into j voxels) for each iteration step k
 (1)
(1)
Where fk+1k and fkj are the voxel values for the new and old image estimates, qki is the expected count in Line of Response (LOR) i for the intensity estimate fkj , I is the number of all possible system LORs and aij represents the probability that an emission from voxel j will be detected along LOR i. The measured data consist of a list of M LOR definitions with implicitly equal to 1 for each acquired LOR. The normalization factor  includes all possible measurable LORs.
Without the implementation of corrections for the resolution effects, the resulting MLEM image is noisy and has poor resolution. In order to take into account the most of possible resolution-limiting effects, the matrix of probabilities  in equation (1) has to be decomposed into a product of three matrices A =WXH [16,17], where W is the diagonal matrix of weighted factors for geometric sensitivity correction accounting for detector rotation, X is a matrix whose elements correspond to the intersection length of LOR i with the voxel j and H is a square matrix which accounts for resolution effects. The blurring component H of the system matrix can be represented as a set of shift-invariant kernels
  then resolution blurring will be invariant across the image. The resolution kernel can be chosen as a Gaussian function with standard deviation
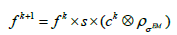
  as the parameter. So, the EM algorithm with resolution system modeling in the nonnegative space using the convolution technique can be written in vector form:
 (2)
(2)
Where s is the sensitivity correction factors and ck contains the multiplicative image correction values (more details in [17]), ⊗ denotes convolution procedure.
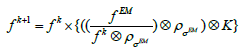
The algorithm described by (2), even using data subsets, and especially for high amounts of list-mode data, requires many more iterations than the standard EM method. To increase the reconstruction time savings, the image iterative deconvolution procedure with regularization EMD was developed [17] and evaluated using:
 (3)
(3)
Where  the images is obtained after conventional EM reconstruction is the resolution (the same as in Eq.2) and is the additional smoothing kernel to reduce the image noise
RSEMD iterative method
Instead of performing the iterative procedure with subsequent post filtering (3), we model the uncertainty caused in the system as an iterative deconvolution with resolution subsets to de-noise and enhance image resolution. This efficient extension of the EMD algorithm [17] iterates the blurred image with different resolution parameters σ (to maximize SNR) and a corresponding number of iterations nσ for each subset are taken in turn (Figure 4). Note that the original brain PET image is never revisited after the first iteration.
The proposed RSEMD deconvolution algorithm starts by iterating the initial PET image  with kernel
  (initial subset
 for each step in the iteration,
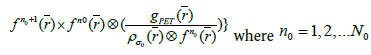 4(a)
4(a)
After N0 iterations when the SNR reaches a plateau, the algorithm continues to iterate the resulting image value associated with initial subset  with next kernel
  (current subset
  for each step in the iteration,
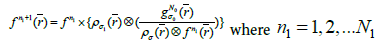 (4b)
(4b)
Finally, to obtain the desired image quality, the algorithm iterates the image value  with the kernel
 (final subset
  for each step in the iterations
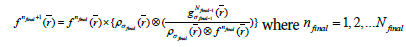 (4c)
(4c)
Where  is the initial PET image after conventional EM reconstruction (OSEM) with all of resolution corrections included and
 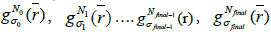 are current image updates after a blurring with different kernel parameters
 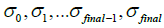 and iteration numbers
 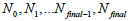 for each subset
  ρ respectively. During the iteration procedure (4) the SNR is checked in each iterative step and this process can be repeated until the deblurring restoration reaches the highest SNR with
  , where parameter ξ can be set as a small fraction of the initial
  . The second parameter is an initial deblurring parameter (width) σ0 .The RSEMD algorithm converges more rapidly if the resolution width σ0 is larger than the EM (OSEM) reconstruction width
  (Eq. 2) while the average value of all deconvolution kernels width
 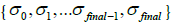 will approach the value. This hypothesis works very well. The permissible range of the resolution parameter σ0 for the RSEMD image enhancement can be estimated from the previous EM (OSEM) reconstruction step and from data acquired in PET quality assurance tests. The optimal number of total iterations depends on image content, the level of noise, pixilation and can be estimated through digital and experimental phantom studies. For most PET pre-clinical cases the total number of iterations
 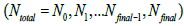 for optimal image quality is around 10 with a total number of resolution subsets around 3. The flowchart description of PET brain image enhancement with RSEMD is shown in Figure 4. The RSEMD method can be considered as an extended Richardson-Lucy deblurring algorithm [26,27] with multiple resolution levels (resolution subsets).

Figure 4: Flowchart description of post-processing DICOM PET images with RSEMD iterative recovery method following conventional EM (OSEM) reconstruction.
Results
Application of the RSEMD algorithm reduced PET image noise and preserved important image features: no additional artifacts are observed. In general, values of SNR reached a plateau after approximately 10 iterations with an improvement factor of about 2 in noise reduction for post-processed PET images.
Starting from Inveon® PET DICOM imaging data (Figure 5a) , around 10 RSEMD iterations with a total number of resolution subsets around 3 will be enough to obtain an appropriate quality image with enhanced image resolution and reduced SNR (Figure 5c), enhance reconstruction time savings and thus reduce otherwise expensive Inveon® micro PET/CT image processing charges.

Figure 5: Coronal slice through 3D brain image recovery (PET only on Figure 3) for the mice AD1 (top) and AD2 (middle) with Inveon® default setting 4 OSEM + 18 MAP (a), coronal slices through 3D image recovery after additional 5 RSEMD iterations (b) and after 10 RSEMD iterations (c) Visual inspection confirms (bottom row) the spatial resolution and noise reduction improvements using the RSEMD method (c). The voxel size is 0.796 mm 3 .
Figure 5 shows the improvement in spatial resolution and noise reduction (about 2 times in average) when the RSEMD image recovery method is applied after Inveon® PET 3D OSEM reconstruction. Coronal slices through 3D PET image reconstruction for the mice AD1 (top) and AD2 (middle) are presented in Figure 5: reconstruction with Inveon® Research Workplace (IRW) default setting 4 OSEM + 18 MAP (Figure 5a), coronal slices through 3D image recovery after additional 5 RSEMD iterations (Figure 5b) and after 10 RSEMD iterations (Figure 5c). Visual inspection confirms (bottom row) the spatial resolution and noise reduction improvements using the RSEMD method. The final images after RSEMD recovery (Figure 5c) look much closer to the original images (Figure 3b and Figure 3c) than reconstructed with Inveon® PET default setting (compare with Figure 5a on the top and Figure 5a on the middle).
Ex-vivo images of AD mice had enhanced tracer uptake in cortex and hippocampus and olfactory bulbs compared to cerebellum and there were no differences in control mice. Immuno-histology confirmed the presence of plaques in cortex and olfactory bulbs in both AD mice (Figure 3 bottom). Further analysis with a brain segmental mapping analysis software inviCRO® [28] (Figure 6, both graph and table) confirms the enhanced tracer uptake in cortex and hippocampus compared to cerebellum. The table columns contain volume and activities for each region of the brain over PET time frames.

Figure 6: AD mouse brain multi-segmental mapping analysis (both graph and table) with inviCRO® imaging software confirms the enhanced tracer uptake in cortex and hippocampus compared to cerebellum. The table columns contain volume and activities for each region of the brain over PET time frames.
As demonstrated, the RSEMD algorithm performs well and can be employed retrospectively on DICOM pre-clinical images with brain segmentation software. In order to optimize the image processing procedure, MATLAB® based software within a multi-modality image handling environment [29] was developed. Figure 7 shows an efficient image processing scheme from PET data acquisition to obtaining the final high quality results based on RSEMD iterative method. Note, RSEMD image enhancement software can be easily supported by off-the-shelf operating system hardware (Intel NUC® processor for example) which could be implemented as the image processing cycle.

Figure 7: Flowchart description of optimal 3D image recovery processing with RSEMD to improve the quality of sub-optimal pre-clinical brain PET images.
Summary
1. The data indicate the possibility of measurements of mice brain regional uptake and washout of 18F-HQ tracer kinetic studies. The uptake ratios increased with age of the animals (Figure 1).
2. Presence of plaques in cortex and olfactory bulbs confirmed by histopathology could be imaged in AD mice (Figure 3).
3. These promising results warrant further evaluation of 18F-HQ derivatives as imaging agents for early detection of amyloid plaque deposition in AD brain [30].
4. The results of these example studies of quantitative detection of beta-amyloid plaques deposition in AD mouse brain clearly show a perfect practical ability of RSEMD method (Figure 4) for PET preclinical image enhancement and possible clinical applications (Figure 5).
5. The inviCRO® imaging software was used successfully for mouse brain segmentation to determine activities for each region of the brain over PET time frames (Figure 6).
6. An original iterative deconvolution scheme to enhance resolution and noise reduction in brain PET imaging has been designed (Figure 7).
7. Inveon® PET/CT imaging device used in the study has some limitations in detecting small disease foci and in assessing plaque burden quantitatively with high resolution and low SNR (Figure 8).

Figure 8: Coronal slice through 3D image reconstruction for AD brain mouse injected with 18F-HQ with Inveon® IRW default setting 4 OSEM + 18 MAP (~10 min) (a), with 100 OSEM + 100 MAP and resolution parameter =1.5 mm (~2.5 h) (b), with 100 OSEM + 100 MAP iterations with and resolution parameter =1.1 mm (~ 2.5 h) (c) and with additional 10 RSEMD iterations (d). The Inveon® IRW OSEM 3D reconstruction algorithm convergence is too slow and without visible improvements. The visual inspection confirms the spatial resolution and SNR improvement using the RSEMD method (d). The voxel size is 0.796 mm 3 .
Discussion
All our imaging studies of plaque deposition were obtained from a commercial Siemens Inveon® micro PET/CT device. However, this state-of-the art imaging device used in preliminary studies has some limitation in assessing plaque burden quantitatively. The Inveon® PET delivers (vendor declared) 1.4 mm FWHM (Full-Width at Half- Maximum) at center of Field of View (CFOV) [19,31].
A big disadvantage also is that reconstruction time to obtain good quality images in 3D is long (a few hours) because OSEM 3D reconstruction algorithm convergence is too slow (Figure 8). A limitation for number of iterations 4 OSEM iterations and the following 18 MAP iterations (4 OSEM+18 MAP) has been recommended as standard default for most of research studies. Systematic investigation of spatial resolution and sensitivity of this Inveon® PET scanner was presented [31]: tangential FWHMs were measured 1.5 mm in the CFOV and 1.8 mm at the edge, but radial FWHMs were 1.5 mm in the CFOV and 3.0 mm at the edge. Average resolution was founded 11.6 +/- 0.06 mm.
In a preliminary investigation the time activity curves for plaques were generated using whole brain activity. The Inveon® Acquisition Workplace (IAW) software was not able to reach satisfactory discrimination to identify precisely the ROIs of the AD lesions.
Figure 8 demonstrates a coronal slice through the 3D image OSEM/MAP reconstruction for AD brain mouse with Inveon® IR. Using the default setting 4 OSEM and followed by 18 MAP reconstruction time is about 10 min (Figure 8a); with 100 OSEM + 100 MAP iterations and resolution parameter σ =1.5 mm (Figure 8b, reconstruction time ~ 2.5 h); with 100 OSEM + 100 MAP iterations with resolution parameter σ =1.1 mm (Figure 8c, reconstruction time ~ 2.5 h) and additional 10 RSEMD iterations with resolution parameter σ =1.5 mm (Figure 8d, recovery time ~ 5 min). The Inveon® IRW OSEM 3D reconstruction algorithm convergence is too slow without any visible improvement from 4 to 100 OSEM iterations and is almost independent of the resolution parameter σ (compare Figure 8a and 8c).
To increase the quantitative ability in PET imaging of betaamyloid plaques deposition in AD mouse brain, a more efficient mathematical approach to improve previously reconstructed PET images and enhance tracer concentration analysis in different brain regions has been implemented.
For future improvements the partial volume effect corrections with MRI-based techniques will be added for AD image processing. The Partial Volume Effect (PVE) [32] has been recognized as the principal factor responsible for adverse effects on PET image quality [33,34]. It is one of the important limiting factors in PET quantitative data analysis. Measurements of cerebral features in patients with Alzheimer’s disease using PET are artifactually depressed due to PVE averaging of brain tissue activity with other tissues – e.g. enlarged cerebrospinal fluid (CSF) spaces, bone and scalp [35,36]. This effect is increased in the presence of cortical atrophy. In this case, the cortical activity will be underestimated and sequential studies in small animals as well as clinical studies involving the comparison of patients with AD and healthy subjects will be impaired due to PVE effects. Methods for PVE corrections are therefore essential to avoid artifacts in the results and high noise levels in the reconstructed AD images.
Recent studies found that SUV readings vary on different PET systems [37] and regions of interest [38] can influence quantitative PET study results. Nevertheless, it is necessary to develop better methods of quantitation, capable of providing absolute concentrations of the agents and thus target tissue volume. Combination of PET/ CT with MRI-based techniques will provide a new set of tools [39] for quantitative study of the biology of AD in mouse models of the disease. With these mice the anatomical brain maps generated with MRI will be uniquely useful for any voxel based method of partial volume effect correction to enhance quantitative abilities of AD PET studies.
Conclusion
The quantitative ability of RSEMD method, incorporating an original deconvolution scheme using resolution subsets to maximize SNR, was demonstrated on examples of PET imaging studies of AD plaques deposition in mouse brains. The computations associated with each subset depend on the image update (intermediate image after one or more iterations) from the previous subset’s iteration. When all of the resolution subsets are employed, an image recovery procedure has been performed. In this case an enhanced PET image recovery with RSEMD has shorter processing time than conventional EM (MLEM, OSEM, OPLEM etc.) algorithms. To reconstruct an image with higher resolution it is not necessary to spend time for extra iterations as is required for the deblurring algorithm or any EM (OSEM) method which use one resolution parameter σ for multiple image updates passed through the data (conventional data subsets).
Using the same Inveon® PET/CT device, along with developments in processing the acquired data, using the inviCRO pre-clinical imaging software for fitting the recovered PET image to the mouse brain atlas to obtain the time activity information from different ROIs, we achieved the desired technical level for quantitative studies of changes in Alzheimer’s pathology over time. These improvements will be crucial in order to facilitate diagnosis of AD progression at the earliest stages. We expect that these studies will enhance the assessment of potential AD therapeutic drugs.
The application of this rapid technique to clinical imaging looks very promising for image resolution recovery for clinical PET. RSEMD method can easily be attached to any reconstruction algorithm (FBP, MLEM, OSEM) used in clinical tomography (CT, PET, PEM) to enhance clinical image quality [40]. This is one more advantage of the RSEMD algorithm.
Designing a study to evaluate the performance of the RSEMD as an image recovery method is the next step in determining the clinical utility of this approach.
Acknowledgment
We would like to thank Patrick Thomas, Anjali Gupta and Michael Long for valuable assistance with Siemens Inveon® micro PET/CT image processing. Special thanks to Jocelyn Chafouleas, Pam Curry and Glenn Katz for technical assistance with the data presentation. This work was supported by 1RCAG036308-01 grant from National Institute of Health (NIH), National Institute of Aging (NIA) and the Worsham Foundation, USA. The authors have no conflicts of interest to declare.
References
- Miller G (2009) Alzheimer’s Biomarker Initiative hits its Stride. Science 326: 386-389.
- Hebert LE, Scherr PA, Bienias JL, Bennett DA, Evans DA (2003) Alzheimer’s disease in the U.S. Population: prevalence estimates using the 2000 census. Arch Neurol 60: 1119-1122.
- Shoghi-Jadid K, Small G, Agdeppa E, Kepe V, Ercoli L, et al. (2002) Localization of Neurofibrillary Tangles and beta-amyloid plaques in the brains of living patients with Alzheimer’s disease. Amer J Geriatric Psychiatry 10: 24-35.
- Nordberg A (2007) Amyloid Imaging in Alzheimer’s disease. Curr Opin Neurol 20: 398-402.
- Roney C, Kulkarni PP, Arora V, Bennett M, Antich P, et al. (2005) Molecular imaging of amyloid Beta proteins in a mouse model of Alzheimer’s disease. Molec Imaging 4: 302.
- Kung M, Hou C, Zhi-Ping Zhuang, Zhang B, Skovronsky D, et al. (2002) IMPY: an Improvement thioflavin-T derivative for in vivo labeling of beta Amyloid Plaques. Brain Research 956:202-210.
- Klunk W, Engler H, Nordberg A, Wang Y, Blomqvist G, et al. (2004) Imaging brain amyloid in Alzheimer's disease with Pittsburgh Compound-B. Ann Neurol 55: 306-319.
- Mathis C, Wang Y, Holt D, Huang G, Debnath M, et al (2003) Synthesis and Evaluation of 11C-labeled 6-substituted 2-aryl benzothiazoles as amyloid imaging agents. J Med Chem 46: 2740-2755.
- Ono M, Watanabe R, Kawashima H, Watanabe H, Haratake M, et al. (2009) 18F-labeled Flavones for in vivo imaging of beta-amyloid plaques in Alzheimer’s brains. Bioorg Med Chem 17: 2069-2076.
- Bush A (2008) Drug development based on the metals hypothesis of Alzheimer’s disease. J. Alzheimer’s Dis 15:223-240.
- Morris J, Kimberly A, Quaid K, Holtzman D, Kantarc K, et al. (2005) Role of biomarkers in studies of presymptomatic. J Alzheimer's & Dementia 1: 145-151.
- Verhoeff N, Wilson A, Takeshita S, Trop L, Hussey D, et al. (2004) In-vivo imaging of Alzheimer disease beta-amyloid with [11C] SB-13 PET. Am J Geriatric Psychiatry 12: 584-595.
- Thal L, Kantarci K, Reiman E, Klunk W, Weiner M, et al. (2006) The role of Biomarkers in clinical trials for Alzheimer’s disease. Alzheimer’s disease Assoc Disorder 20: 6-15
- Chang K, Chen C, Lee S, Shen L, Wang H (2009) The synthesis and characterization of 124I-IMPY, a thioflavin-S derivative, in transgenic mouse models of Alzheimer's disease. Appl Radiat and isotopes 67:1397-400.
- Shepp LA, Vardi Y (1982) Maximum likelihood reconstruction for emission tomography. Medical Imaging, IEEE Transactions on 1: 113-122.
- Reader AJ, Ally S, Bakatselos F, Manavaki R, Walledge RJ, et al. (2002) One-pass list-mode EM algorithm for high-resolution 3-D PET image reconstruction into large arrays. Nuclear Science, IEEE Transactions on 49: 693-699.
- Tsyganov EN, Zinchenko AI, Slavine NV, Antich PP, Seliounine SY, et al (2005) Reconstruction Algorithm with Resolution Deconvolution in a Small-Animal PET Imager.Small-Animal Spect Imaging: Springer 1: 163-75.
- Hudson HM, Larkin RS (1994) Accelerated image reconstruction using ordered subsets of projection data. Medical Imaging, IEEE Transactions on 13: 601-609.
- INVEON, no limits on Discovery PA 0808/1.5 Siemens AG (2008) (www.siemens.com/inveon) USA.
- Slavine NV (2011) A Computational Modeling Approach with Resolution Subsets for Fast Image Recovery©. Patent disclosure filed with UT Southwestern Medical Center at Dallas. July 28, UT # 2477.
- Vasdev N, Cao P, van Oosten E, Wilson A, Houle S, et al. (2012) Synthesis and preliminary PET imaging studies of F-18 flouroquinolin-8-ol in transgenic mouse models of Alzheimer’s Disease. Med Chem Comm 3:1228-1238.
- Kulkarni P, Vasdev N, Arora V, Hao G, Slavine NV, et al. (2010) PET Imaging of Alzheimer’s Disease Transgenic Mice with F-18 Labeled 8-hydroxy Quinoline. J Alzheimer’s and Dementia 6: 6-9.
- Slavine NV, Kulkarni P, McColl R, Gupta A, Arora V, et al. (2011) Improved Quantitative Accuracy for Early Diagnosis of Plaque Deposition in Alzheimer’s disease in Transgenic Mice. J Alzheimer’s and Dementia 7:308-309.
- Boellaard R, van Lingen A, Lammertsma A (2001) Experimental and clinical evaluation of Iterative reconstruction (OSEM) in dynamic PET: quantitative characteristics and effects on Kinetic modeling. J Nucl Med 42: 808-817.
- Cheng JC, Shoqhi K, Laforest R (2012) Quantitative accuracy of MAP reconstruction for Dynamic PET imaging in small animals. Med Phys 39: 1029-1041.
- Richardson W (1972) Bayesian-Based Iterative Method of Image Restoration. JOSA 62: 55-59.
- Lucy L (1974) An iterative technique for the rectification of observed distributions. The Astronomical Journal 79: 745-752.
- www.invicro.com.
- Slavine NV, McColl R (2015) Semi-automated Image Processing for Preclinical Bioluminescence Imaging. J Appl Bioinform Comput Biol 4: 1 (PMC 4662418).
- Kulkarni PV, Alhasan M , Chiguru S, Arora V, Slavine NV, et al. (2015) Early detection of Amyloid Plaques in Mouse Models of Alzheimer’s disease by PET with F-18 Hydroxy Quinoline. Austin Journal of Clinical Neurology 2:1-7
- Visler E, Disselhorst J, Brom M, Laverman P, Gotthardt M, et al. (2009) Spatial Resolution and Sensitivity of the Inveon small-animal PET scanner. J Nucl Med 50: 139-147.
- Rousset OG, Yilong M, Evans AC (1998) Correction for Partial Volume Effect in PET: Principle and Validation. J Nuclear Medicine 39: 904-910.
- Soret M, Bacharach S, Buvat I (2007) Partial Volume Effect in PET tumor Imaging. J Nucl Med 48: 93-945.
- Quarantelli M, Berkouk K, Prinster A, Landeau B, Svarer C, et al. (2004) Integrated software for the analysis of brain in PET/SPECT studies with partial volume effect correction. J Nucl Med 45: 192-201.
- Meltzer CC, Zubieta JK, Brandt J, Tune LE, Mayberg HS, et al. (1996) Regional Hypo Metabolism in Alzheimer’s disease as measured by PET after correction for effects of Partial Volume averaging. Neurology 47:44-461.
- Kuntner C, Kesner AL, Bauer M, Kremslehner R (2009) Limitation of small-animal PET Imaging with 1 8 F-FDDNP and FDG for Quantitative Studies in Transgenic Mouse Model of Alzheimer’s disease. Molec Imaging & Biol 11: 236-240.
- Takahashi Y, Otake H, Oriuchi N, Endo K, Mochizuki T, et al. (2007) Variety of SUVs Among Different PET systems in 18F-FDG study. J Nucl Medicine 48: 462P.
- Evilevich V, Eilber F, Tap W, Allen-Auerbach M, Phelps M, et al. (2007) Influence of ROI Definition on the results of FDG-PET studies in patients with sarcomas. J Nucl Medicine 48: 145P.
- Schlemmer H, Pichler B, Weinhard K, Shmand M, Nahmias C, et al (2008) Simultaneous MR/PET imaging of the human brain: feasibility study. Radiology 248:1028-1035.
- Slavine NV, Guild J, McColl RW, Anderson JA, Oz OK, et al (2015) An Iterative Deconvolution Algorithm for Image Recovery in Clinical CT: A Phantom Study. Physica Medica Euro J Med Physics 31: 903-911.