Spanish
  Chinese
  Russian
  German
  French
  Japanese
  Portuguese
  Hindi
Hindi Research Article, J Comput Eng Inf Technol Vol: 13 Issue: 1
Machine Learning Based Yield Prediction System
Om Mane*, Chanthrika RL, Tanvir Mungekar, Preethi Sai Yelisetty, Bindhu Sree and Jaya Subalakshmi R
Department of Computer Science and Engineering, Vellore Institute of Technology, Vellore, India
- *Corresponding Author:
- Om Mane
Department of Computer Science and Engineering,
Vellore Institute of Technology Vellore,
India;
E-mail: ommane1@gmail.com
Received date: 03 May, 2023, Manuscript No. JCEIT-23-97718;
Editor assigned date: 05 May, 2023, PreQC No. JCEIT-23-97718 (PQ);
Reviewed date: 19 May, 2023, QC No. JCEIT-23-97718;
Revised date: 03 July, 2023, Manuscript No. JCEIT-23-97718 (R);
Published date: 10 July, 2023, DOI: 10.4172/2324-9307.1000292
Citation: Mane O, Chanthrika RL, Mungekar T, Yelisetty PS, Sree B, et al. (2023) Machine Learning Based Yield Prediction System. J Comput Eng Inf Technol 12:6.
Abstract
The wild blueberry industry is a significant contributor to the agricultural sector in the northeastern United States. However, unpredictable weather conditions, soil variability, and pest infestations can significantly affect crop yield, leading to losses for farmers and stakeholders. Therefore, the development of precise and credible crop yield prediction models is critical for efficient resource allocation, improved crop management, and effective marketing strategies. Machine learning algorithms, such as decision tree, linear regression, XGBoost, LightGBM, random forest, AdaBoost, histogram gradient boosting, and CatBoost, have shown great potential for crop yield prediction in recent years. These algorithms can analyze large datasets, identify patterns, and create accurate projections, offering farmers with essential insights into the management of crops, future yields, and commercialization. The models developed in this study can enable farmers and stakeholders to make informed decisions about crop planning and resource allocation, improving the efficiency and sustainability of the wild blueberry industry. Additionally, market forecasters can use these models to predict future demand for wild blueberries, aiding in the development of effective marketing strategies. In conclusion, the development of accurate and reliable crop yield prediction models by application of machine learning algorithms holds the prospective to have a big impact on the field of agriculture, particularly for industries such as wild blueberries that are vulnerable to weather variability and other factors.
Keywords: Regression; Decision tree; Extreme gradient boosting; Light gradient boosting machine; Categorical boosting; Adaptive boosting; Histogram gradient boosting
Introduction
The wild blueberry industry is a critical sector in agriculture, providing not only a valuable food source but also economic benefits to farmers and communities. However, like any industry, it faces challenges such as unpredictable weather patterns, pests, diseases, and market fluctuations. To address these challenges and improve the sustainability and profitability of the wild blueberry industry, stakeholders can leverage the power of machine learning algorithms [1]. By analyzing historical data and identifying patterns and trends, these algorithms can provide insights into crop management, future production, and marketing strategies. Identify applicable funding agency here. If none, delete this linear regression is a popular regression approach that models a linear relationship between variables that are both independent and dependent [2]. In the context of the wild blueberry industry, it can be used to predict crop yield based on factors such as weather patterns, soil quality, and irrigation methods. Random forest is an ensemble method for improving model precision and robustness through the integration of numerous decision trees. It can be used to analyze complex relationships between input variables and crop yield, taking into account both linear and nonlinear effects [3]. Decision trees are a popular approach for classification and regression tasks, modeling relationships between input variables and target variable as a tree structure. In the context of the wild blueberry industry, decision trees can be used to discover the elements that most influence crop yield, such as soil pH, precipitation, and infestations of insects [4].
XGBoost and LightGBM are optimized gradient boosting methods that are designed to handle large and complex data sets. They use decision trees as base learners and can achieve high accuracy and speed, as a result, they are suited to evaluating the massive volumes of data generated by the wild blueberry industry in general. AdaBoost is another ensemble method that uses iterative weight adjustments on training samples to combine numerous weak classifiers to build a strong classifier [5]. It can be used to identify the most important factors affecting crop yield and provide recommendations for improving crop management practices. Histogram gradient boosting is a variant of gradient boosting that uses histograms to bin data, reducing computational complexity and enabling the handling of large data sets with high dimensional feature spaces. It can be used to analyze complex relationships between input variables and crop yield and identify the most significant factors affecting crop production [6]. CatBoost is a gradient boosting method designed to handle categorical features with high accuracy and robustness on a wide range of data sets. It can be used to examine the effects of market demand, consumer preferences, and distribution routes on the wild blueberry sector. Algorithms for machine learning, such as random forest, linear regression, decision trees, XGBoost, LightGBM, AdaBoost, histogram gradient boosting, and CatBoost can provide farmers and other stakeholders with better insights into crop management, future production, and marketing. By using these algorithms, we can optimize crop production, improve food security, and contribute to the sustainability of the agricultural industry [7].
Related work
Meshram V, et al. gives a comprehensive examination of the most recent advances in machine learning applications in agriculture, with a focus on their ability to address difficulties encountered throughout the pre-harvest, harvest, and post-harvest stages. Farmers can attain higher precision and effectiveness in their farming practises by employing machine learning in agriculture, resulting in high-quality produce while reducing reliance on human labour. Explains a technique for keeping an eye on soil quality and preventing illnesses that affect cotton leaves. To recognise and categories leaf diseases, the suggested method use artificial intelligence’s regression technique. Authors in propose to create a programme that can identify diseases of cotton leaves [8]. To use this, the user must provide an image, after which we can use image processing to create a digitalized colour image of a diseased leaf, after which we can use CNN to forecast cotton leaf diseases. For the purpose of detecting plant diseases, a thorough multilayer Convolutional Neural Network (CMCNN) is developed. The CMCNN demonstrates its ability to analyse visible symptoms in a variety of leaf images, including those captured in controlled laboratory conditions with plain backgrounds, complex images obtained from real world settings, and images depicting specific disease symptoms or spots [9]. In machine learning techniques have been used to predict the output of mustard crops using soil data in advance. Data from the experimental setup includes soil samples from several Jammu area districts. In this research, five supervised machine learning techniques, namely multinomial logistic regression, naive bayes, Artificial Neural Network (ANN), K-Nearest Neighbors (KNN) and random forest, were employed to achieve the research objectives. Provides a succinct overview of various approaches to the predictions for rice crop disease identification. There are several different techniques for detecting rice illness. We can infer from the results that CNN and PNN obtain accuracy rates of 94.4% and 99.8%, respectively. The goal of is to perform a thorough examination of the use of Machine Learning (ML) methods in the field of soil science, using the Latent Dirichlet Allocation (LDA) algorithm to discover patterns in a large number of text corpora. The major goal is to fill existing research gaps in this domain and acquire insight into publications on ML applications in soil science. The authors of create a predictive model capable of assessing soil fertility, guiding crop planting decisions based on soil fertility, and reliably predicting crop yields using multiple soil properties. For soil categorization and agricultural yield prediction, a variety of machine learning approaches such as random forest, naive bayes, Support Vector Machine (SVM), linear regression, Multilayer Perceptron (MLP), and Artificial Neural Network (ANN) are used. These strategies, when combined, offer precise recommendations for crop selection and cultivation based on projected outcomes, resulting in effective agricultural decisionmaking. Uses NDVI and RGB data collected from a variety of sources, Convolutional Neural Networks (CNNs), a deep learning technique, are used to create a model for crop production prediction UAVs. This study looks at how different properties of Convolutional Neural Networks (CNNs) affect prediction accuracy. The selection of training algorithm, network depth, regularisation technique, and hyper parameter tweaking are specifically explored. Notably, the results show that in terms of CNN architecture performance, RGB data outperforms NDVI data. Provides a succinct review of machine learning (ML) algorithms typically used in precision agriculture, as well as an examination of the implications of AI and Internet of Things (IoT) technologies on smart farm management. Regression algorithms are used to forecast soil characteristics, weather patterns, and agricultural yields. Extreme Learning Machine (ELM) has been discovered as a suitable Machine Learning (ML) method for neural network training in crop production prediction, according to the authors [10]. Better results are produced and the learning process is accelerated. Suggests a system that employs a regression based supervised algorithm to assess the greenhouse system in order to efficiently increase yields by monitoring and controlling greenhouse elements like carbon dioxide, humidity, temperature, and light remotely via IoT using a message query telemetry transport. Examines numerous crop prediction models that recommend the best crops based on the yields of various crops in a certain environment [11]. Several applications, including agricultural yield prediction, disease detection, and irrigation control are highlighted in discussion of the possibilities of employing AI for sustainable precision agriculture. The difficulties of applying AI to agriculture are also mentioned, as well as the necessity of cooperation between farmers, researchers, and technology providers. The authors come to the conclusion that, with backing from policymakers, integrating AI can result in more effective and sustainable practises. Using ML classification algorithms, thoroughly analyzes several wrapper feature selection techniques to identify the optimal crops for a specific parcel of land. The comparative examination of these methods reveals that the recursive feature elimination strategy in combination with the adaptive bagging classifier demonstrates superior performance compared to other techniques [12]. The approach proposed by the authors in analyses previously acquired data using data mining techniques and forecasts the harvest yield using a random forest classifier to recommend the crop with the highest yield for a given environment based on the soil and meteorological variables. Machine learning methods such as Naive Bayes, K-Nearest Neighbors (KNN), and decision trees are employed to analyze a dataset consisting of environmental factors such as rainfall, soil nutrients, temperature, and various costs [13]. The objective is to investigate the relationship between these factors and their impact on the research topic under study. Provides an effective crop recommendation model. Better results than individual models are shown by hybrid classifier models. The first step in is to take a picture of the damaged leaves and upload it to the server. Multiple features are then retrieved from a collection of photos. The system searches for similarities between recovered features and training photos before calculating accuracy level. It is possible to determine a feature’s precise classification with the highest degree of accuracy. The farmer may learn the name of the disease after patterns are found. The detection of illnesses using CNN (Convolution Neural Network) technology is presented in after identifying the illness the treatment for those illnesses involves sending the affected person a mobile phone using a GSM device. Support Vector Machine (SVM) and Extreme Learning Machine (ELM) algorithms, which exhibit error rates as high as 5%. Additionally, the paper delves into the development of a concise convolutional neural network for the classification of tomato plant diseases using leaf images. Some current CNN architectures, including VGG Net, shuffle net, and squeeze net, are utilised as comparative architectures. A squeeze next model is modified by the authors in describes a two step method for extracting disease features from leaves using multi scale convolution kernels. The work introduces squeeze next, a coordinated attention approach. A study that uses real time picture analysis from the internet and the plant village dataset to identify grape and grape leaf illnesses is also described. To address the difficulty, this work employs pre-trained deep learning models, faster R-CNN Inception v2 and Single Shot Detector (SSD) mobilenet v1, as well as the tensorflow object identification API. This study covered proposal to segment damaged plant components in a variety of ways. They developed efficient techniques for base station data verification and decoding [14].
Materials and Methods
Dataset selection
This study employs the wild blueberry pollination model, a spatially explicit simulation model that has been validated using observational and experimental evidence collected in Maine, USA, over the last 30 years [15]. Blueberry production prediction systems necessitate a large amount of information on plant spatial features, bee species composition, and weather variables. Simulation experiments were generated in a multi-step strategy, and simulations on the calibrated blueberry simulation model were performed, and a simulated dataset was acquired. Figure 1 showcases the methodology followed for training the dataset: The major attributes of this dataset were chosen to create eight machine learning based predictive models. The Pearson Correlation features of the dataset is shown in Figure 2.

Figure 1: System architecture of the model.

Figure 2: Pearson correlation of the dataset.
Data preprocessing
Data preprocessing is an important step in preparing the wild blueberry dataset for machine learning. Here are some common preprocessing steps that were applied to the dataset [16].
• Data cleaning.
• Feature selection.
• Feature scaling.
• Encoding categorical variable.
• Splitting the dataset.
• Handling class imbalance.
Feature selection
Feature selection is a crucial step in preparing the wild blueberry dataset for machine learning. Here are some techniques for feature selection in the wild blueberry dataset [17].
• Correlation analysis.
• Recursive feature elimination.
• Lasso regression.
• Principal component analysis.
• Mutual information.
Splitting the data
Splitting the wild blueberry dataset into training, validation, and testing sets is an important step in preparing the dataset for machine learning. The approach to splitting the dataset is as follows.
• Shuffle the dataset.
• Split the dataset.
• Training set.
• Validation set.
• Testing set.
Model selection
The models chosen for predicting the crop yield were linear regression, random forest, decision tree, XGBoost, LightGBM, CatBoost, AdaBoost and histogram gradient boosting as shown in Figure 3.

Figure 3: Hierarchy of machine learning algorithms.
Linear regression: Linear regression is a supervised learning approach for predicting a continuous target variable from one or more input features [18]. It uses a linear equation to model the relationship between the input data and the target variable, with the goal of finding the best fit line that minimizes the difference between predicted and actual values.
Random forest: Random forest is a classification, regression, and other task specific ensemble learning method that combines numerous decision trees to increase accuracy and robustness.
Decision tree: A decision tree is a well-known machine learning technique that is used for classification and regression applications.
XGBoost: XGBoost is a powerful and efficient gradient boosting method that uses decision trees as base learners to handle large and complex datasets with high accuracy and speed.
LightGBM: LightGBM is a machine learning gradient boosting framework noted for its efficiency and speed. It adopts a tree-based ensemble technique, similar to previous gradient boosting approaches, but with a distinct ”leaf wise” tree development strategy that prioritises samples that are most likely to increase the model’s accuracy.
CatBoost: CatBoost is an open source gradient boosting framework that is designed to handle categorical features and provide high accuracy in a relatively short amount of time.
AdaBoost: AdaBoost (Adaptive Boosting) is a binary classification ensemble learning algorithm that combines the outputs of numerous weak classifiers. It trains weak classifiers iteratively on weighted versions of the training data, focusing on incorrectly categorized samples from prior iterations. After every computation, the weights of misclassified samples are increased, allowing AdaBoost to adapt as well as learn from its mistakes [19].
Histogram gradient boosting: Histogram gradient boosting is an algorithm for machine learning which employs decision trees and gradient boosting to produce an effective predictive model.
Implementation
Mean Absolute Error (MAE), Mean Squared Error (MSE), Root Mean Squared Error (RMSE), and R-squared (R2) were utilized to evaluate the performance of the model. These statistics were calculated as follows:
Mean absolute error: Mean Absolute Error (MAE) is a machine learning metric that is often used to assess the accuracy or performance of a model’s predictions. The average absolute difference between planned and actual values is calculated. Mathematically, MAE is calculated as follows:
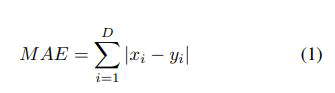
Below x and y are D dimensional vectors, and xi represents the value on x’s ith dimension. MAE represents the average absolute difference between expected and actual values. It is a measure of the size of errors without taking into account their direction. A lower MAE denotes better accuracy and performance, with 0 indicating flawless prediction.
Mean square error: Mean Square Error (MSE) is another machine learning statistic that is often used to assess the accuracy or performance of a model’s predictions. The average squared difference between expected and actual values is calculated. MSE is determined mathematically as follows:
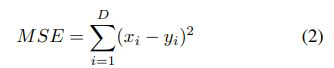
The mean squared difference between expected and actual values is represented by MSE. Squaring the differences magnifies greater mistakes, making MSE more sensitive to outliers than MAE. A lower MSE suggests better accuracy and performance, with 0 indicating flawless prediction.
R-squared: In the context of machine learning, the R-squared (R2) value, also known as the coefficient of determination or, in the case of multiple regression, the coefficient of multiple determination, is used as a measure of evaluation. R2 is employed in regression analysis to assess the dispersion of data points around the fitted regression line and determine the proportion of variation in the dependent variable [20]. It is a widely used statistical metric in the field of machine learning for quantifying the goodness-of-fit of regression models. RSquared can be calculated mathematically as follows:
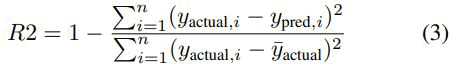
Where, n: Number of samples or data points. yactual,i: Actual values or ground truth in the context of the ith data point. ypred,i: Predicted values by the model in the context of the ith data point. yactual: Mean of the actual values.
It takes on values between 0 and 1, where a value of 0 signifies that the model explains no variance in the dependent variable, while a value of 1 indicates that the model explains all the variance in the dependent variable. A higher R2 value indicates better model performance, with a value of 1 representing a perfect prediction, and therefore the best possible performance.
Results and Discussion
The given data as shown in Figure 4 and Table 1 is the comparison of different machine learning algorithms based on some performance metrics. In the following comparison, the performance metrics, it can be inferred that the first column represents the Mean Absolute Error (MAE) of each algorithm, the second column represents the Mean Squared Error (MSE), the third column represents the Root Mean Squared Error (RMSE), and the fourth column represents the coefficient of determination (R-squared) of each algorithm.

Figure 4: Histogram of the simulation results.
| Algorithms used | Parameters | |||
|---|---|---|---|---|
| MAE | MSE | RMSE | R2 | |
| Random forest | 111.513 | 19606.42 | 140.023 | 0.988 |
| Decision tree | 155.332 | 40653.42 | 201.627 | 0.975 |
| Linear regression | 90.284 | 12892.12 | 113.543 | 0.992 |
| XGBoost | 110.498 | 19756.95 | 140.559 | 0.988 |
| LightGBM | 101.597 | 16724.96 | 129.325 | 0.99 |
| CatBoost | 96.477 | 14572.85 | 120.718 | 0.991 |
| AdaBoost | 158.76 | 38803.8 | 196.987 | 0.976 |
| HistGradient boosting | 101.058 | 16360.62 | 127.909 | 0.99 |
Table 1: Simulation readings.
Based on these performance metrics, linear regression algorithm has the lowest MAE, MSE, and RMSE values of 90.284, 12892.118, 113.543 respectively, indicating that it has the best predictive performance among the algorithms considered. The XGBoost and random forest algorithms also have relatively low error values and high R-squared values, indicating good performance as well. The decision tree and AdaBoost algorithms have the highest error values and lowest R-squared values, indicating poorer predictive performance. The remaining algorithms, including linear regression, light GBM, and histogram gradient boosting, have intermediate error and R-squared values, indicating decent performance but not as good as the top performing algorithms. Based on the evaluation of these metrics, it appears that the linear regression, CatBoost, lightgbm, and histgradientboost models have in terms of accuracy and reliability in predicting the target variable, outperformed all other models.
Conclusion
Agriculture, like many other industries, is undergoing a paradigm transition towards digitalization. This transformation entails collecting and analysing vast amounts of data inside farming operations using wireless technology, robotics, the Internet of Things (IoT), and Artificial Intelligence (AI) networks. Meaningful insights can be gleaned from this massive volume of data using AI algorithms. As previously stated, this project’s primary objective is to accurately evaluate the output of wild blueberry crops. However, in future it is possible to create more accurate models by combining the strengths of multiple models. These hybrid models can be created by combining the algorithms of the best-performing models, or by using an ensemble learning approach that combines the predictions of multiple models.
Acknowledgment
We would want to extend our heartfelt appreciation to Prof. Jaya Subalakshmi R for their guidance and mentorship throughout the research process. And Vellore institute of technology for providing access to necessary resources and facilities to research databases and literature. Finally, we would like to thank the anonymous reviewers for their constructive remarks and ideas, which considerably improved the final text. We are grateful to everyone who contributed to the effective completion of this research.
References
- Meshram V, Patil K, Meshram V, Hanchate D, Ramkteke SD (2021) Machine learning in agriculture domain: A state of art survey. Artif Intell Life Sci 1:100010.
- Murugamani C, Shitharth S, Hemalatha S, Kshirsagar PR, Riyazuddin K, et al. (2022) Machine learning technique for precision agriculture applications in 5G based internet of things. Wirel Commun Mob Comput.
- Kumbhar S, Nilawar A, Patil S, Mahalakshmi B, Nipane M (2019) Farmer buddy web based cotton leaf disease detection using CNN. Int J Appl Eng Res 14:2662-2666.
- Bhagwat R, Dandawate Y (2021) Comprehensive multilayer convolutional neural network for plant disease detection. Int J Adv Comp Sci Appli 12.
- Pandith V, Kour H, Singh S, Manhas J, Sharma V (2020) Performance evaluation of machine learning techniques for mustard crop yield prediction from soil analysis. J Sci Res 64:394-398.
- Padarian J, Minasny B, McBratney AB (2020) Machine learning and soil sciences: A review aided by machine learning tools. Soil 6:35-52.
- Yadav J, Chopra S, Vijayalakshmi M (2021) Soil analysis and crop fertility prediction using machine learning. Mach Learn 8.
- Nevavuori P, Narra N, Lipping T (2019) Crop yield prediction with deep convolutional neural networks. Comput Electron Agric. 163:104859.
- Sharma A, Jain A, Gupta P, Chowdary V (2020) Machine learning applications for precision agriculture: A comprehensive review. IEEE Access 9:4843-4873.
- Suchithra MS, Pai ML (2020) Improving the prediction accuracy of soil nutrient classification by optimizing extreme learning machine parameters. Inf Process Agric. 7:72-82.
- Rokade A, Singh M, Malik PK, Singh R, Alsuwian T (2022) Intelligent data analytics framework for precision farming using IoT and regressor machine learning algorithms. Appl Sci 12:9992.
- Raja SP, Sawicka B, Stamenkovic Z, Mariammal G (2022) Crop prediction based on characteristics of the agricultural environment using various feature selection techniques and classifiers. IEEE Access 10:23625-23641.
- Linaza MT, Posada J, Bund J, Eisert P, Quartulli M, et al. (2021) Data driven artificial intelligence applications for sustainable precision agriculture. Agronomy 11:1227.
- Suruliandi A, Mariammal G, Raja SP (2021) Crop prediction based on soil and environmental characteristics using feature selection techniques. Math Comput Model Dyn Syst 27:117-140.
- Kumar YJ, Spandana V, Vaishnavi VS, Neha K, Devi VG (2020) Supervised machine learning approach for crop yield prediction in agriculture sector. Int Conf Commun Elect Syst 736-741.
- Patil P, Panpatil V, Kokate S (2020) Crop prediction system using machine learning algorithms. Int Res J Eng Technol 7.
- Cynthia ST, Hossain KM, Hasan MN, Asaduzzaman M, Das AK (2019) Automated detection of plant diseases using image processing and faster R-CNN algorithm. Int Conf Sust Techn Indust 1-5.
- Blessy A, Wise DD (2018) Detection of affected part of plant leaves and classification of diseases using CNN technique. Int J Eng Tech 4:823-829.
- Sembiring A, Away Y, Arnia F, Muharar R (2021) Development of concise convolutional neural network for tomato plant disease classification based on leaf images. J Phys: Conf Ser 1845:012009.
- Liu Y, Gao G, Zhang Z (2022) Crop disease recognition based on modified light-weight CNN with attention mechanism. IEEE Access 10:112066-112075.