Research Article, J Pharm Drug Deliv Res Vol: 11 Issue: 1
Monitoring and Validation of Tamoxifen by HPLC/DAD Method Assay
Dridi Ichrak1,2*, Mahrssiya Faouzia2, Zaeid Sonia3,Chadly Zohra1,2, Chaabane Amel1,2, Ben Fadhel Najah1,2, Boughattas A Naceur2, Aouam Karim1,2, Ben Romdhane Haifa1,2, Ben Fredj Nadia1,2
1Service de Parmacologie clinique, CHU Fattouma Bourguiba de Monastir, Département de Pharmacologie, Faculté de Medecine de Monastir, Université de Monastir, Tunisie
2Laboratoire de Pharmacologie, Faculté de Medecine de Monastir, Université de Monastir, Tunisie
3Service d'Oncologie Medical, CHU Fattouma Bourguiba de Monastir
*Corresponding Author:Dridi Ichrak
Service de Parmacologie clinique, CHU Fattouma Bourguiba de Monastir, Département de Pharmacologie, Faculté de Medecine de Monastir, Université de Monastir, Tunisie
Tel: +216 97 66 37 54;
E-mail: dridi.ichrak@yahoo.fr
Received date: 09 December, 2021, Manuscript No. JPDDR-21-50000;
Editor assigned date: 13 December, 2021, Pre QC No. JPDDR-21-50000 (PQ);
Reviewed date: 27 December, 2021, QC No. JPDDR-21-50000;
Revised date: 07 January, 2022, Manuscript No. JPDDR-21-50000 (R);
Published date: 14 January, 2022, DOI:10.4172/2325-9604.1000201
Citation: Ichrak D, et al. (2022) Monitoring and Validation of Tamoxifen by HPLC/DAD Method Assay. J Pharm Drug Deliv Res 11:1.
Abstract
Objective: Tamoxifen (TAM) is the hormone therapy of choice in pre-menopausal estrogen receptor positive breast cancer in women, Therapeutic Drug Monitoring (TDM) of TAM may be clinically useful for guiding treatment decisions to optimize the efficacy and minimize occurrence of effects toxic side of this drug. The object if of this study is to develop and validate a simple chromatographic method for determination of TAM in human plasma.
Keywords: Tamoxifen; High performance liquid chromatography; Breast cancer; Analytical validation; Pharmacokinetic; Therapeutic drug monitoring
Introduction
In the available anticancer therapeutic arsenal, Tamoxifen (TAM) has been used since 1975 in mammary oncology [1]. TAM is indicated for the primary endocrine treatment of advanced breast cancer, as well as an alternative for patients who did not respond to other hormonal therapies. Despite the proven clinical efficacy of TAM, approximately 30% to 50% of patients relapse or eventually die from the disease. In pre-menopausal breast cancer patients especially those under 40 years of age, non-adherence to adjuvant endocrine therapy appears to be a major problem, and evidence suggests poorer survival outcomes in this population by compared to older people, in part due to higher rates of treatment nonadherence [2]. This drug is administered orally, it is rapidly absorbed, reaching a maximal plasma concentration within 4 hrs-7 hrs and reaching a steady state corresponding to 3 to 5 times its half-life after 4 to 6 weeks [3,4]. It then remains at constant levels, and is metabolised by hydroxylation and conjugation, and slowly excreted through the kidneys and intestine it is indicated for five years has been shown to be very effective in reducing breast cancer recurrence and resulting mortality. To this end, several epidemiological and pharmacological data suggest that the quantification of plasma levels of tamoxifen and its metabolites is a relevant tool for the evaluation and monitoring of the state of breast cancer in patients treated with TAM as adjuvant therapy [5,6].
Taking into account the incidence of breast cancer and the inter and intra individual variability of the effect of this treatment, therapeutic monitoring of this drug and its individualized dosage appear advantageous or even necessary and to improve the prognosis of the disease [7,8]. In the present study, we propose to develop and validate a plasma assay method for tamoxifen according to the standards “The International Council for Harmonization of Technical Requirements for Pharmaceuticals for Human Use” (ICH) [9]. Several methods were used for the analysis of tamoxifen such as the LCMS method. An HPLC/DAD method was used for the determination of this agent.
Materials and Methods
Chemicals and reagents
TAM supplied from Sigma-Aldrich is greater than 99% purity. Methanol (Sigma-Aldrich), Ultra-pure water (Sigma-Aldrich), ammonium acetate C₂H₇NO₂ was purchased from SUVCHEM, India. Glacial acetic acid, Dimethyl Sulfoxide (DMSO: Bio Bsiclnc) are of high purity.
Instrumentations
The instrument used is an ultimate 3000 type HPLC device (Thermo scientific). The device is equipped with an automatic injector which guarantees reliable, precise and exact injections (microliters), with extremely low levels of cross-contamination. It has a very compact fill pump (0 bar-400 bar), an ultraviolet/visible diode array detector that measures sample absorbance at wavelengths between 200 nm and 800 nm. This absorption occurs through chromophoric groups which have the capacity to absorb energy from ultraviolet radiation. The device is driven by the Chromeleon 7 software platform offering satisfactory operational simplicity. Besides the HPLC machine, other equipment was used in this work such as the filtration system (GLASSCO) with Wattman® Schleider filter paper, a precision balance (RADWAG) and a PH meter 3510 (JENWAY).
Chromatographic conditions
The chromatographic conditions used for the TAM assay are shown in Table 1. We worked in isocratic mode (only one phase during the entire analysis) (Table 1).
| Column | C18 Dim (150 mm, 4.6 mm ,5 μm) |
| Wave length | 280 nm |
| Debit | 0.3 ml/min |
| Volume injected | 50 µl |
| Analysis time | 15 min |
| Column temperature | 35°C |
Table 1: Chromatographic conditions used for the assay of tamoxifen.
Solutions preparation
Preparation of tamoxifen stock solution: A stock solution is a solution which can be made into daughter solutions by taking a certain volume of it, supplemented by adding a volume of solvent to obtain the desired concentration. The standard stock solution of TAM was prepared by dissolving 0.0050 g of TAM powder in 50 ml of methanol, the concentration obtained is 100 μg/mL This stock solution is protected from light and stored at -20°C until 'to use. Cascading dilutions were made from the stock solution to obtain final concentrations of 4; 2; 1; 0.5; 0.2; 0.1 µg/ml.
Preparation of the mobile phase: The mobile phase is composed of a solution of 2% ammonium acetate in methanol (2 g of C₂H₇NO₂ are dissolved in 100 ml of methanol). This mixture is filtered and then subjected to an ultrasonic bath for 15 min before use. The pH of the mobile phase is adjusted to 6.5 with glacial acetic acid (99:1; V:V).
Extraction procedures: The samples were thawed at room temperature under lighting conditions (dim lighting is in favor to better conserve the TAM in the samples). In dry tubes we put 0.4 ml of plasma followed by 600 µl of methanol and 200 µl of DMSO. The tubes were vortexed for 15 s then centrifuged at 4000 t for 15 min. The organic phase was transferred to an auto sampler vial (Vial) 50 µl was injected to perform the assay after checking the retained conditions of the mobile phase, column temperature and flow rates.
Calibration curves: Five increasing concentrations were prepared from the stock solution of tamoxifen in neutral plasma (0.2 μg/mL; 0.5 μg/mL; 1 μg/mL; 2 μg/mL and 4 μg/mL) then we performed the extraction for this range, the organic phase was transferred into a vial, 50 µl was injected into the system.
Validation of the analytical method: The method was validated by determining the specificity, linearity, precision, accuracy, Limits of Detection (LD) and Quantification (LOQ) according to the guidelines of the International Conference on Harmonization (ICH) [9]. The objective of validation is to produce reliable and reproducible results when performing pharmacokinetic, bioequivalence, bioavailability studies or even during toxicological studies, whether for animal or human models.
Specificity: The specificity of an analysis method consists in showing that the measured peak comes only from the compound to be analyzed, without any interference with its matrix (excipients, degradation products, impurities, etc.). The study of the specificity method involves the comparison made on the chromatograms of the reconstituted pharmaceutical form and the placebo.
Linearity: It is the ability to obtain results within a certain range that are directly proportional to the concentration of the substance being analyzed in a sample. Three series of TAM solution were reconstituted and analyzed over three successive days. Each series consisted of five concentrations samples (0.2 μg/mL; 0.5 μg/mL; 1 μg/mL; 2 μg/mL and 4 μg/mL). Each solution is injected 3 times with a volume of 50 μL. Before injection of the solutions, the column is equilibrated for at least 20 min with the mobile phase. Tamoxifen concentrations were determined from the areas under the curves. The relation between peak area (y) and TAM concentration (X) was expressed in the form of linear regression equation: y=ax+b; Where (a) The slope of the line, (b) The intercept.
Accuracy: Accuracy is the degree of agreement between the method value obtained and the reference value or the value considered true by convention. It is determined on the five samples used in the linearity study. The principle of accuracy is to calculate the recovery values in % between the quantities found and the quantities introduced.
Precision: It is expressed by the measurement of repeatability (intre-assay precision) and intermediate precision. Repeatability refers to tests of the same magnitude carried out under conditions as stable as possible. The work will be carried out on 3 solutions of 100% concentration in the same day, by the same operator and under the same experimental conditions. Each solution is injected 6 times. Intermediate precision was evaluated by studying two groups of results obtained in two consecutive days. Each group contains the results obtained on 3 solutions. In practice, the precision of TAM in the control solution is studied for three successive days while keeping the same operator and the same apparatus. The precision was determined by calculating the mean recovery and the coefficients of variation over the 6 injections of three solutions of 100% concentration.
Limit of detection and limit of quantification: The Limit of Detection (LD) and the Limit of Quantification (LOQ) were determined from the analytical curve and experimentally according to the signal-to-noise ratio as defined by ICH.
Application to patients: Patients diagnosed with infiltrating breast carcinoma receiving tamoxifen as adjuvant hormone therapy were recruited. These patients has completed a full cycle of chemotherapy, radiotherapy and were on 20 mg/day of tamoxifen for at least three months. They were recruited during the period from June to September 2020 at the Oncology department, university hospital center at the Monastir (Tunisia). The blood samples of the patients taken after a variable time of taking tamoxifen, were collected in EDTA tubes. Blood samples were centrifuged (5000 rpm for 10 min) at 4°C. The plasma was then transferred and distributed into small volume tubes (Eppendorf) for storage at -20°C.
Statistical Analysis
We used Excel software and Cochran statistical tests for the homogeneity of variances, the Fisher test for the validity of the regression line, the existence and the significant slope also for the checking of the accuracy and we have used Student's test to check if the intercept is equivalent to 0 [10,11]. Values were expressed as mean ± SEM. All statistical tests were two-tailed and statistical significance was defined as α=0.05.
Results and Discussion
Development method
Choice of detection wavelength: Analysis of the UV absorption spectrum of an aqueous solution of tamoxifen at a concentration of 2 μg/mL showed the presence of the maximum absorption bands in the wavelength range between 240 nm and 280 nm. While the spectra were acquired in the range of 200 nm to 380 nm and the quantification of this agent, in this study, was performed at a fixed wavelength λ=280 nm. According to the literature, various studies similar to ours have objectified chromatograms relating to tamoxifen detected at a wavelength of 280 nm whether in animal [12] or human plasma with a spectral acquisition interval of 200 nm to 380 nm [13,14].
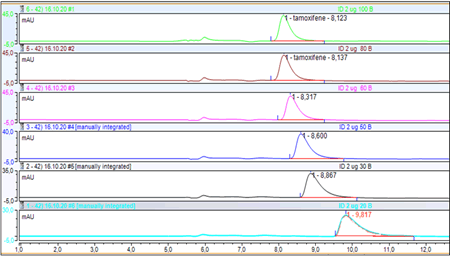
Choice of the composition of the mobile phase: The variation in the percentage of the methanol-ammonium acetate buffer mobile phase (2%:2 g of ammonium acetate in 100 ml of methanol) of pH=6.5 on the retention of tamoxifen gave the different chromatographic recordings (Figure 1). The chromatograms in this figure illustrate the effect of changing the percentage of MeOH on the retention of tamoxifen. The variation of the percentage of methanol and of the mobile phase showed a shift in the retention time from 8.123 min to 9.817 min. Our choice of column and adjustment of the mobile phase allows separation and quantification of tamoxifen within a reasonable time. The total analysis time associated with our method was 15 min with a retention time of 8 min for tamoxifen. This result is very close to the results of several studies, which used HPLC-UV, found an analysis time of 16 min and retention time 13.5 min [13] and 11 min [15] these same or even shorter analysis times (11 to 18 minutes) have been described for HPLC methods with fluorescence detection. In contrast, the study by Lee et al. Reported longer analysis times of up to 70 minutes [16].
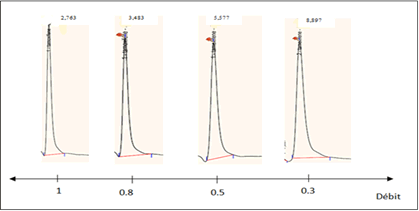
Mobile phase flow effect: The retention time of tamoxifen is highly dependent on the flow rate of the mobile phase. The higher the throughput, the shorter the retention time and therefore the shorter analysis time. The effect of varying the flow rate of the mobile phase of 100% ammonium acetate buffer composition on the retention of tamoxifen was studied between 0.3 and 1 mL/min (Figure 2). Based on these chromatograms, we chose the flow rate 0.3 mL/min which allows good elution of tamoxifen as long as this peak does not overlap with those of neutral plasma.
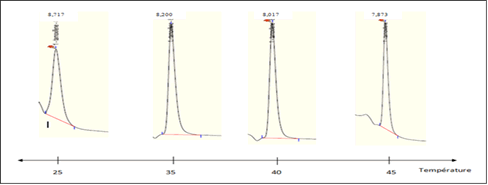
Effect of column temperature on tamoxifen retention: Room temperature is best suited for method development chromatographic. An increase in this leads to a decrease in the retention time of tamoxifen despite the improvement in column efficiency. Recorded chromatograms showing the effect of changing column temperature on tamoxifen retention (Figure 3). From this figure, we can see that increasing the temperature of the column reduces the retention time of tamoxifen and increases the efficiency of the chromatography column, resulting in finer peaks.
Effect of mobile phase pH: A mobile phase composed of ammonium acetate buffer (2%: 2 g dissolved in 100 ml of methanol) was used, the pH was adjusted with glacial acetic acid with different percentages. We tested the following percentages (99:1; v/v); (98:2; v/v) and (97:3; v/v) to obtain the following respective pH values: 6.5; 5 and 4.
Method validation: The validation was performed following the requirements of the ICH tripartite guideline [9,14] in matrix, using blank plasma samples spiked. The considered validation parameters were: specificity, linearity, sensitivity (LOD and LOQ), intra- and inter-day precision and accuracy.
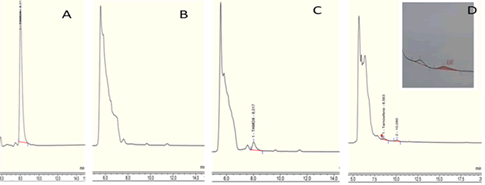
Specificity: In order to check the absence of endogenous compounds in plasma, which could interfere with the analytes, ten samples of plasma were analyzed under the optimized conditions. The specificity of the method was evaluated by observing and comparing four chromatograms: a chromatogram relating to direct injection (A), a second chromatogram relating to the uncharged neutral plasma (B), a third chromatogram relating to the plasma loaded with tamoxifen (C) and a fourth chromatogram inherent to a patient treated with tamoxifen (D) (Figure 4).
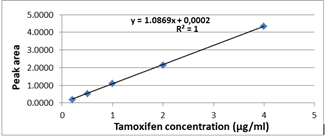
Linearity: In order to determine the linear correlation between UV signal and concentration, a blank sample of plasma free of analyte was spiked at five solutions at increasing concentration levels of tamoxifen, in the range 0.2–4 μg/mL (2 μg/ml, 0.5 μg/ml, 1 μg/ml, 2 μg/ml and 4 μg/ml) were successively injected. Slope, intercept and determination coefficient (r2) were calculated by least square linear regression, plotting the areas of the chromatographic peaks for reach analyte vs. concentration. The calibration was repeated three times at separate days (preparing the standard simple on each occasion) over three months to consider the interday variation. The tamoxifen calibration curve obtained is linear over the entire concentration range from 0.2 to 4 µg/mL (Figure 5). The equation of the regression line which is of the form (y=ax+b) (y=1.0869x+0.0002) with R2=0.999 (Figure 5). Linearity has been evaluated by the majority of studies that have looked at the validation of methods for assaying tamoxifen regardless of the apparatus used (HPLC-UV; MS/MS). In the literature, Souza et al. and Santana et al. tested linearity in the plasma concentration range of 0.25 to 20 µg/ml, using the RP-HPLC chain (reverse phase), they showed very acceptable linearity with a correlation coefficient r2>0.99, r2>0,95 respectively [17,18].
The correlation coefficient of the regression line corresponding to tamoxifen is equal to 0.999. So the method of assaying tamoxifen by HPLC is linear. This was verified by the statistical tests of Cochran, Fischer and Student.
The objective of the Cochran test is to check the homogeneity of the variances constituting the experimental error and thus to detect the presence of suspect values. According to these results, the variances of the different groups are homogeneous at the risk of 5% (Table 2).
| S 2j max | ∑S2j | C calculated | Critical C (0,5; 5; 2) | |
|---|---|---|---|---|
| PA | 0.018 | 0.039 | 0.468 | 0.684 |
Table 2: Cochran test result. S2jmax: the greatest of the variances S2j: the variance for each sample, C calculated <C (0,05; 5; 2), The variances are homogeneous to the 5% risk.
Assessment of regression line validity test using Fisher test has shown that adjustment error is not significantly different of experimental error. In this study, the validity test of the regression line showed that the calculated F2 is lower than the tabulated F (0.05; 3; 10) read from the Snedecor table (Table 3).
| Origine of the variation | Variances | F2 calculated | F tabulated (0.05; 3; 10) |
|---|---|---|---|
| Regression error | 0.0078 | 0.461 | 3.71 |
Table 3: Regression line validity test: Fisher test. F2 calculated< F tabuleted (0.05; 3; 10).
In this validation, we used the Fischer test for the existence of a significant slope and we found that F1 calculated>F tabulated (0.05; 1; 13) with p<0.05 (Table 4). There is a significant slope with a linear dependence between the dependent variable and the independent variable at 95%.
| Origine of variation | Variance | F1 calculated | F tabulated (0.05; 1; 13) |
|---|---|---|---|
| Regression variation | 33.554 | 4876.145 | 4.67 |
| Residual variation | 0.068 |
Table 4: The existence of a significant slope: Fisher test. F1 calculated>F tabulated (0.05; 1; 13).
The Student test allows us to check if the intercept is equivalent to 0. The value of t calculated was less than the upper acceptance limit t tabulated, i.e., t(0.05; 13) (T tabulated is reading in the Student's table at 5% risk). However, we can consider that the intercept is not statistically different from 0 and therefore our method is exact (Table 5).
| a | Sa | T calculated=a/sa | T tabulated (0.05; 13) |
|---|---|---|---|
| 0.0013 | 0.028 | 0.0442 | 2.16 |
Table 5: Comparison test of the intercept with the 0: Student test. t calculated< t tabulated (0.05; 13).
Accuracy: It is expressed by the percentages of recovery relative to the amount introduced in active principle in the samples. The results obtained during the study of the accuracy of tamoxifen are collated in Table 6. The coefficient of variation for tamoxifen being less than 15%, and the average recovery confidence interval: CI=91.976% ± 0.0276. This average is between an interval of 85% and 115% which is the acceptance criterion for accuracy. These results were statistically analyzed by the Fisher and Cochran tests which are validated F calculated=19.44 is greater than the F (0.05; 3; 10)=3.71. C Calculated=0.379 is less than C Theoretical=0.68. So we can conclude that this method is correct (Table 6).
| Theoretical concentration (µg/ml) | Concentration regained (µg/ml) | Recovery (%) |
|---|---|---|
| 0.2 | 0.184 | 91.927 |
| 0.2 | 0.184 | 91.927 |
| 0.2 | 0.184 | 91.927 |
| 0.5 | 0.459 | 91.971 |
| 0.5 | 0.459 | 91.971 |
| 0.5 | 0.459 | 91.971 |
| 1 | 0.919 | 91.988 |
| 1 | 0.919 | 91.988 |
| 1 | 0.919 | 91.988 |
| 2 | 1.839 | 91.996 |
| 2 | 1.839 | 91.996 |
| 2 | 1.839 | 91.996 |
| 4 | 3.68 | 92 |
| 4 | 3.68 | 92 |
| 4 | 3.68 | 92 |
| Average (%) = 91.976% | ||
| Standard deviation= ± 0.0276 | ||
| Coefficient of variation=0.03% | ||
Table 6: Calculation of recovery percentages for the study of accuracy.
Precision: The repeatability and intermediate precision (reproducibility) of TAM are evaluated using the coefficients of variation calculated on the 6 injections of three solutions of 100% concentration. They must be less than 15%. The values obtained show a precision suitable for the analytical method (Table 7).
The Cochran test was performed to verify the significance of the precision. The result of this analysis showed that Ccalculated is less than Ccritical (0.05; 3; 6) (0.398<0.616 respectively).
| Groups number (K) | 3 |
| Number of measurements/group (N) | 6 |
| Repeatability variance (s²r) | 0.711 |
| Reproducibility variance (s²R) | 9.489 |
| Coefficient of repeatability variation (CVr) | 1.645 |
| Coefficient of reproducibility variation (CVR) | 6.008 |
Table 7: The values obtained show a precision suitable for the analytical method.
The Limit of Detection (LD) and the Limit of Quantification (LOQ): The LD detection and LQ quantification limits were calculated using the equations: LD=3.3*s/S; LQ=10*s/S, where s is the standard deviation of the response and S is the slope of the calibration curve. The LD detection limits and LOQ quantification limits were 0.055 μg/mL and 0.18 μg/mL, respectively.
Assay application: Twenty patients with non-metastatic invasive mammary carcinoma were included in the application of our assay method. These patients had an average age of 43.7 years (range 32 years to 53 years). These patients had completed a full course of chemotherapy, radiotherapy and were treated with tamoxifen. Four patients were on goserelin. All of the patients presented with side effects such as hot flashes of varying intensity (n=20) and thickening of the endometrium (n=2).
The mean plasma concentration of tamoxifen in our patients was 271 ± 139 ng/ml (range 97 ng/ml and 781 ng/ml). For 18 patients, the blood sample for the assay of TAM was carried out 15 hrs to 16 hrs after the last dose of the drug. In these patients the mean concentration was 237 ± 79 ng/ml. The remaining two patients were removed three hours later and the concentrations averaged 300 ± 63 ng/ml. The range of TAM concentrations in our patients was very close to that found in the study by Lim et al. (84 ng/ml–599 ng/ml) [19]. These data were obtained from 165 patients and the assay method was HPLC-fluorescence detection. Similarly, Barginear et al. found in 117 patients a range of TAM concentration between 36 and 751 ng/ml by mass spectrometry [20]. We observed a variability of TAM concentration which could be explained in part by the differences in the time between the last dose of the drug and the blood sample. However, the pharmacokinetics of tamoxifen is subject to great inter-individual variability. This same variability is explained by the variability of the genetic expression of the enzymes of the hepatic metabolism of the drug. These elements constitute an approach for further studies. The pharmacokinetics of tamoxifen and the genotyping of CYP2D6 are promising and appropriate means to explain this variability as they would provide a comprehensive overview of the clinical phenomena.
Conclusion
We have developed and validated, according to ICH standards, a plasma assay method for tamoxifen. It was based on the CLPH-DAD coupling. This method has a major advantage which is that it is fast and does not require any expensive, advanced or additional instrumentation. On the one hand, this dosage method constitutes a promising option for improving personalized medicine for patients with breast carcinoma and treated with tamoxifen, on the other hand, it facilitates the performance of pharmacokinetic research relating to this drug. In the first part, we determined the optimal parameters allowing the analysis of tamoxifen by HPLC/DAD with a C18 column (4.6*150 mm; 5 µm), at=280 nm, a mobile phase consisting of a mixture of 2% ammonium acetate in methanol of pH 6.5 adjusted with acetic acid (99:1; v/v), at a flow rate of 0.3 mL min-1 and a temperature of 35°C. The retention time obtained was 8.03 min and that of analysis 15 min. We have also validated the method of assaying tamoxifen. Thus, we were able to show that the adopted assay method is specific, exact, faithful and linear between 0.1 μg mL-1 and 4 μg mL-1. The limit of detection and quantification of TAM are respectively 0.055 μg mL-1 and 0.18 μg mL-
References
- Cole MP, Jones CT, Todd ID (1971) A new anti-oestrogenic agent in late breast cancer. An early clinical appraisal of ICI46474. Br J Cancer 25: 270‑ [Crossref], [Google Scholar], [Indexed]
- Pistilli B, Paci A, Ferreira AR, Di Meglio A, Poinsignon V, et al. (2020) Serum detection of nonadherence to adjuvant tamoxifen and breast cancer recurrence risk. J Clin Oncol 38: 2762–2772. [Crossref], [Google Scholar], [Indexed]
- Binkhorst L, Mathijssen RH, Jager A, van Gelder T (2015) Individualization of tamoxifen therapy: Much more than just CYP2D6 genotyping. Cancer Treat Rev 41: 289-99. [Crossref], [Google Scholar], [Indexed]
- Morello KC, Wurz GT, DeGregorio MW (2003) Pharmacokinetics of selective estrogen receptor modulators. Clin Pharmacokinet 42: 361‑ [Crossref], [Google Scholar], [Indexed]
- Lien EA, Solheim E, Kvinnsland S, Ueland PM (1988) Identification of 4-hydroxy-N-desmethyltamoxifen as a metabolite of tamoxifen in human bile. Cancer Res 48: 2304-2308. [Crossref], [Google Scholar], [Indexed]
- Jean E A, Mel J M, Driver KE, Platte R, Kalmyrzaev B, et al. (2010) CYP2D6 gene variants: association with breast cancer specific survival in a cohort of breast cancer patients from the United Kingdom treated with adjuvant tamoxifen. Breast Cancer Res 12: R64.
- Drenberg CD, Baker SD, Sparreboom A (2013) Integrating clinical pharmacology concepts in individualized therapy with tyrosine kinase inhibitors. Clin Pharmacol Ther 93: 215-219. [Crossref], [Google Scholar], [Indexed]
- Braal CL, Beijnen JH, Koolen SLW, Oomen-de Hoop E, Steeghs N, et al. (2019) Relevance of endoxifen concentrations: Absence of evidence is not evidence of absence. J Clin Oncol 37: 1980-1981. [Crossref], [Google Scholar], [Indexed]
- A new anti-oestrogenic agent in late breast cancer. An early clinical appraisal of ICI46474.
- Hartmann C, Massart DL, McDowall DR (2014) An analysis of the Washington conference report on bioanalytical method validation. J Pharm Biomed Anal 12: 1337-1343. [Crossref], [Google Scholar], [Indexed]
- Alshaikheid M, Fredj NB, Chaabane A, Chadli Z, Slama A, et al. (2018) Development and validation of a chromatographic method for the quantification of isoniazid in human plasma. J Pharm Drug Deliv Res 7: 2. [Crossref], [Google Scholar], [Indexed]
- Santana DP, Braga RMC, Strattmman R, Albuquerque MM, Bedor DCG, et al. (2008) Reversed phase HPLC determination of tamoxifen in dog plasma and its pharmaco-kinetics after a single oral dose administration. Quím Nova 31: 47‑ [Crossref], [Google Scholar]
- Antunes MV, Rosa DD, Viana TDS, Andreolla H, Fontanive TO, et al. (2013) Sensitive HPLC-PDA determination of tamoxifen and its metabolites N-desmethyltamoxifen, 4-hydroxytamoxifen and endoxifen in human plasma. J Pharm Biomed Anal 76: 13‑ [Crossref], [Google Scholar], [Indexed]
- Shahbaz K, Ijaz J (2016) Pharmgeonetic effect on plasma concentration of tamoxifen through hplc in female subjects of Pakistan. World J Pharm Pharm Sci 5: 1799-1808. [Crossref], [Google Scholar]
- MacCallum J, Cummings J, Dixon JM, Miller WR (1996) Solid-phase extraction and high-performance liquid chromatographic determination of tamoxifen and its major metabolites in plasma. J Chromatogr B Biomed pp: 317‑ [Crossref], [Google Scholar]
- Lee K-H, Ward BA, Desta Z, Flockhart DA, Jones DR (2003) Quantification of tamoxifen and three metabolites in plasma by high-performance liquid chromatography with fluorescence detection: application to a clinical trial. J Chromatogr B Analyt Technol Biomed Life Sci 791: 245‑ [Crossref], [Google Scholar], [Indexed]
- Shah VP, Midha KK, Findlay JW, Hill HM, Hulse JD, et al. (2000) Bioanalytical method validation-a revisit with a decade of progress. Pharm Res 17: 1551–1557. [Crossref], [Google Scholar], [Indexed]
- Claro de Souza M, Marotta-Oliveira SS, Rocha NHS, Eloy JO, Marchetti JM (2015) Development of a method to evaluate the release profile of tamoxifen from pegylated hybrid micelles. J Liq Chromatogr 38: 1223–1229. [Crossref], [Google Scholar], [Indexed]
- Lim JSL, Chen XA, Singh O, Yap YS, Ng RCH, et al. (2011) Impact of CYP2D6, CYP3A5, CYP2C9 and CYP2C19 polymorphisms on tamoxifen pharmacokinetics in Asian breast cancer patients. Br J Clin Pharmacol 71: 737‑ [Crossref], [Google Scholar], [Indexed]
- Barginear MF, Jaremko M, Peter I, Yu C, Kasai Y, et al. (2011) Increasing tamoxifen dose in breast cancer patients based on cyp2d6 genotypes and endoxifen levels: effect on active metabolite isomers and the antiestrogenic activity score. Clin Pharmacol Ther 90: 605‑ [Crossref], [Google Scholar], [Indexed]
 Spanish
  Chinese
  Russian
  German
  French
  Japanese
  Portuguese
  Hindi
Hindi 