Research Article, J Otol Rhinol Vol: 7 Issue: 4
MR Imaging Features of Minor Salivary Gland Tumors
Amit Karandikar1*, Siu Cheng Loke1, Julian Goh1 and Tiong Yong Tan2
1Department of Radiology, Tan Tock Seng Hospital, Singapore
2Department of Radiology, Changi General Hospital, Singapore
*Corresponding Author : Amit Karandikar, MBBS, FRCR (UK)
Department of Radiology, Tan Tock Seng Hospital, Jalan Tan Tock Seng, Singapore, 308433
Tel: +65 6256 6011
E-mail: amit_karandikar@ttsh.com.sg
Received: Janaury 09, 2018 Accepted: February 16, 2018 Published: February 23, 2018
Citation: Karandikar A, Loke SC, Goh J, Tan TY. (2018) MR Imaging Features of Minor Salivary Gland Tumors. J Otol Rhinol 7:4. doi: 10.4172/2324-8785.1000350
Abstract
Aim: To retrospectively evaluate the MR imaging features of histologically proven minor salivary gland tumors (MSGTs). Materials and Methods: A retrospective review of MR imaging features of 29 histologically proven MSGTs was performed. Results: The commonest site of involvement was base of tongue (n=7) and the commonest pathology was adenoid cystic carcinoma (n=12). All the MSGTs revealed smooth surface with well-defined margins and polypoidal appearance (100% sensitivity, 100%PPV). T2w hyperintensity and enhancement results (ranged from intense to intermediate hyperintensity) were variable. Larger tumors (more than 3.5 cm) had a heterogeneous appearance. Discussion: All MSGTs showed smooth surface, well-defined margins and polypoidal appearance. The T2w hyperintense signal of the MSGTs (ranging from intermediate T2w hyperintensity to intense T2w hyperintensity) and the post contrast enhancement (also ranging from intermediate to intense enhancement) was variable. In the head and neck region, MSGTs need to be differentiated from the more common entities such as squamous cell ancers (SCC) and Lymphoma. While this differentiation is not always easy, orphologically SCCs typically present as locally infiltrative tumors with ill-defined margins. Lymphomas typically present as polypoidal masses with well-defined margins and hence may closely resemble MSGTs. Lymphomas are generally homogeneous masses showing intermediate T2w hyperintensity. Thus differentiation between lymphomas and MSGTs can sometimes be a challenge, however if the mass shows intense T2w hyperintensity with intense enhancement, it could point to a diagnosis of MSGT.
Keywords: Salivary gland tumors; MRI imaging; Head and neck
Introduction
Salivary gland tumors constitute about 3-6% of head and neck tumors. They occur in major and minor salivary glands. Major salivary glands include parotid, submandibular and sublingual glands. There are about 450 to 1000 minor salivary glands scattered in upper aerodigestive tract, middle ear, nose, paranasal sinuses, pharynx and larynx. Minor salivary gland tumors (MSGTs) comprise about 15-20% of all salivary gland tumors. Majority (about 90%) of MSGTs are located in the oral cavity and oropharynx. Heterotopic MSGs may occur in lymph nodes, thyroid gland capsule, hypophysis and the facial bones [1]. Unlike major salivary gland tumors, where over 80% are benign, over 80% of MSGTs are malignant. Most common benign MSGT is pleomorphic adenoma and the most common malignant MSGT is adenoid cystic carcinoma [2,3]. Treatment is generally surgical resection with or without radiotherapy [4,5]. Although numerous cases of MSGTs are reported, literature on MR imaging features on MSGTs is sparse [6]. We present a retrospective analysis of MSGTs at our institution, where we discuss in detail the various imaging features, such as morphology, MRI signal characteristics of these tumors at various locations.
Aim
To retrospectively evaluate the MR imaging features of histologically proven minor salivary gland tumors.
Materials and Methods
A retrospective review of 29 surgically and histopathologically (HP) proven MSGTs was performed which were collected over a period from 2007 to 2015. All the patients had undergone MRI study prior to surgery on superconducting magnets of 1.5 T (GE Signa HDxt, USA) and 3T (Siemens Trio Trim, Germany). An approval was obtained from the Ethics committee prior to conducting this study as per protocol.
Scanning parameters and sequences
Sequences obtained were- Axial (T1w, STIR or T2w), Coronal (T1w, IR) and post contrast fat suppressed T1w (axial and coronal planes).
The scan parameters were as follows-FOV-20 cm, slice thickness-4 mm, interslice gap-0.5 mm, NEX- 2, flip angle- 900, bandwidth-31.25
MRI features of these tumors were evaluated by 2 experienced head and neck radiologists with 10 years and 7 years of experience respectively.
Results
Age
Of the surgically operated 29 patients, 12 were males and 17 were females. The age range was 32-65 years.
Histology
The commonest histology was adenoid cystic carcinoma (n=12, about 41%) followed by mucoepidermoid carcinoma (n=9, about 31%). The commonest histology was adenoid cystic carcinoma (n=12, about 41%). Other histological types were noted to be mucoepidermoid carcinoma, pleomorphic adenoma and adenocarcinoma. Pleomorphic adenoma was the only benign histology (Table 1).
| HISTOLOGY | NUMBER OF CASES |
|---|---|
| Adenoid cystic carcinoma (ACC) | 12 |
| Mucoepidermoid carcinoma (MEC) | 9 |
| Pleomorphic adenoma (PA) | 6 |
| Adenocarcinoma (AdCA) | 2 |
Table 1: Histology and Number of cases.
Location
The commonest site of involvement was base of tongue (n=7, about 24%) followed by hard palate (n=5). 23 out of 29 patients (about 79%) occurred in oral cavity, oropharynx, nasal cavity and paranasal sinuses. Other sites also included nasopharynx (NP), EAC, Eustachian tube (ET), upper lip and larynx (Table 2). For large tumors, the main site of involvement was considered based on the epicentre of the tumour.
| HP | DIFFERENT SITES OF TUMORS | ||||||||||
|---|---|---|---|---|---|---|---|---|---|---|---|
| NP | BOT | Hard P. | Soft P. | Nasal cavity | PN sinus | Larynx | Upper Lip | EAC | ET | N= | |
| ACC | - | 3 | - | 1 | 3 | 4 | - | - | 1 | - | 12 |
| MEC | - | 4 | 3 | - | 1 | - | - | - | - | 1 | 9 |
| PA | 1 | - | 2 | 2 | - | - | - | 1 | - | - | 6 |
| AdCA | 1 | - | - | - | - | - | 1 | - | - | - | 2 |
Table 2: Sites of Tumors.
The most common anatomical site for adenoid cystic carcinoma was nasal cavity and paranasal sinuses (7 of the 12 cases, about 58%). The most common anatomical site for mucoepidermoid carcinoma was oral cavity and oropharynx (7 of the 9 cases, about 78%). Similar findings were also observed by Strick et al. [1].
Imaging features
The MR imaging features compared were as follows- size, morphology (polypoidal vs infiltrative), margins, surface, T2w signal, homogeneity or heterogeneity and contrast enhancement.
Size
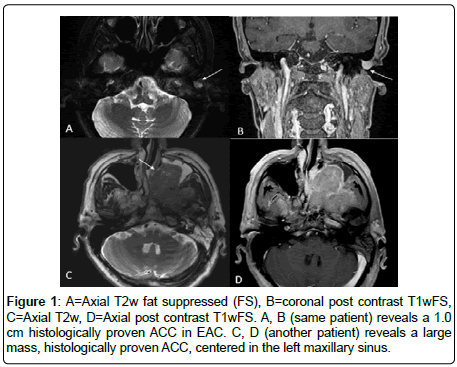
The smallest size measured 1.0 × 0.9 × 0.6 cm (adenoid cystic cancer in external auditory canal), while the largest tumour measured 8.6 × 6.5× 5.4 cm (adenoid cystic carcinoma centered in hard palate) (Figure 1).
Morphology
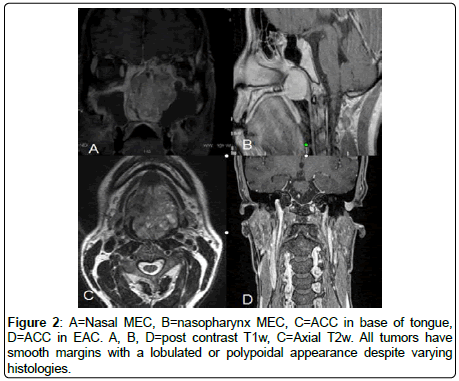
All the MSGTs revealed- Smooth surface, well-defined margins, polypoidal appearance protruding into the airway/lumen (100% sensitivity, 100%PPV) (Figure 2).
Signal characteristics
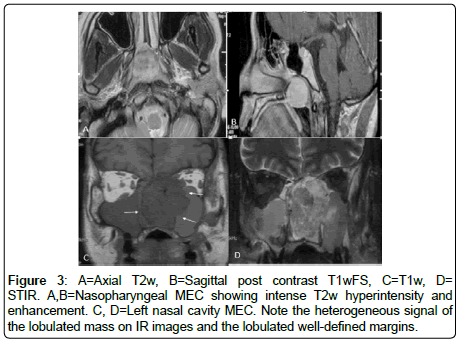
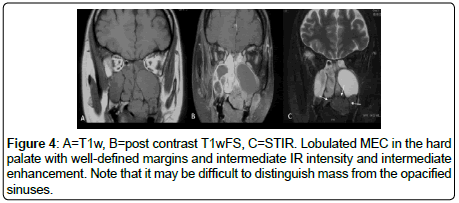
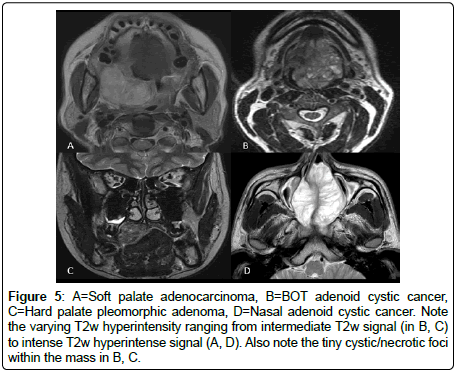
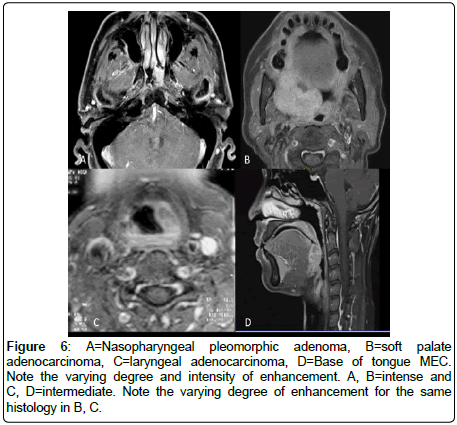
All the MSGTs are T1w hypointense, T2w hyperintensity and enhancement results were variable (Figures 3 and 4). Intense T2w hyperintensity (comparable with nasal turbinates or mucosa) was seen in n=5, while intermediate T2w hyperintensity was noted in n=24 cases (Figure 5). Enhancement was intermediate to intense and did not reveal any specific distinguishing feature (Figure 6).
Figure 5: A=Soft palate adenocarcinoma, B=BOT adenoid cystic cancer, C=Hard palate pleomorphic adenoma, D=Nasal adenoid cystic cancer. Note the varying T2w hyperintensity ranging from intermediate T2w signal (in B, C) to intense T2w hyperintense signal (A, D). Also note the tiny cystic/necrotic foci within the mass in B, C.
Homogeneous enhancement was seen in n=14 cases while heterogeneous appearance with cystic (T2w hyperintense) foci were seen within the mass in n=15 cases. There was no consistent differentiating feature in T2w appearance or the enhancement of the tumors that could help differentiate the benign from malignant tumors or distinguish between different histology results.
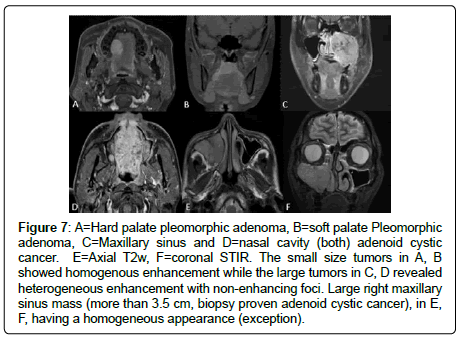
Smaller tumors had a tendency to be homogenous while larger tumors were heterogeneous in appearance with internal cystic/ necrotic foci or areas (Figure 7). In our study, most of the tumors larger than 3.5 cm had a heterogeneous appearance. 14.3% of tumors (n=2) larger than 3.5 cm had homogeneous appearance on T2w and post contrast study (Figure 6B,7E,7F). 15 cases of 29 patients were smaller than 3.5 cm, while the rest were larger than 3.5 cm. Of the 15 tumors smaller than 3.5 cm, only one (pleomorphic adenoma) had a heterogeneous appearance.
Figure 7: A=Hard palate pleomorphic adenoma, B=soft palate Pleomorphic adenoma, C=Maxillary sinus and D=nasal cavity (both) adenoid cystic cancer. E=Axial T2w, F=coronal STIR. The small size tumors in A, B showed homogenous enhancement while the large tumors in C, D revealed heterogeneous enhancement with non-enhancing foci. Large right maxillary sinus mass (more than 3.5 cm, biopsy proven adenoid cystic cancer), in E, F, having a homogeneous appearance (exception).
Associated findings
Lymphadenopathy: None of the cases in our study revealed lymphadenopathy. Lymphadenopathy is less common as compared to squamous cell cancer (SCC) or lymphoma. Adenoid cystic carcinoma is generally not associated with lymphadenopathy. High grade MSGTs like (MEC or carcinoma ex pleomorphic) show lymphadenopathy.
Perineural spread
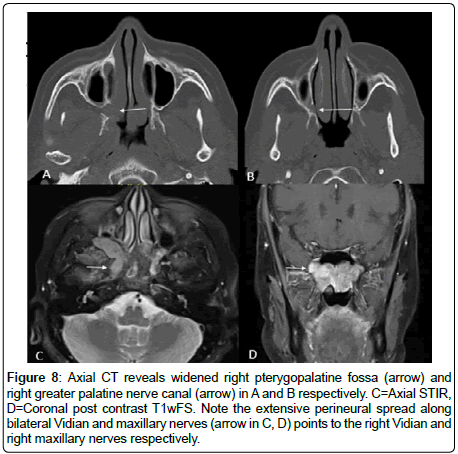
3 cases of adenoid cystic carcinoma revealed perineural spread (Figure 8).
Figure 8: Axial CT reveals widened right pterygopalatine fossa (arrow) and right greater palatine nerve canal (arrow) in A and B respectively. C=Axial STIR, D=Coronal post contrast T1wFS. Note the extensive perineural spread along bilateral Vidian and maxillary nerves (arrow in C, D) points to the right Vidian and right maxillary nerves respectively.
Metastases
All the 29 cases that were studied did not reveal any distant metastases (lungs, abdomen and bones).
Uncommon locations
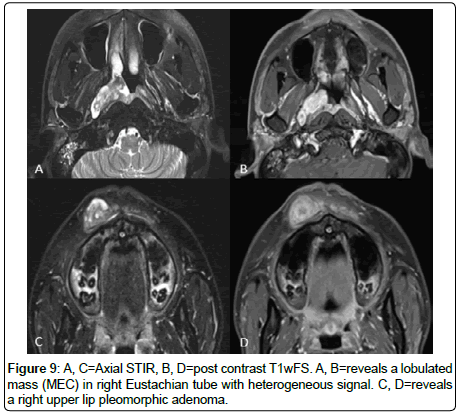
Tumors at uncommon locations such as EAC, upper lip, supraglottic larynx and Eustachian tube were generally less than 3.5 cm. They presented early due to regional anatomy and early clinical symptoms (Figure 1A,6C,9).
Discussion
The commonest head and neck malignancy is SCC followed by lymphoma. Salivary gland tumors constitute about 3-6% of head and neck tumors while minor salivary gland tumors (MSGTs) comprise about 15-20% of all salivary gland tumors.
The commonest site of MSGT in our study was base of tongue. The commonest pathology was adenoid cystic carcinoma [3]. Our study revealed that all the MSGTs had smooth surface, well-defined margins and polypoidal appearance (100% sensitivity, 100%PPV). The T2w hyperintensity and the enhancement were variable from intermediate to intense degree. We also found that MSGTs larger than 3.5 cm showed a heterogeneous appearance with internal cystic foci.
Squamous cell cancers (SCCs) and lymphoma vs MSGTs
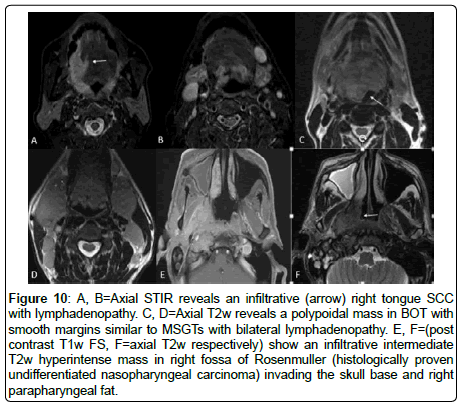
SCCs are locally infiltrative tumors with ill-defined and sometimes ulcerated margins [7,8], Figure 10A, B. Contrary to this, Lymphomas present as intermediate T2w hyperintense homogeneous masses with well-defined margins and a polypoidal or a lobulated appearance [9] (Figure 10C,D). MSGTs have smooth margins with polypoidal appearance which differs from SCC but morphologically may resemble lymphomas. Primary lymphomatous tumoral masses generally are homogenous and as per our study, most of the large (more than 3.5 cm) MSGTs revealed heterogeneous appearance with internal cystic/necrotic foci. This finding if present in larger tumors may help distinguishing MSGTs from lymphomas. However, if the tumor is homogeneous, differentiation may be difficult.
Figure 10: A, B=Axial STIR reveals an infiltrative (arrow) right tongue SCC with lymphadenopathy. C, D=Axial T2w reveals a polypoidal mass in BOT with smooth margins similar to MSGTs with bilateral lymphadenopathy. E, F=(post contrast T1w FS, F=axial T2w respectively) show an infiltrative intermediate T2w hyperintense mass in right fossa of Rosenmuller (histologically proven undifferentiated nasopharyngeal carcinoma) invading the skull base and right parapharyngeal fat.
Enhancement and T2w hyperintensity can sometimes be helpful as lymphomas generally show intermediate T2w hyperintensity and generally show low to intermediate enhancement [10]. Comparatively, MSGTs show variable T2w hyperintensity and enhancement, ranging from intermediate to intense degree. Intense T2w hyperintensity and intense enhancement if seen, may suggest MSGT instead of lymphoma.
Lymphadenopathy is less common in MSGT as compared to SCC or lymphoma.
Nasopharyngeal cancers (NPC) vs MSGTs
NPCs present as infiltrative masses commonly located in the fossa of Rosenmuller with invasion into parapharyngeal fat and also skull base involvement or intracranial extension and associated lymphadenopathy [11] (Figure 10 E,F). NPC is commonly seen in South China and is one of the commonest head and neck cancer in Singapore. Contrary to these features, MSGTs present as well-defined polypoidal masses protruding into the lumen.
Our study has few limitations. Our sample size is small but this may be due to the uncommon incidence of MSGTs. Secondly, we have not done a direct comparison and statistical analysis of MRI features between patients with MSGTs, SCC or lymphoma in our institution. Thirdly, we have not included diffusion weighted imaging in our study as it is not a routine protocol in our department.
Conclusion
MSGTs are uncommon tumors but carry a better prognosis than the SCC. Hence attempt to evaluate MR signal characteristics and differentiating these tumors from SCC and lymphoma may be helpful. All the MSGTs in our study revealed smooth, well-defined margins with a polypoidal appearance. Large tumors revealed a heterogeneous appearance. T2w hyperintensity and enhancement is variable ranging from intermediate to intense degree.
References
- Strick MJ, Kelly C (2004) Malignant tumors of minor salivary glands-a 20 year review. JPRAS Open 57: 624-631.
- Matsuzaki H, Yanagi Y, Hara M, Katase N, Asaumi J, et al. (2012) Minor salivary gland tumors in the oral cavity: Diagnostic value of dynamic contrast-enhanced MRI. Eur J Radiol 81: 2684-2691.
- Vander Poorten V, Hunt J, Bradley PJ, Haigentz M Jr, Rinaldo A, et al. (2014) Recent trends in the management of minor salivary gland carcinoma. Head Neck 36: 444-455.
- Mücke T, Tannapfel A, Kesting MR, Wagenpfeil S, Robitzky LK, et al. (2010) Adenoid cystic carcinomas of minor salivary glands. Auris Nasus Larynx 37: 615-620.
- Papadogeorgakis N, Parara E, Petsinis V, Pappa E, Nikolaidis A, et al. (2011) A retrospective review of malignant minor salivary gland tumors and a proposed protocol for future care. Craniomaxillofac Trauma Reconstr 4: 1-10.
- Kaneda T, Minami M, Ozawa K, Akimoto Y, Okada M, et al. (1994) Imaging tumors of the minor salivary glands. Oral Surg Oral Med Oral Pathol 78: 385-390.
- Stambuk HE, Karimi S, Lee N, Patel SG (2007) Oral cavity and oropharynx tumors. Radiol Clin North Am 45: 1-20.
- Patkar D, Yanamandala R, Lawande M (2010) Imaging in Head and Neck Cancers. Otorhinolaryngol Clinic An Int J 12: 15-23.
- King AD, Law BK, Tang WK, Mo FK, Raghupathy R, et al. (2017) MRI of diffuse large B-cell non-Hodgkin's lymphoma of the head and neck: comparison of Waldeyer's ring and sinonasal lymphoma. Eur Arch Otorhinolaryngol 274: 1079-1087.
- King AD, Lei KI, Ahuja AT (2001) MRI of primary non-Hodgkin's lymphoma of the palatine tonsil. Br J Radiol 74: 226-229.
- Abdel Khalek Abdel Razek A, King A (2012) MRI and CT of nasopharyngeal carcinoma. AJR Am J Roentgenol 198: 11-18.
 Spanish
  Chinese
  Russian
  German
  French
  Japanese
  Portuguese
  Hindi
Hindi 