Spanish
  Chinese
  Russian
  German
  French
  Japanese
  Portuguese
  Hindi
Hindi Research Article, Biomater Med Appl Vol: 2 Issue: 2
The Use of Vibrational Optical Coherence Tomography in Matching Host Tissue and Implant Mechanical Properties
Frederick H. Silver1*, Ruchit G. Shah2 and Lisa L. Silver3
1Department of Pathology and Laboratory Medicine, Robert Wood Johnson Medical School, Rutgers, The State University of New Jersey, Piscataway, New Jersey
2Graduate Program in Biomedical Engineering, Rutgers, The State University of New Jersey, Piscataway, New Jersey
3OptoVibronex, LLC, 557 Belvidere Corner Road, Mt. Bethel, Pa 18343, New Jersey
*Corresponding Author : Frederick H. Silver
Department of Pathology and Laboratory Medicine, Robert Wood Johnson Medical School, Rutgers, The State University of New Jersey, Piscataway, New Jersey
E-mail: silverfr@rutgers.edu; fhsilver@hotmail.com
Received: April 17, 2018 Accepted: May 09, 2018 Published: May 16, 2018
Citation: Silver FH, Shah RG, Silver LL (2018) The Use of Vibrational Optical Coherence Tomography in Matching Host Tissue and Implant Mechanical Properties. Biomater Med Appl 2:2. doi: 10.4172/2577-0268.1000115
Abstract
Synthetic implants, allografts, and xenografts are used for repair and replacement of tissues in numerous surgical applications each year. A number of the grafts used as hernia replacements or for repair of other tissues require revision surgery due to modulus mismatches that occur at the implant-tissue interface. A variety of
tests have been used to elucidate mechanical properties of tissues and implants that are not applicable to in vivo evaluations.
We have reported the use of vibrational optical coherence tomography (OCT) to image and measure the mechanical properties of both natural and synthetic polymers. In this paper, we discuss use of this technique to match moduli of host tissues and implants. While skin and other soft tissues have moduli of between 0.5 and 5.2 MPa under physiologic conditions, polymers have moduli between 56.5 MPa and 2000 MPa and metals have moduli up to 250,000 MPa. Use of vibrational OCT to image and determine the moduli of both host tissues and implants will lead to limiting modulus mismatches that contribute to implant failure. In addition, use of this technique will minimize the need to sacrifice animals in pre-clinical studies and reduce the number of biopsies needed to do differential diagnosis in the clinic.
Keywords: Optical coherence tomography; Vibrational analysis; Resonant frequency; Collagen; Skin implants; Stress-concentration; Implant failure; Collagen
Introduction
Synthetic implants, allografts and xenografts are used for repair and replacement of tissues in numerous surgical applications each year [1,2]. Two million allografts, 10 million batches of xenografts and millions of synthetic implants are used each year in surgery. More than one third of the grafts used as hernia replacements require revision surgery due to mechanical mismatches that occur at the implant-tissue interface [3] and failures result in additional surgical costs of over 10 billion dollars a year. The cost of these revision surgeries in terms of lost work time and increased health care expenses are enormous. Currently, there are no non-invasive and non-destructive methods to evaluate moduli matches that occur between host tissue and implants.
A variety of polymers are used in medicine and their properties vary extensively depending on how they are compounded and processed [1,2]. The strength and stiffness of materials used in sutures, wound dressings, vascular implants, and nerve entubulation devices are important parameters that need to be understood to develop new medical devices [1-3].
Numerous tests have been used to elucidate mechanical properties of tissues and implants [4-7]. Methods such as magnetic resonance elastography (MRE), ultrasound elastography (UE), optical coherence tomography (OCT), optical coherence elastography (OCE) and OCT with vibrational analysis have been applied to tissues and disease processes [5]. However, non-Hookean behavior, time dependence and compressibility effects that occur during mechanical loading of tissues and implants complicate the results [5-13]. Recently the use vibrational optical coherence tomography (VOCT) to measure the mechanical properties of synthetic and natural polymers, including decellularized human dermis in vitro [5,8-12] and skin and scar tissues in vivo has been reported [13].
VOCT is used to measure the frequency of sound at which the maximum deformation of a tissue or polymer occurs. This frequency is then converted into an elastic modulus using a calibration curve [5,8-13]. Moduli measurements made at the frequency at which the maximum deformation occurs are quasi-elastic, since the viscous contribution to the mechanical behavior is normally only 2% to 4% [8]. Although the reported moduli of extracellular matrices (ECMs) are strain dependent, it is possible to relate moduli measured in vitro to the moduli of tissues in vivo by measurement of resonant frequency and sample thickness [13].
In this paper we discuss the use of VOCT to image and measure the mechanical properties of both natural and synthetic polymers non-invasively and non-destructively. These measurements are needed to characterize implant materials both in vitro and in vivo as well to establish the effects of moduli mismatches at implant-tissue interfaces.
Methods
Calibration of VOCT measurements
Modulus values for control tissues and polymers were used to construct a calibration curve of modulus values measured using tensile and vibrational measurements in vitro as previously described [5,8-13]. The calibration curve shown in Figure 1 was constructed to determine relationship between tensile moduli and vibrational moduli measured on the same samples.

Figure 1: Calibration curve of tensile modulus (Et) versus modulus (Ev) determined from vibrational OCT. This calibration curve was created by measuring the uniaxial tensile modulus versus strain using an incremental stress-strain experiment and calculating the vibrational modulus from resonant frequency measurements made on the same samples as reported previously [5,8-14]. Note the almost one to one relationship between these two moduli.
The relationship developed between moduli values measured using these two techniques was reported to be approximately linear [10-13]. The equation of the line was found to be:
Ev =1.026 Et + 0.0046 (1)
Where, Ev and Et are the moduli measured using vibrational and tensile measurements, respectively and are in MPas. A correlation coefficient of 0.984 was previously reported [10-13] for these measurements. The material behavior was observed to be reversible for strains in the low modulus and part of the high modulus regions of the stress-strain curve [10-13].
Figure 1 was determined by measuring the frequency at which the maximum displacement of the sample was observed [8-13]. This frequency is also known as the “resonance frequency” of the material. Sample vibrations were generated by placing a speaker under each specimen and then using spectral-domain optical coherence tomography (SD-OCT to determine the specimen movement as discussed previously [5,8-13]. The system uses a fiber-coupled superluminescent diode light source with 1325 nm center wavelength [8-13].
The resonant frequency, fn, is related to the modulus, E, by equation (2)
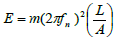 (2)
(2)
where m, L and A are the sample mass, length and cross-sectional area. The observed displacements of the samples were corrected for any line vibrations or speaker resonant frequencies observed.
Tensile moduli were measured using incremental stress-strain tests conducted by adding a strain increment to the sample and then measuring the load before an additional strain step was added as described previously [8-13]. Using a graduated translational stage, axial deformations were applied to the sample. Axial forces were measured by use of a force gage and recorded for subsequent calculations. The force was divided by the cross-sectional area to get the stress values. The strains were determined by dividing the change in length by the original length based on the movement of the translational stage after each strain increment. The tensile modulus was calculated from a tangent drawn to the stress-strain curve as described previously [8-13]. Calibration standards determined using these methods are listed in Table 1.
| Material | Strain | Tensile Modulus (MPa) | Vibrational Modulus (MPa) |
|---|---|---|---|
| Decellularized Dermis | 5% | 2.67 | 2.48 |
| 10% | 5.02 | 4.88 | |
| 15% | 6.7 | 6.82 | |
| Treated Dermis | 5% | 0.33 | 0.39 |
| 10% | 0.63 | 0.67 | |
| 15% | 0.75 | 0.83 | |
| Pig Skin (elastic tissue) | 3% | 0.53 | 0.58 |
| 5% | 0.82 | 0.75 | |
| Silicone Rubber | 5% | 1.05 | 1.02 |
| 10% | 1.95 | 1.83 |
Table 1: Calibration materials used to compare moduli determined from tensile and vibrational studies [8-14].
VOCT measurements
Image collection: OCT cross-sectional images used to determine the sample thickness were obtained using an OQ Labscope (Lumedica Inc., Durham, NC) and a laboratory spectral-domain optical coherence tomography device (SD-OCT) operating in the scanning mode [8-13].
OCT and vibrational analysis in vivo: Tissue displacements were generated by placing a speaker within 2.5 cm of the tissue to be studied and using SD-OCT to determine the tissue displacement as a function of vibrational frequency. For in vivo studies on skin and healed scar tissue a 24 mm × 14 mm rectangular speaker (Digi-Key, Thief River Falls, MN) was hard wired to a Samsung cell phone. Using a frequency generating app, the cell phone was capable of driving the speaker at frequencies of between 10 and 20,000 Hz. The speaker was taped to the skin using surgical tape and it was used to generate a sinusoidal sound wave that vibrated the skin. No sensation of the light or sound impinging on the skin was felt during the experimental studies. The sound intensity was only perceptible when the speaker was placed near the subject’s ear to make sure it was energized.
The resonant frequency of each sample was determined from the transverse displacement of the tissue at frequencies between 50 and 700 Hz, in steps of 50 Hz. Once the region where the maximum frequency was identified, smaller steps of 10 Hz were used to more accurately identify the peak frequency and the actual resonant frequency, fn. Moduli values were calculated from a second calibration curve that related resonant frequency to the tissue modulus times the tissue thickness (Figure 2).

Figure 2: Calibration curve of elastic modulus times sample thickness versus resonant frequency for different extracellular matrices. The modulus values were calculated from tensile measurements and the resonant frequency from vibrational measurements. Note the elastic modulus of decellularized dermis increases with strain.
Results
OCT images skin and scar were observed using the Lumedica OCT and are shown in Figure 3. Normal skin is characterized by the normal dermal papillae contained in the upper layer of dermis that undulate up and down (Figure 3). In comparison scar lacks clearly defined papillae. Figure 4 shows a plot of modulus versus strain for decellularized human dermis.

Figure 3: OCT images of skin and scar. These images were produced using a Lumedica OQ Labscope (Durham, NC) operating in the scanning mode. Note the difference in surface texture of normal skin and scar tissues and the interface that is easily observed by OCT.

Figure 4: Modulus versus strain curve for human decellularized dermis. This curve is characteristic of the mechanical behavior of skin and other collagenous tissues. Note that under physiologic conditions normal skin is operating in the low modulus region (modulus about 2 MPa) while scar (modulus of 7 MPa) operates in the high modulus region.
Resonant frequency values were corrected for thickness measurements made in vivo and compared to a calibration curve for ECMs shown in Figure 2. The displacements of skin and scar tissues showed peaks at 90 to 100 Hz (normal skin) and 220 to 230 Hz (scar tissue). These peaks resulted in calculated moduli of about 2.0 MPa and 7.0 MPa (scar), respectively as tabulated in Table 2. Moduli values for decellularized dermis at 5% and 15% are close to those of skin and scar tissue, respectively (Table 1).
| Tissue or Implant | Modulus (MPa) | Reference |
|---|---|---|
| Alloderm | 1.35 | [18] |
| Aorta | 0.5 | [16] |
| Femoral Cartilage | 5.2 | [14] |
| Cobalt-Chromium | 250,000 | [23] |
| Cortical Bone | 2000 | [23] |
| Decellularized Dermis | 2 | [10] |
| Ear Cartilage | 1.4-2.1 | [19] |
| Eyelid | 1.73 | [17] |
| Polyethylene | 65.5 | [20] |
| Polyethylene terephthalate | 2800 | [21] |
| Polytetrafluoroethylene | 500 | [21] |
| Poly(lactic) Acid | 2000 | [22] |
| Silicone Rubber | 1-2 | [11] |
| Skin | 2 | [13] |
| Stainless Steel | 190,000 | [23] |
| Titanium & Alloys | 110,000 | [23] |
Table 2: Moduli of biological tissues and implant materials.
Low and high modulus regions are observed when the moduli determined from vibrational studies are plotted versus strain for decellularized dermis as shown in Figure 5. From measured values of the modulus of skin in vivo (2 MPa) it appears that normal skin is operating in the low modulus region while scar (7 MPa) tissue operates in the high modulus region.

Figure 5: Bar graph comparing the modulus of several common synthetic materials and that of soft tissues containing collagen. Note since skin operates at a modulus of about 2 MPa under normal physiologic conditions while synthetic materials have moduli above this value: this would lead to stress concentration at the implant-tissue interface. This may lead to an increased up regulation of mechanotransduction and the incidence of implant failure [15].
Figure 6 and Table 2 show a comparison between the modulus of common synthetic implant materials and several soft tissues including skin. Note, since skin operates at a modulus of about 2 MPa under normal physiologic conditions, synthetic materials with moduli above 2 MPa will lead to stress-concentration at the interface and possible up-regulation of mechanotransduction that could lead to the deposition of fibrous scar tissue and implant failure [14,15].

Figure 6: A Plot of vibrational modulus versus the ratio of the resonant frequency per unit thickness for human decellularized dermis, human skin, pig elastic tissue, human scar, bovine cartilage and porcine rib fat. Note the modulus for each component of the ECM is shown for comparison purposes. The modulus for fat is about 0.03 MPa, for elastic tissue 0.8 MPa, for chemically treated dermis and decellularized dermis and skin 2 MPa, for scar 7 MPa, and for cartilage 5 MPa making differentiation of these tissue components possible by imaging and vibrational OCT studies. Using this calibration curve and OCT images of tissues allows for the analysis of tissue components in vivo.
Discussion
The ability of medical scientists and implant designers to image and measure the mechanical properties of both host tissue and implants is needed to understand why failures occur in hernia, vascular and orthopedic applications. It has been reported that about one third of hernia grafts fail by mechanical mismatches that occur at the grafthost interface [3]. In addition, intimal hyperplasia and graft stenosis occurs in vascular prostheses also due to mechanical mismatches [1,2,15]. Aseptic loosening that occurs in orthopedic implants involves mechanical mismatches between the host and implant when there is a space between the implant and bone [1,2,15]. All of these conditions are mitigated by matching the moduli at the graft-host interface since this will limit up-regulation of mechanotransduction [15]. Much progress has been made in understanding the strain-rate dependence, strain dependence, non-linearity and compressibility of soft tissues [5,8-15].
The use of VOCT to identify the differences between skin and scar tissue in vivo has been recently reported [13]. The correlation between modulus measurements made on extracellular matrix components measured using standard tensile testing in vitro and vibrational OCT in vitro suggests that measurements made using vibrational OCT give results that are consistent with tensile testing, a “gold standard method” for measuring mechanical properties of tissues [8-14]. Comparison to a standard technique is required to interpret moduli measurements made with new methods such as VOCT. In addition, modulus measurements made at the frequency where the maximum displacement occurs (resonant frequency) are almost purely elastic [8] and therefore represent a “materials constant” at a particular strain.
The ability to image tissues in vivo and measure the modulus using VOCT will allow the identification of individual tissue components and stress concentrations that occur at interfaces. The ability to identify collagen, elastic tissue and fat in different ECMs based on images and moduli measurements provides a method to evaluate tissue histology and mechanics without having to sacrifice animals or to do tissue biopsies. As shown in Figure 6, the modulus of fat (0.03 MPa) is much lower than that for elastic tissue (0.8 MPa), collagen in skin (2.0 MPa) and femoral cartilage (5.2 MPa). If the moduli for fat, elastic tissue, decellularized dermis and cartilage are plotted versus the ratio of resonant frequency and tissue thickness for skin and scar tissues, it is possible to see that each of these tissues has a characteristic ratio of resonant frequency per unit thickness.. Based on the data shown in Table 2 it is possible to determine the macromolecular components present in soft tissues from the calculated modulus.
Stress concentrations at the interface between tissues and implants arise from the modulus matches that occur when polymers and metals are in contact with tissues. While skin and other soft tissues operate with modulus values between 0.5 and 5.2 MPa under physiologic conditions [16-19], polymers have moduli between 56.5 MPa and 2000 MPa [20-22] and metals have moduli up to 250,000 MPa [22,23]. These modulus mismatches must be carefully considered if implant failure occurs such as in hernia repair.
Conclusion
Use of VOCT to image and determine the moduli of both host tissues and implants will lead to limiting modulus mismatches that contribute to implant failure. In addition use of this technique will minimize the need to sacrifice animals in pre-clinical studies and reduce the number of biopsies needed to do differential diagnosis in the clinic since observations of tissue structure and properties can be made non-invasively.
References
- Silver FH (1994) Biomaterials, Medical Devices and Tissue Engineering: An Integrated Approach Chapman and Hall, New York, United States of America.
- Silver FH, Christiansen DL (1999) Biomaterials Science and Biocompatibility, (1st edtn), Springer-Verlag, New York, United States of America.
- Deegan CR, Lake SP (2017) Mechanical properties of the abdominal wall and biomaterials utilized for hernia repair. J Mech Behav Biomed Mater 74: 411-427.
- Dunn MG, Silver FH (1983) Viscoelastic behavior of human connective tissues: Relative contribution of viscous and elastic components. Conn Tis Res 12: 59-70.
- Silver FH, Shah R (2016) Measurement of mechanical properties of natural and engineered implants. J Tissue Eng Regen Med 1.
- Yamada H (1970) Strength of Biological Materials. (1st edtn), Williams and Wilkins, Baltimore, Maryland, United States of America.
- Fung YC (1993) Biomechanics: Mechanical Properties of Living Tissue. (2nd edtn), Springer, New York, United States of America.
- Shah RG, Silver FH (2017) Viscoelastic behavior of tissues and implant materials: Estimation of the elastic modulus and viscous contribution using optical coherence tomography and vibrational analysis. J Biomed Tech Res 3:105-109.
- Silver FH, Shah RG (2017) Analysis of mechanical behavior of composite tissues using vibrational optical coherence tomography. World Journal of Mechanics 7: 271-282.
- Shah RG, Pierce MC, Silver FH (2017) Morphomechanics of dermis-A method for non-destructive testing of collagenous tissues. Skin Res Tech 23: 399-406.
- Shah RG, DeVore D, Pierce MG, Silver FH (2017) Vibrational analysis of implants and tissues: calibration and mechanical spectroscopy of multi-component materials. J Biomed Mater 105: 1666-1671.
- Silver FH, Silver LL, Shah RG (2017) Viscoelastic behavior of allografts and scaffolds composed of extracellular matrices. Adv Tiss Eng Regen Med 2.
- Shah RG, DeVore D, Silver FH (2018) Biomechanical analysis of decellularized dermis and skin: Initial in vivo observations using optical cohesion tomography and vibrational analysis. J Biomed Mat Res Part A 106: 1421-1427.
- Shah RG, Silver FH (2017) Vibrational analysis of extracellular matrix scaffolds: comparison of skin, dermis, cartilage and subchondral bone. Adv Tiss Eng Regen Med 2.
- Silver FH (2006) Mechanosensing and mechanochemical transduction in extracellular matrix. Springer, New York, United States of America.
- Silver FH, Snowhill PB, Foran DJ (2003) Mechanical behavior of vessel wall: SA comparative study of aorta, vena cava, and carotid artery. Ann Biomed Eng 31: 793-803.
- Sun MT, Pharm DT, O’Connor AJ, Wood J, Casson R, et al. (2015) The biomechanics of eyelid tarsus tissue. J Biomech 18: 3455-3459.
- Yoder JH, Elliott DM (2010) Nonlinear and anisotropic tensile properties of graft materials used in soft tissue applications. Clin Biomech 25: 378-382.
- Griffin MF, Premakumar Y, Seifalian AM, Szarko M, Butler PEM (2016) Biomechanical characterization of thee human aricuar cartilage. Annals Biomed Eng 44: 3460-3467.
- Huang YF, Xu JZ, Li JS, He BX, Xu L, et al. (2014) Mechanical properties and biocompatibility of melt processed self-reinforced ultrahigh molecular weight polyethylene. Biomaterials 35: 6687-6697.
- Hasegawa M, Azuma T (1979) Mechanical properties of synthetic arterial grafts. J Biomechanics 12: 509-517.
- Shumigin D, Tarasora E, Meier P (2011) Rheological and mechanical properties of poly(lactic) acid/cellulose and LDPE/cellulose composites. Materials Science 17: 32-37.
- Mantripagada VP, Lecka-Czernick B, Ebraheim NA, Jayasuriya AC (2013) An overview of recent advances in designing orthopaedic and craniofacial implants. J Biomed Mat Res 101A: 3349-3364.