Research Article, J Appl Bioinforma Comput Biol Vol: 8 Issue: 1
Utilizing Artificial Intelligence as a Dengue Surveillance and Prediction Tool
Bala Murali Sundram1*, Dhesi Baha Raja1, Fazilah Mydin2, Ting Choo Yee3, Kamesh Raj1 and Fadzilah Kamaludin1
1Institute for Medical Research, Ministry of Health, Malaysia
2Penang State Health Department, Ministry of Health, Malaysia
3Multimedia University, Cyberjaya, Malaysia
*Corresponding Author: Dr Bala Murali Sundram
Public Health Specialist, Institute of Medical Research, Ministry of Health Malaysia, Jalan Pahang, Kuala Lumpur, Malaysia
Tel: +603-26162666;
E-mail: bms78@gmail.com
Received: May 02, 2019 Accepted: May 16, 2019 Published: May 23, 2019
Citation: Sundram BM, Raja DB, Mydin F, Yee TC, Raj K (2019) Utilizing Artificial Intelligence as a Dengue Surveillance and Prediction Tool. J Appl Bioinforma Comput Biol 8:1.
Abstract
Objectives: A major challenge in passive surveillance is that an outbreak has often occurred before it is recognized. The main purpose of this study is to determine how well an artificial intelligence mediated system can improve the quality of Malaysia’s dengue surveillance system. In particular, the focus of the study was to evaluate the effectiveness of a real-time surveillance system in dengue case detection and prediction of future outbreaks.
Methods: A feasibility study was conducted in the state of Penang by incorporating artificial intelligence and machine learning capabilities to geo-locate and determine future dengue outbreaks. This decision-making tool supports data entry, retrieval, storage and analysis for dengue vector management and promotes the execution of dengue control programs that are designed, evaluated and refined based on locally gathered evidence.
Results: The system predicted 37 outbreaks up to 30 days in advance, geo-locating them up to 400 metres radius. This prediction was then cross-validated with the Penang State Health Department dengue reports in which 30 outbreaks occurred within the predicted period. The prediction accuracy of this console was 81.08%.
Conclusion: The Bayesian network system has the potential to report & predict the next dengue outbreaks in real-time. It incorporates user-friendly functionalities for data entry or input, data storage, data query, case and disease outbreak mapping, reporting, advance outbreak predictions and even suggested vector control management. This network system is anticipated to improve the current dengue surveillance, intervention monitoring and evaluation of the overall dengue vector control program performance.
Keywords: Artificial Intelligence; Bayesian Network; Dengue Surveillance; Disease Prediction; Outbreaks
Introduction
Dengue has been cited as the most important arthropod-borne viral disease of humans, with an estimated 2.5 billion people globally at risk [1-3].In Malaysia, dengue is perceived as a perennial public health concern with escalating trend of infection from the year 2000. In 2014, Malaysia had suffered an increment of 250% infections alone, since the first dengue epidemic in Penang in 1901 [4,5].
An efficient dengue surveillance system should be capable to identify and forecast dengue outbreaks with a good accuracy. In Malaysia and other dengue endemic countries, passive disease surveillance is the backbone of dengue routine reporting [6-9]. However the challenge in passive surveillance is that an outbreak has often reached or passed its peak before it is recognized. The opportunities for control are missed if the health officials are not vigilant and the present dengue surveillance comes with timedelays and lack of sensitivity with no real-time notifications or outbreak predictions [10,11]. Therefore, an early warning system by incorporating artificial intelligence (AI) is timely to make a shift from prescribed to adaptive strategies for dengue surveillance [12].
Methods
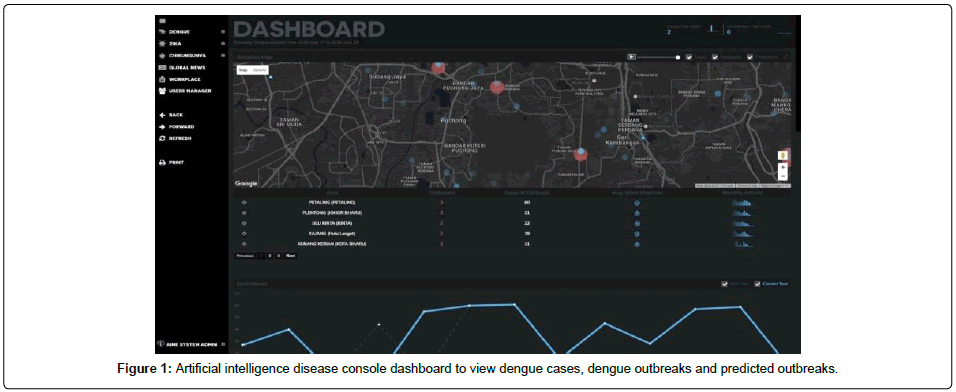
Artificial intelligence in Medical Epidemiology (AIME) system software package is a decision-making tool that supports data entry, retrieval, storage and analysis for dengue vector management. We used theC#, R, HTML, CSS, and JS programming language to realize the machine learning and deep learning algorithm of the system. A broad range of information including entomological, epidemiological, spatial and temporal data is utilized and then georeferenced and stored in a data warehouse called REDINT (Remote Data Input Interface). Output from the analyses can be produced in forms of maps, models and tables. Prediction is done by machine learning algorithm (logistic regression, regression analysis, etc.), with supervised and unsupervised learning algorithm [13,14]. An efficient use of AIME would allow the relevant program managers to respond to dengue cases by planning and initiating timely disease control operations at the local level (Figure 1).
Currently the AIME console is able to predict dengue outbreaks up to 3 months in advance and geo-locating them up to 400 meter radius.It is a multi-console system developed by using programming languagewhich involves responsive web applications with several interfaces, all connected through the same backbone database, scalable by design and modular. The use of the console starts when the dengue cases are reported to “Health Centres” (Hospitals and Clinics). AIME optimizes the reporting capabilities of health centres, by providing user interfaces which have been designed taking into consideration the behaviour of the users. The console is user-friendly with a simple interface. Once a case enters the system, AIME will gather 276 data points that will be used for prediction of outbreaks, calculation and update of outbreaks, calculation of epidemiology links and weather updates for outbreak control.
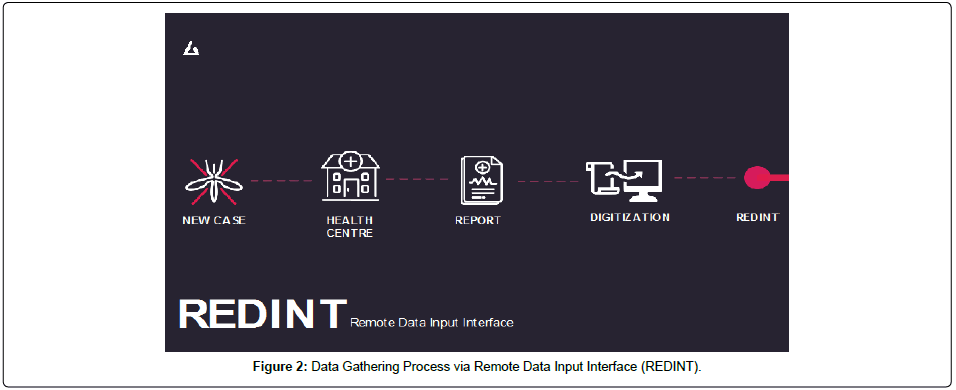
The system will analyse and calculate the above outputs in less than 23 seconds. Figure 1 explains the user interface of AIME Console. Red bubbles show predicted dengue outbreaks and blue bubble represent dengue cases in a particular area with meteorological and geographical information in real time.This data gathering process is done by AIME’s subsystem- REDINT which is accessed by every hospital in the community that will give the ability to update and report dengue cases in a first-in-first-out manner directly to the public health municipality, instead of waiting long periods of time to report cases, improving further analysis (Figure 2). REDINT will than gather data relevant to cases, outbreaks, epidemiology links, predictions and etc. Further analytics include:
1. Data Analytics Interface (DAI): Accessed by public health officials. The interface would present dynamic tools that will allow for a fast analysis of multiple cases, outbreaks and hotspots. Dynamic graphs updated in real time by the REDINT; case/outbreak comparison; daily, weekly, monthly, yearly comparison, alert notification system, case mapping, as well as time-series analysis.
2. Data Prediction Interface (PINT): Providing our field-tested algorithm, improved to automatically incorporate the data obtained by REDINT.
3. User management and operation management interfaces (UMI and OMI): To oversee and report the actions taken by the public health officials.
Data import
The system includes extensive capacity for data import, including import of excel spread sheets from the existing e-Dengue notification platform that include entry of the notified individual disease cases and related demographic details. This allows the user to rapidly populate the system with historical data. In terms of data quality process assessed by AIME system, it should be noted that the data entry and import process can be misinterpreted when it comes to entry of poor quality data. Therefore, it will be necessary to clean historical data that originates from the e-Dengue platform before importing the data into the AI system, for dengue outbreak prediction purposes. Thus, it becomes important that all personnel executing data imports also have a working knowledge of the corresponding manual data entry functionalities in the system. The data import/export functionality also allows for linkage to existing health information systems by import or export of relevant disease case data. Initial incompatibility issues are expected but this is rectified, by self-checking and evaluation by system.
Statistical and spatial analysis capacity
The system was developed primarily as a tool for operational public health measures. The AIME system has the potential of producing spatial and temporal patterns of dengue disease outbreaks as well as applying real-time analysis to explore these disease patterns, whether in terms of a single case, cluster or outbreaks. The AIME system is also able to suggest the best form of vector control measures to contain the spread of dengue disease in a locality.
Preliminary case study in Penang, Malaysia
This prospective study was conducted in Penang, Malaysia from 1st May 2017 – 10th June 2017. A purposive sampling was done since Penang state had volunteered to pioneer and sustain the cost of the preliminary study. Penang is a geographically heterogeneous area that consists of urban, suburban districts and rural areas.
For this study, dengue case data was obtained from the Vector Borne Disease Control Division, Penang State Health Department through their online e-dengue system. Passive surveillance is the routine notification of diseases by the state or local health departments to the federal disease control division based on the standardized reporting forms when cases of disease are detected. Data on dengue cases which occurred between 1st May 2017 and 10th May 2017 were used as reference data for AIME to predict the next dengue cases for the rest of study period from 11th May 2017 to 10th June 2017 (Figure 3).
The AIME console technological platform provides different set of solutions and tools specifically targeted for the analysis of public health datasets:
i. Pre-defined RelationalDatabase Schema; This schema includes properties, constraints, keys and an expansible design that allows for Data Collection, Cleaning, Data Processing, Data Analysis and Visualizations specifically for public health purposes.
ii. Ready-to-use Application Programming Interfaces (APIs): The API suite of the AIME console is part of their core and backbone data gathering tool, called REDINT. For each disease case which is introduced into the system, REDINT automatically searches through more than 90 different databases for 276 different variables. For this study, all of the 276 different variables collected by REDINT were used. These variables range from different categories, specifically obtaining weather data, geographical data, socioeconomic data and historic epidemiological data.
iii. Advanced Search capabilities: The AIME console allows its users to easily search through the database and obtain visualizations and charts based on the data, by a web-based graphics interface.
iv. Security: All data is shown in the researcher’s server or account, and no sensitive data is sent outside the platform to another party. For this study, the researchers utilized the AIME console in the following manner:
a. Import all dengue case data from 2014 to 2017 into the AIME console, by using the “Import from Excel” capabilities of the database of the AIME console, which itself has algorithms and procedures to automatically clean the data which is being input, hence no data cleaning actions were taken by the researchers, but by the platform itself.
b. After the import, the AIME console, through the REDINT platform, searches all the different data points.
v. Data analysis by the medical and data scientists/researchers.
vi. Analysis of results.
Data collection
Firstly, historical dengue data from the year 2014 until the study period was uploaded into the AIME system for all the localities in Penang. Next, daily data was reported and monitored until the completion of this study. Data points reported by the Penang health officials in the e-Dengue platform were as follows:
Notification number, Case number, Onset date, Notification date, Locality (Current address), Zone (Current address), Sector (Current address), District (Current address), Areas (Current address), State (Current address), Type of case, Disease number, Registration date, Disease Status, Age (Month), Age (Year), Treatment registration number, Epid Week (Onset date), Patient name, Identification/ travel document number, House number, Postcode, Latitude(ISO), Longitude (ISO), Administrator, Last status of case, Race, Citizenship status, Country of origin, Entry status, Gender, Sub-Diagnosis, Notification input date, Case status, Hospital Admission/treatment, Diagnosis date, Notification information facility, First Search and Destroy activity date, First SRT activity date, First ULV activity date, Epid Year (Registration date), Epid week (Registration date), Epid week (Notification date), Work category, Work, Work name, Address of Work, Status of locality administration, Locality status, AST test, ALT test, Serotype test, Rapid test, ELISA test, PCR test, HB test, Hess’s Test, Pack Cell Volume Test (%), Platelet Count Test, White Blood Count Test (per mm3), Case investigation date, Main factor for death, Health facility, Type of health facility, Fever, Headache, Eye irritation, Body pain, Nausea or Vomiting, Rash, Abdominal pain, Mild bleeding symptom, Diarrhoea.
The AIME system also captured the following features from the data received from the authorities:
Date Of First Symptom, User Id, Confirmed case, Patient Number, Creation Date, Admission Date, Date Of Birth, Sex, Ancestry Type, Diagnosis, Symptom Fever, Symptom Headache, Symptom Retro Orbital Pain, Symptom Arthralgia, Symptom Nausea Or Vomiting, Symptom Rash, Symptom Abdominal Pain, Symptom Mild Bleeding, Symptom Diarrhea, Street, Neighborhood, Locality or Area and Zip Code.
In total, this study analyzed 11,598 different dengue cases, and by using AIME’s REDINT capabilities, the study produced 276 different data points for each dengue case, totaling 3,201,048 different data points.
Data analysis
After finalizing data collection through the REDINT system, data was manipulated in a number of different ways, such as plotting, finding correlations and creating a pivot table. A pivot table allows researchers to sort and filter data by different variables and later calculate the mean, maximum, minimum and standard deviation of different data columns. These manipulations were done in order to create new sets or columns of data that could enable the creation of a more robust prediction algorithm. The AIME console model was validated based on the WHO criteria for dengue outbreaks [15]:
i. A dengue outbreak happens when the two (2) following criteria are met:
In a span of 14 days, two or more Dengue Cases happen. This is verified by using the Onset (or Date of First Symptom) date.
The distance between each of the cases that met criteria #1 is four hundred meters or less (≤ 400 m).
ii. An Index Case: This is the case with the oldest date in the outbreak.
iii. An Outbreak Epicenter, which will be localized in the same location as the Index Case.
iv. An N number of Outbreak Cases: All cases in an outbreak which are not the Index Case. Mathematically, for the occurrence of an outbreak, N will always be one (1) or higher, in other words:
a) N ≥ 1
b) Where N is the number of Outbreak Cases in an outbreak
v. A Begin Date: This is the date of the Index Case.
vi. An End Date: This is the date of the newest case, or the date of the Outbreak Case which occurred last.
As the data received was Case Data and not Outbreak Data, outbreak calculation and creation were automatically analysed by the REDINT platform in AIME. For each case in the database, REDINT would analyse the following actions:
1. Check if there are any other cases that happened within 14 days of the current case, using the [Date of First Symptom] variable.
2. If there are any cases with the above criteria, REDINT verifies the surroundings of the current case by examining if there are other cases between 400 meters of the current case. The same verification is done to verify if there are already existing outbreaks within 400 meters of the current case.
3. If the above criteria are met, one (1) of the following will happen. A new Dengue Outbreak database object is created, with the following properties:
A One-To-One Relationship with a Case, which will be the Index Case of that outbreak;
i. Multiple One-To-Many Relationships, with the Dengue Outbreak database object and all of the other cases which are not the Index Case, which are the Outbreak Cases of the new outbreak.
ii. A Begin Date, which will be the [Date of First Symptom] of the Index Case.
iii. An End Date, which will be the [Date of First Symptom] of the newest Outbreak Case.
a) The current case would be added to an existing outbreak, and the REDINT system would verify and, if necessary, update any of the following properties of the outbreak: Index Case, Begin Date, and End Date. The outbreak object relationships may also change, with an outbreak changing their Index Case happening often, until all of the database cases are analyzed.
b) Both (a) and (b) may happen, with a case triggering both: The creation of a new outbreak and the update of others.
This study analysed all the variables obtained by REDINT and the data collected to predict whether a new case will trigger the creation of a new outbreak. For this, the following data was also extracted from the AIME console:
For each single case:
a) Boolean variable that will be TRUE if the case is an Index Case, false otherwise.
b) Boolean variable that will be TRUE if the case is an Outbreak Case, false otherwise.
c) Integer variable that identifies the amount of outbreaks which the current case plays a role, either as an Index Case or as an Outbreak Case.
Model selection-Bayesian network construction
In our work, we applied Bayesian Networks learning algorithm to identify the association between a dengue case, a dengue outbreak and the various indicators investigated. Bayesian Networks are a specific type of graphical model. To be specific, Bayesian Networks are directed acyclic graphs. It relies on Bayesian inference for probability computations. By leveraging on Bayesian Networks, conditional dependence among the variables can be modeled. In addition to that, causation, which is the central part of Bayesian Networks, can be represented via the arcs and conditional probabilities. Through these relationships, diagnostic and predictive modeling via Bayesian Networks can be performed easily.
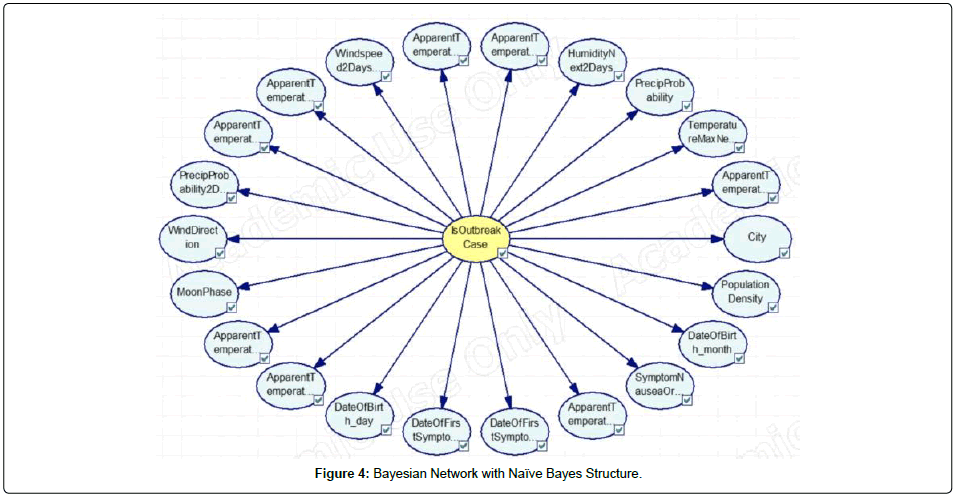
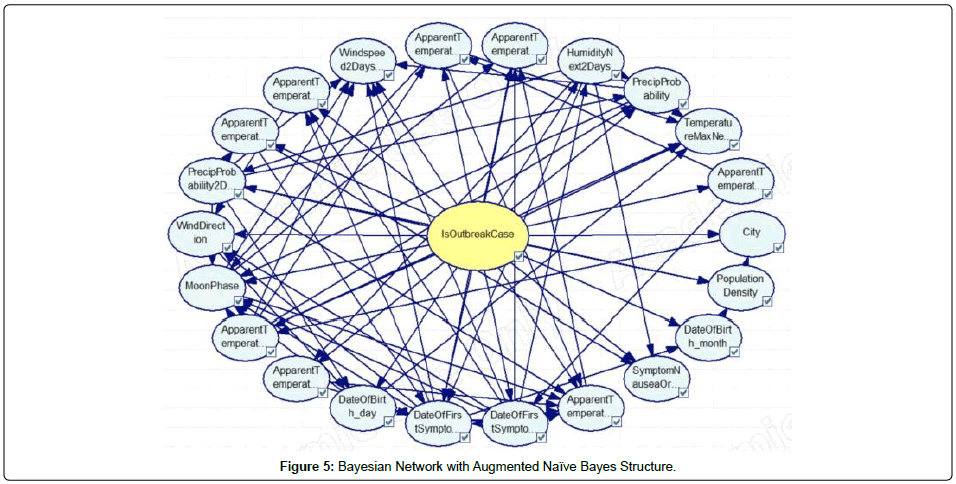
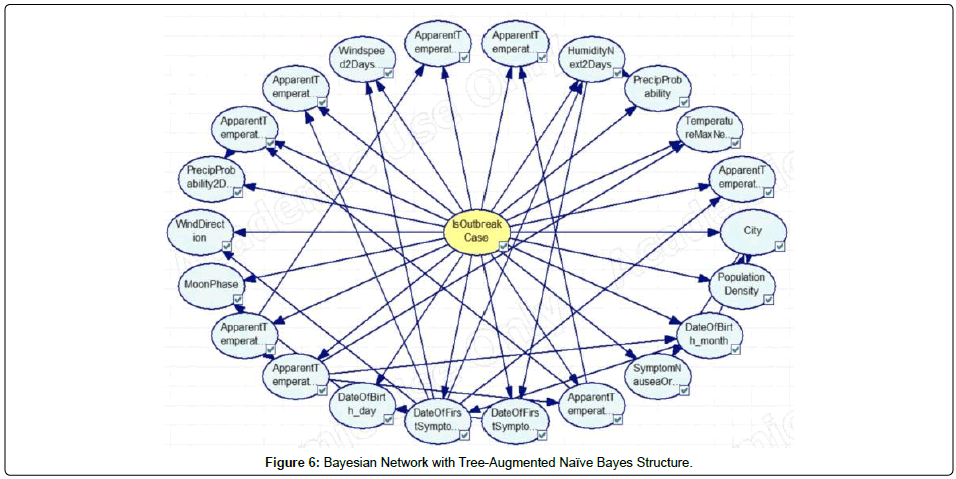
In this study, Bayesian Networks were deployed for modeling of dengue outbreak in Penang. Different types of Bayesian Networks were constructed before the optimal network structure can be determined. This research work constructed and evaluated three different variants of Bayesian Network, namely, Naïve Bayes, Augmented Naïve Bayes, and Tree Augmented Naïve Bayes. As shown in Figures 4, 5 and 6, the Bayesian Networks constructed depict the same structure in which the node at the center represents the class node (i.e. is Outbreak Case) and the arcs pointing out from the class node are the respective variables utilized in the model. The main difference between the three Bayesian Networks is that no arcs pointed among the evidential nodes (i.e., non-class nodes) in the Naïve Bayes network, whilst the nodes were pointed among the evidential nodes in the other two versions of the augmented Naïve Bayes networks. In this research work, the tool used for Bayesian networks construction is GeNie (Figures 4, 5 and 6).
Results and Discussion
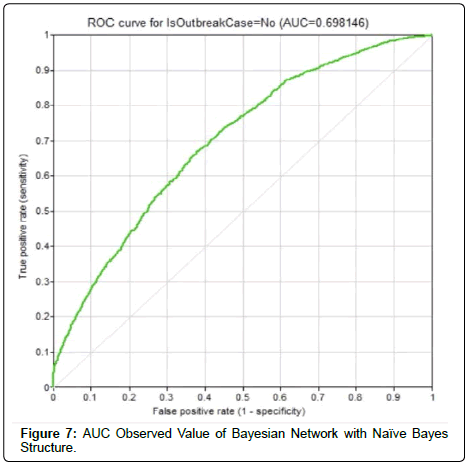
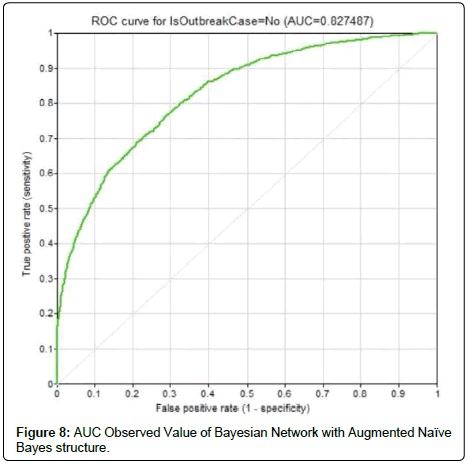
In this research work, the constructed Bayesian networks were 10- fold cross-validated. The average accuracy of Bayesian Network with Naïve Bayes structure depicted an accuracy of 65.8% with AUC observed value of 0.698 (Figure 7). The confusion matrix for outbreak prediction is as in (Table 1).As for Bayesian network with Augmented Naïve Bayes structure, the average accuracy was 76.4% with the confusion matrix in (Table 2). The AUC reported the highest value among the three Bayesian networks (0.827), as in (Figure 8).The third Bayesian network created was following the Tree-Augmented Naïve Bayes structure. It reported an accuracy of 71.9% and was ranked second among the three networks. The confusion matrix is shown in (Table 3).Bayesian networks can be a solution to dengue outbreak prediction. The network that takes the structure of Augmented Naïve Bayes depicted the highest accuracy. This is largely because this network structure had successfully captured the dependencies between the evidential nodes.
| Predicted | |||
|---|---|---|---|
| Actual | no | yes | |
| no | 1106 | 1205 | |
| yes | 849 | 2852 | |
Table 1: Confusion Matrix of Bayesian Network with Naïve Bayes Structure.
| Predicted | |||
|---|---|---|---|
| Actual | no | yes | |
| no | 1387 | 924 | |
| yes | 495 | 3206 | |
Table 2: Confusion Matrix of Bayesian Network with Augmented Naïve Bayes structure.
| Predicted | |||
|---|---|---|---|
| Actual | no | yes | |
| no | 1166 | 1145 | |
| yes | 543 | 3158 | |
Table 3: Confusion Matrix of Bayesian Network with Tree-Augmented Naïve Bayes structure.
Conclusion
Generally, Bayesian networks are computationally difficult when exploring a previously unknown network. To calculate the probability of any branch of the network, all branches must be calculated. While the resulting ability to describe the network can be performed in linear time, this process of network discovery is an NP-hard task which might either be too costly to perform, or impossible given the number and combination of variables.
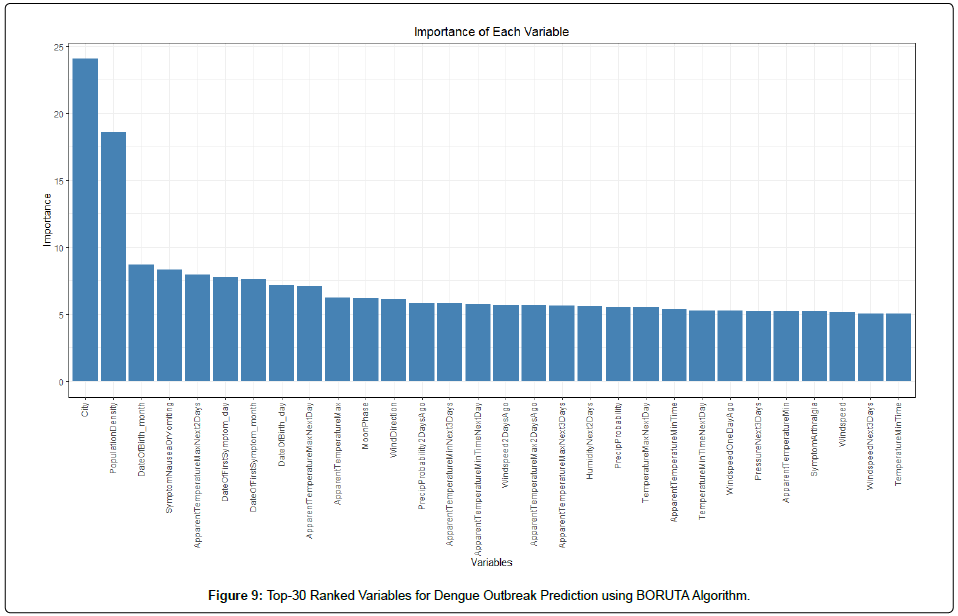
As a result, one of the main challenges in this project is handling the large dataset dimension that consists of 276 variables. Such large dimension has introduced complexity in creating an accurate predictive model. To overcome this challenge, this study first applied feature selection algorithm to reduce the dimension by determining the important features that contribute to the accuracy of predictive model. In this study, the feature selection algorithm used was BORUTA [16]. BORUTA algorithm is a wrapper built around the random forest classification algorithm. It tries to capture all the important, interesting features in the dataset with respect to an outcome variable.Empirical studies were conducted and the final 94 features were selected by BORUTA. The Top-30 ranked features with respect to prediction of outbreak can be seen in (Figure 9). It shows that the City variable plays the most crucial role in predicting outbreaks, followed by Population Density. Figure 9 also shows the consistent drop in the Top-30 ranked features, after City and Population Density.
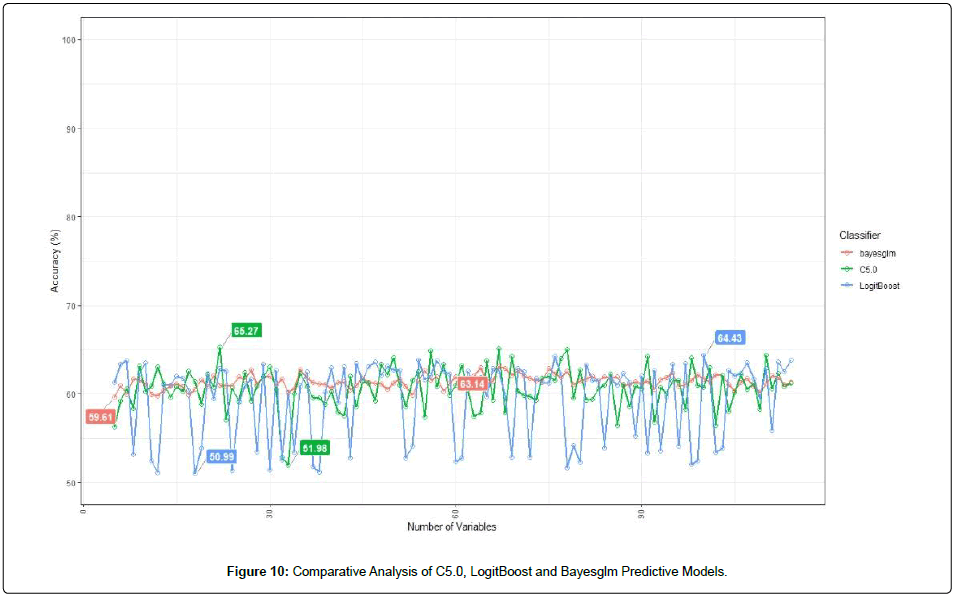
Although BORUTA algorithm aimed at reducing the dimension of dataset, the number of features extracted remained large (N=94). Therefore, studies were conducted to further investigate the optimal feature subset that depicts the highest importance. Iterative construction of predictive models were performed, starting from feature n=5 until n=94. That is, for every n, there is a predictive model. In this study, three predictive models were deployed, namely C5.0, LogitBoost and Bayesglm. The total experiments performed were 270, from which one feature subset was determined. Figure 10 shows the accuracies depicted by the three different models. Comparatively, Bayesglm depicted less fluctuation in predictive accuracy as compared to C5.0 and LogitBoost. Conversely, LogitBoost showed the largest difference in top accuracy (64.43%) and lowest accuracy (50.99%) (Figure 10). In general, C5.0 depicted the highest amount among the three predictive models, with the optimal accuracy of 65.27%. Such optimal accuracy translated to 22 features or variables. The features/ variables are listed below:
City,
Population Density,
Date of Birth month,
Symptom Nausea or Vomiting,
Apparent Temperature Max Next 2Days,
Date of First Symptom_day,
Date of First Symptom_month,
Date of Birth_day,
Apparent Temperature Max Next Day,
Apparent Temperature Max,
Moon Phase,
Wind Direction,
Precip Probability 2Days Ago,
Apparent Temperature Min Next 3 Days,
Apparent Temperature Min Time Next Day,
Wind speed 2Days Ago,
Apparent Temperature Max 2Days Ago,
Apparent Temperature Max Next 3 Days,
Humidity Next 2 Days,
Precip Probability,
Temperature Max Next Day,
Apparent Temperature Min Time
Findings from this preliminary study can contribute into improving vector surveillance strategies in Malaysia and other dengue endemic countries. Extrapolation of these preliminary findings should be carefully made though, due to its short prediction period of only 1 month. However, work is underway to implement this system for a longer duration so that it can serve as evidence to justify the use of AI in dengue vector programmes to further assist policy makers in providing evidence-based public health measures in Malaysia.
Utilizing this definition, evidence-based practices in dengue vector surveillance can be exemplified through the use of AI [17,18]. This system has the potential to report & predict the next dengue outbreaks in real-time, with adaptation by the user to local circumstances. Through operational implementations of thisAI system, we anticipate that the use of the system will lead to improved continuous dengue surveillance, intervention monitoring and evaluation of the vector control program performance. While there are no claims of perfection for this AI-mediated system, it does offer a disruptive technology that will hopefully reduce the dengue disease burden.
Funding
This research did not receive any specific grant from funding agencies in the public, commercial or not-for-profit sectors.
Acknowledgements
We thank the Director General of Health Malaysia for the permission to publish this paper as well as the Penang State Health Department for their cooperation and assistance with data collection. The authors would like to extend their gratitude for the technical assistance given by Mr Rainier Mallol in regards to the software development. The authors would also like to acknowledge the support from the Public Health Division of Ministry of Health, Malaysia in this study.
References
- WHO (2009) Dengue guidelines for diagnosis, treatment prevention and control, World Health Organization,Geneva,Switzerland.
- Bhatt S, Gething PW, Brady OJ (2013) The global distribution and burden of dengue. Nature 496: 504–507.
- Guzman MG, Halstead SB, Artsob H, Buchy P, Farrar J, et al. (2010) Dengue: a continuing global threat. Nature Rev Microbiol 8: S7–S16.
- Mia S, Begum RA, Er AC, Abidin RD, Pereira JJ (2013) Trends of dengue infections in Malaysia 2000-2010. Asian Pac J Trop Med 6: 462-466.
- Skae FMT (1902) Dengue fever in Penang. British Med J 2 : 1581-1582.
- Runge-Ranzinger S, Horstick O, Marx M , Kroeger A (2008) What does dengue disease surveillance contribute to predicting and detecting outbreaks and describing trends? Trop Med Int Health 13: 1022-1041.
- Eisen L, Lozano-Fuentes S (2009) Use of mapping and spatial and space-time modeling approaches in operational control of Aedesaegypti and dengue. PLoS Negl trop Dis 283: 411.
- Vazquez-Prokopec GM, Chaves LF, Ritchie SA, Davis J, Kitron U (2010) Unforeseen costs of cutting mosquito surveillance budgets. PLoS Negl Trop Dis 4: 858.
- Azil AH, Ritchie SA, Williams CR (2015) Field worker evaluation of dengue vector surveillance methods: factors that determine perceived ease, difficulty, value, and time effectiveness in Australia and Malaysia. Asia Pac J Pub Health 27: 705-714.
- Ooi EE, Gubler DJ (2009) Global spread of epidemic dengue: the influence of environmental change. Future Virology 4: 571-80.
- Suaya JA, Shepard DS, Beatty ME (2007) Dengue: burden of disease and costs of illness. Scientific Working Group: Report on dengue Geneva: WHO.
- Runge-Ranzinger S, Horstick O, Marx M, Kroeger A (2008) What does dengue disease surveillance contribute to predicting and detecting outbreaks and describing trends? Trop Med Int Health 13: 1022-1041.
- Scott TW, Morrison AC (2008) Longitudinal field studies will guide a paradigm shift in dengue prevention', Vector-borne diseases: understanding the environmental, human health, and ecological connections. Workshop summary, The National Academies Press, Washington DC 132-149.
- Lin K, Luo J, Hu L, Hossain MS, Ghoneim A (2017) ‘‘Localization based on social big data analysis in the vehicular networks,’’. IEEE Trans Ind Informat.
- World Health Organization (2016) Technical handbook for dengue surveillance, outbreak prediction / detection and outbreak response.
- Kursa MB, Jankowski A, Rudnicki WR (2010) Boruta-A System for Feature Selection. FundamentaInformaticae 101: 271-285.
- Brownson RC, Baker EA, Deshpande AD, Gillespie KN (2017) Evidence-based public health. Oxford University Press.
- Brownson RC, Gurney JG, Land GH (1999) Evidence-based decision making in public health. J Pub Health Manage Pract 5: 86-97.
 Spanish
  Chinese
  Russian
  German
  French
  Japanese
  Portuguese
  Hindi
Hindi 