Research Article, J Immunol Tech Infect Dis Vol: 11 Issue: 4
A flow cytometry gating strategy for profiling CD4+CD25+/high CD127-/low regulatory T cells in the Rheumatoid Arthritis scenario.
Ricardo Martínez Rosales*, Ana Campal Espinosa, Amalia Vasquez Arteaga, Sheila Chavez Valdes, Gilda Lemos Perez and Celia del Carmen Crespo Oliva
Department of Haematology, Christian Medical College, Vellore, Tamil Nadu, India
*Corresponding Author: Martínez Rosales
Department of Haematology,
Christian
Medical College,
Vellore,
Tamil Nadu,
India,
Tel: + 53871261;
E-mail: ricardo.martinez@cigb.edu.cu
Received date: 15 June, 2022, Manuscript No. JIDIT-22-66655; Editor assigned date: 17 June, 2022, PreQC No JIDIT-22-66655 (PQ); Reviewed date: 01 July, 2022, QC No. JIDIT-22-66655; Revised date: 29 August, 2022, Manuscript No. JIDIT-22-66655 (R); Published date: 07 September, 2022, DOI: 10.4172/2329-9541.1000332
Citation: Rosales RM, Espinosa AC, Arteaga AV, Valdes SC, Perez GL, Oliva CDCC (2022) A Flow Cytometry Gating Strategy for Profiling CD4+CD25+/highCD127-/low Regulatory T Cells in the Rheumatoid Arthritis Scenario. J Immunol Tech Infect Dis 11:4.
Abstract
Regulatory T cells (tregs) has been consider as a potential biomarker in rheumatologic clinical trials as this cell population has been shown to be involved in the autoimmune diseases outcome. Human tregs are defined as CD4+CD25+/ highCD127-/low cells; however its accurate identification by flow cytometry has been argued, especially as a result of different gating strategies. A flow cytometry gating strategy was settled to measure human Tregs from PBMC isolated via density gradient using CPT tubes. With this method we performed a standardized procedure for treg profiling, useful for immunomonitoring in clinicals assessment.
Keywords: Tregs; Flow cytometry, Gating strategy, Immunomonitoring, Regulatory T cells
Introduction
Chronic autoimmune disorders, including Rheumatoid Arthritis (RA), are characterized by a disturbed balance between effector and regulatory immune responses [1]. In RA, an extended inflammatory reaction leads to severe tissue damage and further physical function disability [2]. Here is the importance of enhancing autologous immunosuppressive mechanisms to promote immune homeostasis. In this regard, several authors remark on the key role of Treg cells in autoimmune disease outcomes [3]. This cell population is well known for modulating the immune system by repressing an exacerbated inflammatory response toward self-antigens [4]. Previous data report the bad prognosis in Collagen Induced Arthritis (CIA) mouse model disease course, in a context of tregs deprivation. In this model, a reduction in the proportion of Tregs following treatment with anti- CD25 antibody aggravated arthritis, whilst injection of Tregs had a contrary effect [5]. Additionally, Avdeeva, et al. reported that responsiveness to therapy with Methotrexate (MT), the “gold standard” of RA pharmacotherapy was related to augmentation of Treg population in patients with early onset, suggesting treg as a decisive biomarker for determination of treatment effectiveness in disease resolution [6]. Therefore, given the role of Tregs in autoimmunity, monitoring this subset of T lymphocytes in therapeutics trials could be a promising tool in predicting the course of RA treatment.
Human treg cells are defined as CD4+ T cells with a high expression of CD25 (interleukin (IL)-2 receptor α-chain). CD25+CD4+ treg cells also express the Foxp3 gene, a member of the Forkhead/winged-helix family of transcriptional regulators, recognized as the master regulator of the suppressive capability of treg cells [7]. Since Foxp3 identification requires intracellular staining which is rather time consuming, as an alternative staining strategy many authors recommend the CD127 surface marker (the α-chain of the IL-7 receptor), inversely correlated to FOXP3 expression. Consequently, CD4+CD25+CD127 low T cell is the phenotype identified for Treg cells with suppressive activity [8]. Although this phenotype is the most commonly used in Treg isolation through flow cytometry, identification of Treg cells can be controversial as a consequence of different gating strategies. This lack of homogenization strongly influences interassay discrepancies in flow cytometry based treg analysis. As a result, this hampers the accurate interpretation of the data and further clinical deductions [9]. Thus, to improve the precision and reliability of Treg evaluation, we implemented a gating strategy protocol for flow cytometry based treg isolation. The application of this method in our lab made a gating strategy possible and suitable for current and further clinical immunological evaluations [10].
Materials and Methods
Blood collection
In this study, a total of 41 patients classified with RA were included according to the ACR/ EULAR classification criteria. Additionally, 12 healthy volunteers were also incorporated. Peripheral blood samples from volunteers were obtained using 8 mL Cell Preparation Tubes (CPT) with sodium heparin (BD Biosciences) [11]. Each sample was processed within the first two hours after extraction and processed for PBMCs isolation via density gradient in CPT tubes. For blood samples collection, each donor signed informed consent [12].
Isolation of PBMC
Peripheral whole blood was collected into an 8 mL sodium heparinized CPT tube and inverted multiple times to ensure homogenization of the sodium heparin anticoagulant and blood. The sample was centrifuged at 1800 x g for 30 min at 21°C, resulting in the segregation of the homogenized into four visible layers: the upper layer corresponding to plasma with a cloudy band of PBMCs, the middle layer containing a think polyester gel, and the bottom layer containing erythrocytes and granulocytes [13]. After centrifugation, PBMCs were extracted and transferred into a 15 mL conical polystyrene tube, then CTS optimizer T-cell expansion SFM (Gibco, USA) was added to fill the 15 mL tube [14]. The capped 15 mL conical tube was mixed by inversion and centrifuged at 300 x g for 15 min at 4°C. The supernatant was decanted and the cell pellet was resuspended in 15 mL of optimizer T-cell expansion SFM and centrifuged for a subsequent 10 min at 300 x g at 4°C. Following this centrifugation step, the supernatant was decanted by inversion without disturbing the cell pellet, and the pelleted PBMCs were resuspended in 2 mL of Optimizer T-cell expansion SFM for further cell counting and viability assessment on the cytometer.
Flow cytometry staining and acquisition
For FACS analysis, aliquots of 85 μL containing 104-108 cells/mL were set per condition prior to addition of 5 μL of the selected antibody. The full stained panel set up was performed with: CD4-FITC (clone RPA-T4, 1 mL), CD25-PE (clone 2A3, 1 mL) and CD127-APC (clone HIL-7R-M21, 1 mL) from eBioscience, Ireland. Samples were incubated for 30 min at room temperature in the dark before centrifugation for 5 min at 250 x g at 4°C. Subsequently, the supernatant was removed to leave the pellet dried and the cells were resuspended in 1 mL Phosphate Buffered Saline (PBS) 1X and acquired on cytometer. All the experimental analysis was performed in a 13 multicolor CyFlow Space cell cytometer analyzer (SYSMEXPARTEC, Germany) equipped with FloMax 3.0 software (SYSMEXPARTEC, Germany). This device is equipped with a 50 mW blue solid state laser emitting at a wave length of 488 nm and also with a 25 mW red solid state laser emitting at a wave length of 640 nm. Data collection of fluorescein isothiocyanate (FITC) and Phycoerythrin (PE) was accomplished in photomultiplier with a band pass filter of 530 ± 30 nm, while the fluorescence of Allophycocyanin (APC) was determined in the photomultiplier with a band pass filter of 640 ± 30 nm. To avoid spillover of one fluorochrome’s emission into other fluorochrome detection, fluorescence compensation controls were set on single color controls using healthy donor cells stained with FITC and PE [15].
Gating strategy for treg definition
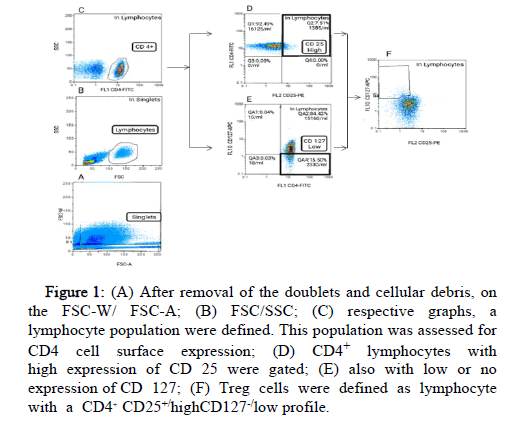
Identification of the total viable cell count of lymphocytes was assessed firstly by eliminating cellular debris and doublets on FSC-W and FSC-A gating parameters (Figure 1). Sequentially, the live cells were gated based on forward (FSC) and side (SSC) light scatter parameters profiles designating size and granularity respectively. Within single, live, lymphocytes population, CD4+ lymphocytes were selected (Figure 1). This CD4+ cell population was further gated into CD4+ cells with the highest level of CD25 fluorescence defined as CD4+CD25 high cells and CD4+ cells the lowest levels of CD127 defined as CD4+ CD127-/low. Lastly, in lymphocytes population, those with CD4+ CD25+/highCD127-/low profile were defined as a treg cell population.
Figure 1: (A) After removal of the doublets and cellular debris, on the FSC-W/ FSC-A; (B) FSC/SSC; (C) respective graphs, a lymphocyte population were defined. This population was assessed for CD4 cell surface expression; (D) CD4+ lymphocytes with high expression of CD 25 were gated; (E) also with low or no expression of CD 127; (F) Treg cells were defined as lymphocyte with a CD4+ CD25+/highCD127-/low profile.
Statistical analysis
Statistical analyses were performed using graph pad prism version 8.0 graph pad software (Inc, EE.UU). The normal distribution of each set of variables was analyzed using the D’Agostino and Pearson omnibus normality test. Paired data were compared using Mann- Whitney test. Correlation tests were performed using the Pearson test. A P value<0.001 was considered significant.
Results
Isolation of PBMCs by gradient centrifugation
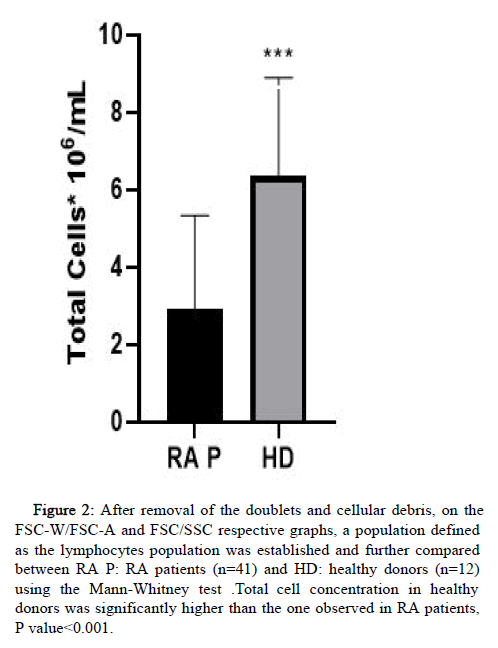
The viability of PBMCs isolated by density gradient was more than 98% assessed on FACS by removal of the debris and doublets on the FS/SS graph (Figure 2). For further evaluations, we compared data obtained from healthy donors and RA patients analyzing the final cell concentration. In this analysis the mean concentration of PBMC obtained in healthy volunteers was statistically higher than the one obtained in RA patients.
Figure 2: After removal of the doublets and cellular debris, on the FSC-W/FSC-A and FSC/SSC respective graphs, a population defined as the lymphocytes population was established and further compared between RA P: RA patients (n=41) and HD: healthy donors (n=12) using the Mann-Whitney test .Total cell concentration in healthy donors was significantly higher than the one observed in RA patients, P value<0.001.
Treg cell analysis
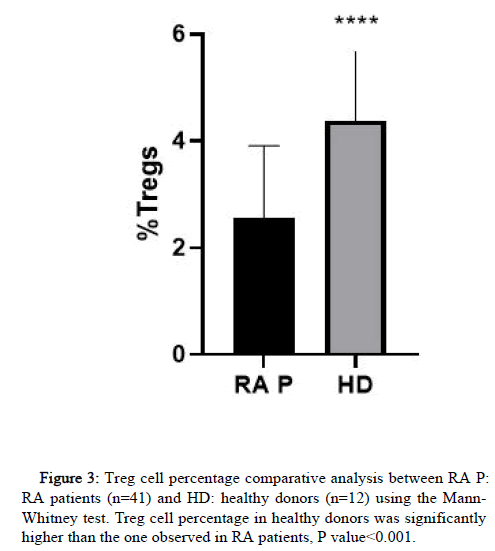
Treg cell identification by flow cytometry was assessed by gating a lymphocyte population with a CD4+ CD25+/highCD127-/low profile.
With our gating strategy we compared the frequency of treg cells obtained from healthy donor samples to the ones obtained from RA patients (Figure 3). With this method a clearly defined population was determined in both cases and the frequency of treg in healthy donors was significantly higher than the one obtained in RA patients.
Discussion
In the light of immunomodulatory therapies, the investigation of treatment effects on T cell subsets as part of the clinical monitoring is pivotal, specifically tregs, since this population in particular has a main role in the immune homeostasis. Earlier studies revealed the prognostic importance of tregs as biomarkers in clinical outcomes of immune mediated diseases. For example Avdeeva, et al. characterized the abundance of treg in peripheral blood of healthy donors compared to untreated early RA patients, demonstrating a significant decrease in blood treg percentage in comparison to healthy control. Furthermore, in this study MT treatment of patients with early untreated RA increased the proportion of treg suggesting their prognostic role for a positive course of RA treatment. In addition Kanjana, et al., assessed the number and inhibitory activity of treg between active RA and clinical remission patients concluding that these parameters were higher in the clinical remission as compared to the active RA and treg inhibitory activity was inversely correlated with disease severity. Further investigations related to autoimmune disorders including systemic lupus, juvenile idiopathic arthritis and inflammatory bowel disease also infer the association of Treg with disease outcome and its predictive value in clinical trials.
Conclusion
Herein we performed a flow cytometry gating strategy for profiling treg cells. We identified and sorted tregs within a CD4+ lymphocyte population based upon high expression levels of CD25. Although FoxP3 is considered to be the central marker for quantitative identification of treg cells lineage, as an intracellular antigen, it is not appropriate for sorting viable tregs that can be used in downstream studies. As an alternative method we further isolated CD127 low events as a surrogate of FOXP3 phenotype, within the CD4+CD25+ lymphocyte population. This gating approach offered a suitable method for large scale immunological evaluation, and a treg population with high recoveries for subsequent evaluations.
The gating strategy allowed the accurate detection of treg cells in individuals with low counts of this cell subpopulation such as those with autoimmune disease (RA) cases and it is useful for immune monitoring immunological response in clinical studies.
References
- Rosenblum MD, Remedios KA, Abbas AK (2015) Mechanisms of human autoimmunity. J Clin Invest 125:2228–2233.
[Crossref] [Googlescholar] [Indexed]
- Guo Q, Wang Y, Xu D, Nossent J, Pavlos NJ, et al. (2018) Rheumatoid arthritis: Pathological mechanisms and modern pharmacologic therapies. Bone Res 6:15.
- Romano M, Fanelli G, Albany CJ, Giganti G, Lombardi G (2019) Past, present and future of regulatory T cell therapy in transplantation and autoimmunity. Front Immunol 10:43.
- Rocamora-Reverte L, Melzer FL, Würzner R, Weinberger B (2021) The Complex Role of Regulatory T Cells in Immunity and Aging. Front Immunol 11:1–12.
- Kelchtermans H, De Klerck B, Mitera T, Van Balen M, Bullens D, et al. (2005) Defective CD4+CD25+ regulatory T cell functioning in collagen-induced arthritis: an important factor in pathogenesis, counter-regulated by endogenous IFN-gamma. Arthritis Res Ther 7:402–15.
[Crossref] [Googlescholar][Indexed]
- Avdeeva A, Rubtsov Y, Dyikanov D, Popkova T, Nasonov E (2020) Regulatory T cells in patients with early untreated rheumatoid arthritis: Phenotypic changes in the course of methotrexate treatment. Biochimie 174:9–17.
- Triplett TA, Curti BD, Bonafede PR, Miller WL, Walker EB, et al. (2012) Defining a functionally distinct subset of human memory CD4+ T cells that are CD25POS and FOXP3NEG. Eur J Immunol 42:1893–1905.
- Perz JB, Gürel S, Schonland SO, Hegenbart U, Ho AD, et al. (2012) CD4+CD25 high CD127 low regulatory T cells in peripheral blood are not an independent factor for chronic graft-versus-host disease after allogeneic stem cell transplantation. Sci World J 2012:606839.
[Crossref] [Googlescholar][Indexed]
- Rodríguez-Perea AL, Arcia ED, Rueda CM, Velilla PA (2016) Phenotypical characterization of regulatory T cells in humans and rodents. Clin Exp Immunol 185:281–291.
[Crossref] [Googlescholar] [Indexed]
- Zeng G, Jin L, Ying Q, Chen H, Thembinkosi MC, et al. (2020) Regulatory t cells in cancer immunotherapy: Basic research outcomes and clinical directions. Cancer Manag Res 12:10411–10421.
[Crossref] [Googlescholar][Indexed]
- Charlotte A, De Wolf MT, Herberts CA, Hoefnagel MHN (2020) Dawn of monitoring regulatory T cells in (Pre-) clinical studies: Their relevance is slowly recognised. Front Med 7:91.
[Crossref] [Googlescholar] [Indexed]
- Kanjana K, Chevaisrakul P, Matangkasombut P, Paisooksantivatana K, Lumjiaktase P (2020) Inhibitory activity of FOXP3+ regulatory T cells reveals high specificity for displaying immune tolerance in remission state rheumatoid arthritis. Sci Rep 10:1–10.
[Crossref] [Googlescholar] [Indexed]
- Silva-Neta HL, Brelaz-De-Castro MCA, Chagas MBO, Mariz HA, Arruda RGD, et al. (2018) CD4+CD45RA-FOXP3low Regulatory T Cells as Potential Biomarkers of Disease Activity in Systemic Lupus Erythematosus Brazilian Patients. Biomed Res Int 2018:3419565.
[Crossref] [Googlescholar] [Indexed]
- Hoeppli RE, Pesenacker AM (2019) Targeting Tregs in juvenile idiopathic arthritis and juvenile dermatomyositis-insights from other diseases. Front Immunol 10:1–9.
- Smids C, Horje CSHT, Drylewicz J, Roosenboom B, Groenen MJM, et al. (2018) Intestinal T cell profiling in inflammatory bowel disease: Linking T cell subsets to disease activity and disease course. J Crohn’s Colitis 12:465–475.
 Spanish
  Chinese
  Russian
  German
  French
  Japanese
  Portuguese
  Hindi
Hindi 


