Spanish
  Chinese
  Russian
  German
  French
  Japanese
  Portuguese
  Hindi
Hindi Research Article, J Fashion Technol Textile Eng Vol: 5 Issue: 3
Characterization of Wool Fabric Surface in Terms of Transient Heat Transfer
Chendi Tu and Sachiko Sukigara*
Department of Advanced Fibro-Science, Kyoto Institute of Technology, Kyoto, 606- 8585 Japan
*Corresponding Author : Sachiko Sukigara
Department of Advanced Fibro- Science, Kyoto Institute of Technology, Kyoto, 606-8585 Japan
Tel & Fax: +81-75-724-7365
E-mail: sukigara@kit.ac.jp
Received: May 26, 2017 Accepted: June 13, 2017 Published: June 17, 2017
Citation: Tu C, Sukigara S (2017) Characterization of Wool Fabric Surface in Terms of Transient Heat Transfer. J Fashion Technol Textile Eng 5:3. doi:10.4172/2329-9568.1000154
Abstract
A precise, simple method for characterizing wool fabric surfaces and moisture absorption has practical value in fabric design. Transient heat transfer has attracted attention because it is strongly related to the fabric surface and moisture absorption. To evaluate transient heat transfer for characterizing wool fabric surfaces, the Kawabata Evaluation System for Fabrics (KES-F) was used to measure the maximum heat flux, qmax, and surface properties of wool fabrics. The effect of moisture regain on qmax measured at two ambient humidities (65% and 90% relative humidity) was also discussed. A rough surface and a large amount of fuzz decreased qmax. A high correlation (r2=0.858) between qmax at 65% and 90% relative humidity was found. Therefore, qmax is suitable for characterizing the difference in the surface roughness, surface fuzz, and moisture content of wool fabric.
Keywords: Thermal; Moisture; Wool; Fabric surface; qmax
Introduction
Garments that produce continuous uncomfortable stimuli on the skin are unwearable. Therefore, fabric with comfortable tactile qualities is important for garments. Many researchers have studied wool fabric hand to generate suitable surface properties for the enduse garments. Naylor [1] demonstrated that prickliness arises from coarse fiber on the fabric surface. Many studies have investigated improving wool fabric hand by making the wool fabric surface smoother and softer [2-4].
Fabric perception and hand can be characterized subjectively by the softness, smoothness, dampness and warmth/coolness. These subjective characteristics correspond to the physical properties of fabrics. In particular, surface fuzz, friction, and roughness of the wool fabric surface are strongly related; thus, precise characterization is needed. We expected that transient heat transfer from skin to fabric would be an important factor, because it is affected by the fabric surface. The characteristic value qmax was proposed by Kawabata and Yoneda [5,6] and has been shown to estimate the temperature perception of the fabric. This value is the maximum rate of heat flux from a heated plate to the fabric and is convenient to measure. qmax values are also used in the fabric hand values for knitted underwear [7]. qmax is used to describe the thermal contact properties, but it can also be used with other fabric mechanical and surface properties to design fabrics.
In this study, wool fabrics with different fiber diameters, fabric densities, and moisture regain were used to examine how effective qmax is for wool fabric surface characterization.
Experiment
Samples
The fiber diameter, fabric density, and moisture regain were chosen as factors related to qmax. Three groups of fabric samples were used to examine each effect.
I: Effect of fiber diameter (Sample Group I)
Three yarn samples (25 tex) were spun from wool fibers with three mean fiber diameters (MFD; 18.5, 21.5, and 24.5 μm). Both 1 × 1 rib stitch and plain knitted fabrics were produced from the yarns in two stitch densities. Table 1 lists the sample details.
| Sample | Structure | Yarn Count | Weight | Wale density | Course density | Mean fiber diameter (µm) | Thickness |
|---|---|---|---|---|---|---|---|
| (tex) | (g/m2) | (cm-1) | (cm-1) | (mm) | |||
| F1 | 1×1 Rib Stitch | 25 | 283.6 | 11.6 | 19.3 | 18.5 | 2.21 |
| F2 | 1×1 Rib Stitch | 25 | 281.9 | 11.5 | 19.1 | 21.5 | 2.20 |
| F3 | 1×1 Rib Stitch | 25 | 274.9 | 11.07 | 19.1 | 24.5 | 2.32 |
| F4 | 1×1 Rib Stitch | 25 | 266.6 | 11.83 | 14.6 | 18.5 | 2.19 |
| F5 | 1×1 Rib Stitch | 25 | 263.3 | 11.8 | 14.3 | 21.5 | 2.18 |
| F6 | 1×1 Rib Stitch | 25 | 268.2 | 11.9 | 14.1 | 24.5 | 2.29 |
| F7 | Plain Knitted | 25 | 72.1 | 11.5 | 8.7 | 18.5 | 1.10 |
| F8 | Plain Knitted | 25 | 72.5 | 11.5 | 8.8 | 21.5 | 1.26 |
| F9 | Plain Knitted | 25 | 74.1 | 11.8 | 8.4 | 24.5 | 1.21 |
| F10 | Plain Knitted | 25 | 102.5 | 15.4 | 12.2 | 18.5 | 1.18 |
| F11 | Plain Knitted | 25 | 100.2 | 14.7 | 11.9 | 21.5 | 1.17 |
| F12 | Plain Knitted | 25 | 103.8 | 15.8 | 12.7 | 24.5 | 1.49 |
Table 1: Characteristics of Sample Group I.
II: Effect of fabric moisture regains (Sample Group II)
In our previous work, a wool fabric sample (F3 in Table 1) was treated with enzymes [8]. In Table 2, samples E1 and E3 were treated with keratinase, E5 with proteinase, and E7 with both keratinase and proteinase. Samples E2, E4, E6, and E8 were the corresponding controls, respectively. Sample E9 was made by rinsing sample F3 with ultrasonication. These fabric samples had different moisture regain values at the same temperature and humidity [8].
| Sample | Structure | Yarn Count | Weight | Wale density | Course density | Mean fiber diameter (µm) | Thickness | Remark |
|---|---|---|---|---|---|---|---|---|
| (tex) | (g/m2) | (cm-1) | (cm-1) | (mm) | ||||
| E1 | 1×1 Rib Stitch | 25 | 299 | 10.9 | 20.1 | 24.5 | 1.72 | K-7d |
| E2 | 1×1 Rib Stitch | 25 | 306.1 | 11.8 | 20.6 | 24.5 | 1.78 | K-7d-control |
| E3 | 1×1 Rib Stitch | 25 | 295.8 | 11.8 | 20.3 | 24.5 | 1.8 | K |
| E4 | 1×1 Rib Stitch | 25 | 298.9 | 11.6 | 20.5 | 24.5 | 1.76 | K-control |
| E5 | 1×1 Rib Stitch | 25 | 296.1 | 12.1 | 20.1 | 24.5 | 1.83 | P |
| E6 | 1×1 Rib Stitch | 25 | 296.8 | 11.9 | 19.8 | 24.5 | 1.86 | P-control |
| E7 | 1×1 Rib Stitch | 25 | 298.6 | 11.9 | 20.5 | 24.5 | 1.69 | K+P |
| E8 | 1×1 Rib Stitch | 25 | 304.4 | 11.8 | 20.7 | 24.5 | 1.72 | K+P-control |
| E9 | 1×1 Rib Stitch | 25 | 292.8 | 12.2 | 19.9 | 24.5 | 2.03 | Ultrasonic |
K-7d-control: Control sample for K-7d without enzyme
K: Keratinase H328 treatment for 5h
K-control: Control sample for K without enzyme
P: Proteinase K treatment for 5h
P-control: Control sample for P without enzyme
K+P: Keratinase H328 treatment for 5h, followed by proteinase treatment for 5h
K+P-control: Control sample for K+P without enzymes
Ultrasonic: Ultrasonic pretreatment, initial sample for E1-E8
Table 2: Characteristics of Sample Group II, 1x1 stitch.
III: Conventional samples
Samples in Groups I and II were produced for this study. For comparison, 19 conventional samples (18 wool and one wool blend) were collected (Table 3). Samples C1 to C11 were collected according to mean fiber diameter and were knitted fabrics, except C6. Samples S1 to S4 are 2 × 2 twill fabrics with the same yarn count (16.6 × 2 tex, MFD 20.5 μm) but with different fabric finishes to the surface. Samples S5 to S8 also have different fabric finishes. The surfaces of samples S5 to S7 have raised fibers.
| Sample | Structure | Yarn Count | Weight | Wale/Ends | Course/Picks | Mean fiber diameter (µm) | Thickness | Remark |
|---|---|---|---|---|---|---|---|---|
| (tex) | (g/m2) | (cm-1) | (cm-1) | (mm) | ||||
| C1 | Plain knitted | 13.9 | 107.6 | 17.9 | 14.7 | 17.5 | 0.63 | |
| C2 | Plain knitted | 13.9 | 102.1 | 16.5 | 15.8 | 18.5 | 0.586 | |
| C3 | Knitted | 13.9 | 90.3 | 14.6 | 14.3 | 19.5 | 0.528 | |
| C4 | Plain knitted | 33.3 | 221.7 | 13.7 | 13.5 | 20.5 | 0.786 | |
| C5 | Knitted | 20.8 | 116.5 | 11.8 | 11.8 | 21.5 | 0.921 | |
| C6 | Woven | 106.5 | 269.7 | 8.0 | 3.4 | 40 | 1.452 | |
| C7 | Interlock knitted | 29.4 | 323 | 11.9 | 12.5 | 20.5µm 25% / 23.0µm 75% |
1.345 | |
| C8 | Interlock knitted | 25.0 | 365.7 | 15 | 13.3 | 22.5 | 2.007 | |
| C9 | Interlock knitted | 27.8 | 276.1 | 12.3 | 10.2 | 24.5µm 50% / 26.0µm 50% |
1.193 | |
| C10 | plain knitted | 13.9 | 102.1 | 17.2 | 14.8 | 18.5 | 0.564 | Differ from C2 in color |
| C11 | plain knitted | 13.9 | 167.9 | 18 | 16.4 | 19.5 | 0.923 | |
| S1 | 2×2 Twill | 16.6×2 | 197 | 35 | 25 | 20.5 | 0.52 | Top dyeing |
| Clear finishing | ||||||||
| S2 | 2×2 Twill | 16.6×2 | 223 | 32 | 29 | 20.5 | 0.55 | Top dyeing |
| Glossy clear | ||||||||
| S3 | 2×2 Twill | 16.6×2 | 206 | 28 | 26 | 20.5 | 0.7 | Top dyeing |
| Milling | ||||||||
| S4 | 2×2 Twill | 16.6×2 | 194 | 33 | 25 | 20.5 | 0.65 | Top dyeing |
| Glossy Milling | ||||||||
| S5 | Broken twill | 142.9 | 309 | 10 | 12 | - | 2.85 | Piece dyeing |
| Mosser | ||||||||
| *Wool 90/Nylon 10 | ||||||||
| S6 | Broken twill | 100 | 367 | 15 | 15 | - | 1.99 | Piece dyeing |
| Beaver | ||||||||
| S7 | 2×1 Twill | 12.5×2 | 223 | 40 | 32 | - | 1.06 | Top dyeing |
| Milling | ||||||||
| S8 | Herring bone | 12.5 | 88 | 46 | 59 | - | 0.46 | Top dyeing |
| Clear |
Table 3: Characteristics of Sample Group III.
Measurements
qmax measurements: qmax is usually measured with the KES-F7 Thermolab II tester (Kato Tech Co., Ltd., Japan). The sample sizes of Groups I and II were too small for KES-F7; thus, we used the finger sensor unit (Kato Tech Co., Ltd.) of a finger robot developed by Kawabata et al. [9,10]. The finger sensor unit was connected to a compression tester (KES-G5, Kato Tech Co., Ltd.) to measure qmax. Samples were conditioned at 20.0 °C and 65% or 90% relative humidity (RH) for 4 h, and then placed on the temperature-controlled stage at 20 °C. The initial temperature of the contactor (0.785 cm2) was 30.0 °C and it compressed the sample at a speed of 1 mm/s up to 12.48 kPa.
Mechanical and surface properties
Surface test: A surface tester (KES-SE-STP, Kato Tech Co., Ltd.) was used to measure the fabric surface friction. When the stage was moved 5 cm at a speed of 1 mm/s under a force of 0.49 N over the fabric, the friction between the contactor and fabric sample was recorded and the friction coefficient was calculated. The average friction coefficient (MIU) and the average deviation of MIU (MMD) were obtained for effective displacement intervals of 0.5 to 4.5 cm [11]. The means of three replicates were reported.
A surface tester (KES-SE, Kato Tech Co., Ltd.) was used to measure the fabric surface geometrical roughness (SMD) [11]. A single piano wire 0.5 cm in length (φ=0.5mm) was moved at 1 mm/s under a force of 0.098 N over the fabric. The concave–convex thickness change in the fabric was measured. The displacement of the piano wire was 3.0 cm and the effective distance was 2.0 cm. The means of three replicates were reported.
Bending test: For yarn consisting of a number of fibers, No, with a mean fiber diameter, d, the yarn bending rigidity, BY [12], is
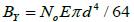 (1)
(1)
where E is the Young’s modulus.
When two yarns (Y1, Y2) with the same yarn linear density (T) are compared,
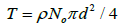 (2)
(2)
where ρ is the density of wool. Thus,
 (3)
(3)
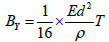
The ratio of the bending rigidity of two yarns is given by
 (4)
(4)
Equation (4) suggests that, for wool yarns with the same linear density, a larger MFD leads to a higher bending rigidity.
The bending rigidity (B) of a fabric was measured by a pure bending tester (KES-F2, Kato Tech Co., Ltd.). The clamped sample was bent at a maximum curvature of ±2.5 cm-1 at a constant rate. The sample size was 2.5 × 2.5 cm2. The moment–curvature curves were obtained to calculate B.
Three-dimensional surface measurement: The surface fuzz of the fabrics was observed by a three-dimensional measuring macroscope (VR-3100, Keyence Corporation, Japan).
Results and Discussion
Effect of MFD on the fabric bending and surface properties (Sample Group I)
In Figure 1, the bending rigidity (B) is plotted against MFD. The B values of samples F3 and F6 were higher than those of samples F1 and F4 in both the wale and course directions. The ratio of B for two fabrics was not equal to the corresponding ratio of the fiber diameter, d2. The MFD dominates the bending rigidity of wool yarn and fabric, as these results showed. Samples with a higher course density showed a larger bending rigidity for the yarn with the same fiber diameter [12-15]. According to equation (1), BY is proportional to the number of wool fibers. A higher stitch density means that there are more fibers in the yarn, which increases BY, and explains why fabric with a higher stitch density was stiffer than that with a lower stitch density.

Figure 1: Effect of fiber diameter on the fabric bending rigidity, B (1 × 1 rib).
The surface properties (MIU and MMD) are shown in Figure 2. The effect of MFD on MIU was observed for sample F3 in the highdensity wale direction. The value of MIU for F3 was larger than that for F1 and F2, owing to the large MFD of F3. The higher stitch density in the rib stitch fabric resulted in a coarser surface, for example, the higher MIU value for sample F3 than for sample F6 along the wale and course directions. The difference in stitch density for MIU and MMD was greater in 1 × 1 rib stitch fabric than the plain knitted fabrics.

Figure 2: Effect of fiber diameter on the MIU and MMD for (left) rib stitch and (right) plain knitted fabrics.
Macroscope images of fuzz on the fabric surface are shown in Figure 3. The amount of fuzz on the fabric surface was greater for samples with MFD of 24.5 μm. Samples with a higher stitch density had more fuzz than samples with a lower stitch density. According to Euler’s equation, the threshold force required to buckle the fuzz is proportional to four times the fiber diameter. The MMD values reflected the amount of coarse and unbent fuzz on the surface [16].

Figure 3: Macroscope images of fuzz on the fabric surface.
SMD describes the knitted structure, and the SMD values are listed in Table 4. The effect of MFD on SMD is small, although the stitch density is reflected in the SMD values. The rib stitch fabric with a high stitch density showed a larger SMD in the wale and course directions than the low stitch-density fabric. In the plain knitted samples, the SMD of all samples were small so that the effect of both the MFD and stitch density on the SMD was marginal.
| Knitting | MFD (µm) |
Sample | SMD (High stitch density) | Sample | SMD ( Low stitch density) | ||||||
|---|---|---|---|---|---|---|---|---|---|---|---|
| Wale | Course | Wale | Course | ||||||||
| mean | sd | mean | sd | mean | sd | mean | sd | ||||
| 1×1 rib | 18.5 | F1 | 3.45 | 0.36 | 20.40 | 0.32 | F4 | 2.50 | 0.22 | 18.22 | 0.66 |
| 21.5 | F2 | 3.76 | 0.18 | 20.50 | 0.98 | F5 | 2.63 | 0.15 | 19.60 | 1.36 | |
| 24.5 | F3 | 3.91 | 0.74 | 21.63 | 0.26 | F6 | 2.85 | 0.40 | 20.61 | 1.93 | |
| Plain | 18.5 | F10 | 0.68 | 0.14 | 1.66 | 0.25 | F7 | 1.00 | 0.13 | 2.65 | 0.14 |
| 21.5 | F11 | 0.84 | 0.06 | 2.66 | 0.60 | F8 | 0.89 | 0.10 | 2.84 | 0.30 | |
| 24.5 | F12 | 0.71 | 0.09 | 2.42 | 0.30 | F9 | 1.15 | 0.10 | 2.83 | 0.11 | |
Table 4: Surface roughness (SMD, μm) of wool samples F1–F12.
qmax
Effect of fabric moisture regain on qmax: The heat flux (qmax) of Group I samples was plotted against MFD for two ambient humidities (Figure 4). qmax was higher for samples conditioned at 90% RH than that at 65% RH. The average moisture regains of rib stitch fabrics were 12.6% (standard deviation [SD] 0.24%) at 65% RH and 19.2% (SD 0.28%) at 90% RH. For the plain weave fabrics, the moisture regain was 13.4% (SD 0.13%) at 65% RH and 20.4% (SD 0.41%) at 90% RH. The wool conditioned at 90% RH had a higher moisture regain than that conditioned at 65% RH. The increase in the moisture regain was approximately 7.0% for both structures. The thermal conductivities of water and dry wool were 0.580 and 0.0464 W/(cm・K), respectively. The results suggested that the ambient humidity affected the moisture regain of wool, which affected the wool’s thermal properties, and higher moisture regain resulted in a larger qmax. Fabric with larger fiber diameters showed lower qmax values for rib stitch fabric with high density. MFD did not affect qmax in plain knitted samples.

Figure 4: Effect of mean fiber diameter on qmax for fabrics conditioned at 65% RH and 90% RH (20°C).
A further study was performed for enzyme-treated fabrics with various moisture regain values. The effect of moisture regain on qmax for Group II samples is shown in Figure 5. In samples conditioned at 90% RH, enzyme-treated samples showed a higher moisture regain than their controls. qmax increased with the increase in moisture regain. The results in Figures 4 and 5 suggest that the moisture in wool had a dominant effect on qmax. Schneider et al. [17] found that for moisture regain of 0–15%, water is strongly bound to the internal structure of wool fiber, and free water is present when the moisture regain exceeds 15%. Moisture regain measured for Sample Group II was 13.5–15% at 65% RH, and 20–22.5% at 90% RH at 20.0°C. The increase of qmax with moisture at 90% RH compared to 60% RH arose from the free water in the fabric, which was confirmed by the results in Figure 4.

Figure 5: Relationship between qmax and moisture regain for enzyme treated fabrics conditioned at 65% RH or 90% RH (20°C).
Surface fuzz and fiber density: qmax is affected by the surface roughness because the heat transfer depends on the contact area. The surface roughness parameter, SMD, indicates contact between the contactor and fabric surface [18]. If the fabric surface layer contains more air for low fiber densities, this should affect the qmax values. In Figure 5, qmax of sample F3 (rib stitch samples with larger stitch density) was lower than for the other samples.
The relationship among MFD, fuzz, and MMD suggests that fabric with a larger MFD has more unbent surface fuzz, which could be characterized by MMD. For fabrics with larger MFD and a larger amount of surface fuzz, the contact area may be smaller, reducing qmax.
Using qmax in fabric design
We used conventional wool fabrics (Sample Group III in Table 3) to investigate how to use qmax for characterization.
The relationship between qmax and thickness is shown in Figure 6 for all samples. The S samples (S1–S8) were finished with a different method to change the amount of fuzz on the surface. Samples S1– S4 was made from the same yarn with the same structure but four different finishes. The smoothest finished sample (S2), which had the least fuzz, showed the largest qmax value. The surfaces of samples S5 and S6 were covered with fibers, resulting in a low qmax. Thickness and surface fibers affect the qmax values, which indicate the warm/cool perception of the fabric.

Figure 6: Relationship between qmax and thickness.
In Figure 7, the qmax values for the fabrics conditioned at 65% RH are plotted against those for fabrics conditioned at 90% RH. A linear correlation (r2=0.858) was observed.

Figure 7: Effect of moisture on qmax (r2=0.858).
Conclusion
The surfaces of wool fabrics are covered by fuzz, which produces a warm feeling or sometimes a cooler feeling. This study focused on the fabric surface and heat transfer through a fabric. Surface characterization was carried out by using a KES surface tester. The physical value, qmax, was used to predict the warmth/coolness of the fabric.
Fabric made from thicker fibers produced a higher MMD. In this fabric, unbent stiff fuzz reduced the contact area with the heated plate and decreased qmax. SMD characterized the fabric structure, such as the stitch density. qmax increased as SMD decreased, indicating that the surface was smoother with less fuzz. Moisture in the fabric increased the qmax value. The qmax value of the sample conditioned at 90% RH was larger than that conditioned at 65% RH. The qmax value for wool fabrics was affected by moisture as well as surface fuzz.
Our results suggest that qmax could be used to characterize the fabric surface finishing effect, especially for fabric that contains moisture, as a fast and sensitive measurement.
Acknowledgement
Chendi Tu thanks China Scholarship Council for the scholarship (File No. 201608050085).
References
- Naylor G, Phillips D, Veitch C, Dolling M, Marland D (1997) Fabric-Evoked Prickle in Worsted Spun Single Jersey Fabrics Part I: The Role of Fiber End Diameter Characteristics. Textile Res J 67: 288-295.
- Chen W, Chen D, Wang X (2001) Surface Modification and Bleaching of Pigmented Wool. Textile Res J 71: 441-445.
- Bahi A, Jones J, Carr C, Ulijn R, Shao J (2007) Surface Characterization of Chemically Modified Wool. Textile Res J 77: 937-945.
- Kim M, Kang T, Kim S (2002) Dimensional and Surface Properties of Plasma and Silicone Treated Wool Fabric, Textile Res J 72: 113-120.
- Kawabata S (1984) Development of a Device for Measuring Heat-Moisture Transfer Properties of Apparel Fabrics. J Text Mach Soc 37: T130-T141.
- Yoneda M, Kawabata S (1981) Analysis of Transient Heat Conduction and Its Application Part 2: A Theoretical Analysis on the Relation between Cool-and-warm Feeling and the Transient Heat Conduction in Skin. J Text Mach Soc Japan 34: T199-T208.
- Sakaguchi H, Niwa M, Kawabata S (1986) A Development in the Objective Measurement of the Quality of Knitted Fabrics Used for Underwear, Part1. Measurement of the Fabric-Characteristics. J Text Mach Soc 39: T33-T42.
- Tu C, Kawai F, Watanabe K, Okada K, Sukigara S (2017) Keratinase H328 and Keratinase H328-Proteinase K Treatments for Wool Surface. J Fiber Sci Technol 73: 126-134.
- Yoneda M, Sumi A (2014) Investigation on objective evaluation of fabric warm/cool feeling by finger sensor method. Proceeding of International Symposium on Fiber Science and Technology.
- Kawabata S, Nakanishi M, Niwa M (1990) Sen-I Gakkai Symposia preprints B17-B22. The Society of Fiber Science and Technology, Tokyo, Japan.
- Kawabata S (1980) The standardization and Analysis of Hand Evaluation. (2nd edition), The Textile Machinery Society, Osaka, Japan.
- Peirce F, Inst.P. (1930) The “Handle” of Cloth as a Measurable Quantity. J Textile Inst 21: T377-T416.
- Nhan G, Denby E, Nhan G (1984) Bending Rigidity and Hysteresis of Wool Worsted Yarn. Textile Res J 54: 180-187.
- Ly N (1983) The Contribution of the Fibre-diameter Distribution to the Bending Rigidity of Yarns. J Textile Inst 74: 228-230.
- Muraki C, Saito S and Niwa M (1994) The Effect of Wool Fiber Diameter and Wool Blend Ratio of Wool/Cotton Folded Yarns on the Bending Property of Yarns. Jpn Res Assn Text End-Uses 35: 149-158.
- Naylor G, Veitch C, Mayfield R, Kettlewell R (1992) Fabric-Evoked Prickle. Textile Res J 62: 487-493.
- Schneider A, Hoschke B, Goldsmid H (1992) Heat Transfer through Moist Fabrics. Textile Res J 62: 61-66.
- Naebe M, Robins N, Wang X, Collins P (2013) Assessment of performance properties of wetsuits. Proceeding of the Institution of Mechanical Engineers, Part P: Journal of Sports Engineering and Technology 227: 255-264.