Spanish
  Chinese
  Russian
  German
  French
  Japanese
  Portuguese
  Hindi
Hindi Research Article, Vector Biol J Vol: 7 Issue: 5
Comparative Analysis of the Effectiveness of Polymerase Chain Reaction (PCR) and Microscopy in Malaria Diagnosis
Ismail Muhammad1*, Asher Rejoice1, Saleh Zaliha Miyim2, Asiya Muhammad Usman3 and Sulaiman Abubakar4
1Department of Zoology, Gombe State University, Gombe State, Nigeria
2Department of General Studies, School of Nursing and Midwifery, Gombe State, Nigeria
3Department of Preliminary and general Studies, Federal College of Horticulture Dadin Kowa, Gombe State, Nigeria
4Department of Microbiology, Federal University Dustin-Ma, Kastina State, Nigeria
*Corresponding Author: Ismail Muhammad, Department of Zoology, Gombe State University, Gombe State, Nigeria, Tel: +2347069951809; E-mail: muhammadismail5609@gsu.edu.ng
Received date: 14 July, 2022, Manuscript No. VBJ-22-69205; Editor assigned date: 15 July, 2022, PreQC No. VBJ-22-69205 (PQ); Reviewed date: 29 July, 2022, QC No. VBJ-22-69205; Revised date: 04 October, 2022, Manuscript No. VBJ-22-69205 (R); Published date: 11 October, 2022, DOI: 10.4172/2473-4810.1000252.
Citation: Ogunka-Nnoka CU, Ben-Piakor TE, Mepba HD, Ifeanacho MO (2020) Effect of Processing on Phytochemicals and Nutrient Composition of Tiger Nut (Cyperus esculentus L). J Food Nutr Disor 9:2. doi: 10.37532/jfnd.2020.9(2).271
Abstract
Malaria is a life threatening parasitic disease which causes enormous morbidity and mortality in tropical African countries. Successful prevention and treatment of an infected individual heavenly depends on successful diagnosis using recommended techniques. This routine laboratory technique tends to have different performance indices. Therefore, the aim of this study was to evaluate the performance of Polymerase Chain Reaction (PCR) and microscopy in malaria diagnosis. A total of two hundred consented study subjects were randomly selected and enrolled for the research. Vein puncture technique was used to collect blood from the subjects and analysed using microscopy (Giemsa stain) and PCR. DNA samples were extracted using Quick-DNA™ Miniprep plus Kit with catalog No. D4069. 18S rRNA gene of Plasmodium falciparum from chromosome 13 were amplified using the primers F5’AACAGACGGGTAGTCATGATTGAG3’ R5’GTATCTGATC GTCTTCACTCCC3’. Malaria prevalence of 167 (83.50%) and 105 (52.5%) were recorded respectively using microscopy and PCR. Microscopy had a sensitivity, specificity, positive predictive value and negative predictive value of 84.91%, 23.40%, 55.53% and 57.89% respectively with an overall accuracy value of 0.81. PCR had a sensitivity value of 53.89%, specificity 54.54%, positive predictive value 85.79% and negative predictive value of 18.94% with an overall accuracy of 0.54. Both microscopy and PCR demonstrated significant level of accuracy and relatively good performance indices. Therefore microscopy and PCR are highly recommended as malaria diagnostic techniques and further research should carried out to determine the influence of some biological factors of both the parasite and the host on the outcome of the diagnosis using both PCR and microscopy.
Keywords
Malaria diagnosis; Microscopy; Sensitivity; Specificity; Accuracy
Introduction
Malaria is an ancient parasitic protozoan disease caused by five parasites specie (Plasmodium falciparum, P. vivax, P. malariae, P. ovale and P. knowlesi) belonging to genus Plasmodium [1].
Plasmdium falciparum is the most predominant specie in sub Saharan African causing severe disease and death, particularly in young children usually less than five years of age, pregnant women and immucompromiesd individuals, also P. knowlesi causes acute, severe illness but with low rate of mortality [2-4]. The disease is a major public health problem in the tropic especially Nigeria where climatic conditions favour the survival of both the parasite (Plasmodium specie) and the vector (female Anopheles mosquito) [5,6]. In 2018, there were 228 million estimated clinical cases of malaria infection and 405,000 malaria related deaths where Sub-Saharan Africa bears more than 90% of the global malaria cases with more than 93% of all deaths [7-9].
Accurate diagnosis of malaria is a pillar of malaria control and elimination [10]. Therefore use of only clinical approach is usually discouraged and insufficient for establishing presence or absence of malaria parasite, this is because such presumptive diagnosis cannot be fully relied upon, as presentation of malaria is extremely non-specific and imitates a variety of other similar clinical conditions [11].
Therefore, instead World Health Organisation (WHO) recommends all clinically suspected malaria cases to be confirmed with aid of parasitological diagnosis, using either a malaria-specific Rapid Diagnostic Test (RDT) or direct visualization of the parasites or it product using microscopy, before treatment [12,13]. Fever, which is usually associated with chills, perspiration, anorexia, headaches, vomiting, high body temperature and malaise are the most prominent clinical signs and symptoms of malaria infection and quite a number of people residing in endemic areas of malaria transmission are fully aware of these symptoms, thus led to self-diagnosis and in most cases self-treatment. According to the global malaria policy of universal testing and treatment, detection of malaria cases should be within first 24 h [14]. Therefore, in the last few decades there is rapid increase and advancement in the development of novel malaria diagnostic technique [15].
Presently, diagnostic and reference laboratories adopt several techniques, which include microscopy, molecular assays (polymerase chain reaction) and serological assays [16], but microscopy remains the mainstay and gold standard technique in most areas where malaria is endemic. Nevertheless, with all this dependence on microscopy there are some short coming attached to it, which include subjective parasite identification and counting by microscopists [17], inherent errors due to sample handling [18], inability to detect mixed species infection especially when it involves P. ovale and P. vivax, the lower detection limit of between 4–20 parasites/ml even for expert microscopists and lack of steady and interrupted power supply in most malaria endemic countries and in some instances it may tend to give either false positive or false negative result [19,20]. Polymerase Chain Reaction (PCR) is a well-known molecular technique that uses either the DNA or RNA (nucleic acid) of the parasite for the diagnosis of an infectious agent, the technique is very sensitive and specific as it has the ability to detect infectious agent at densities below the threshold level of other conventional techniques. PCR can detect for example malaria parasite at densities below the threshold level of detection of either microscopy or RDTs [21]. For Plasmodium falciparum diagnosis using PCR, 18S rRNA genes is amplified [22]. Unlike other techniques especially microscopy and RDTs which are considered to be less expensive and cumbersome, this Molecular-based technique is fairly expensive and require high level of expertise [23]. Other additional malaria diagnostic technique includes Loop mediated isothermal amplification (LAMP), flow cytometry. Though PCR is expensive, but still some laboratories and some other research institutions adopt it especially when other conventional diagnostic techniques failed to produce the required and expected result. Therefore the aim of this study was to compare and evaluate the performance of PCR and microscopy in malaria diagnosis as there is paucity of data in that regards in the study area.
Materials and Methods
Study area
The study was conducted in Gombe local government area, Gombe state, Nigeria. The local government lies between 11°14′07″E and 11°4′42″E and latitudes 10°16′48″N and 10°17′24″N with a total land mass 52 km2. Gombe local government has a projected population figure of 367,500 people (3.3% annual change) according to national population commission. The vegetation of the local government is typical of that of Gombe state which is Sudan savannah and experience two distinct season, dry season which normally commences from November-March and rainy season from April- October with mean annual rainfall of 863.2 mm. Agriculture is the major occupation in the region (mostly Peasant farmers) while some engage in business and few are civil servant. The local government being the state capital of the state, both the tertiary (federal teaching hospital) and the secondary (Gombe state specialist hospital) health facilities of the state are domiciled in the local government. This is also in addition to the primary health care centres that are strategically located in each wards of the local government; also there are quite a number of private hospitals providing different services including malaria diagnosis and treatment.
Ethical consideration
The research proposal was submitted to the Gombe State Ministry of Health for approval, after which the approval was communicated via a later MOH/ADM/621/VOL.I/222.
Consent of the subjects
Before collecting blood sample from the study subjects’ verbal and or written consent of the subject was sought after briefing them on the research and the need for them to participate. In a situation whereby the subjects were not matured enough, consent of his/her parents/ guardian were sought. All the subjects were assured that, all information collected from the study subjects will be strictly used for the purpose of the research and will be treated with high level of confidentiality. In addition, quality control and quality assurance was assured when handling and treating each of the samples.
Study subjects and inclusion criteria
A total of two hundred study subjects comprise of male and female of different age who willingly and voluntarily agreed to participate in the study were used as the subjects for the research. Three (3) recruitments centres were selected; these are Gombe town maternity (gidan Magani). Only patients who reported themselves to the selected hospitals (Gombe Town Maternity (Gidan Magani), Sunnah Clinic and Idi Children and Women Hospital Gombe) with a symptoms of malaria (fever) or history of fever in last 24 hours and referred by a physician for the screening of malaria infection and in addition they have not used any anti-malarial drugs 60 days prior to the data collection, only subjects with Plasmodium falcifarum mono-infection were recruited (Figure 1).

Figure 1: Map of Gombe local government area.
Blood sample collection and analysis
Vein puncture technique was used to collect venus blood samples with the help of medical personnel. Briefly, Soft tubing tourniquet was fastened on to the upper arm of the respondents to enable the index finger feel a suitable vein. The puncture site was then cleaned with methylated spirit (methanol) and venepuncture was made with the aid of a needle attached to a 5 ml syringe. When sufficient blood sample had been collected, the tourniquet was removed and the needle removed immediately, after which the blood was transferred in to an EDTA container and transferred to laboratory for analysis.
Microscopy: The collected blood samples was analysed within 1 to 2 hours after collection. Thick and thin films were prepared according to the standard technique of film preparation. A drop of blood sample was placed on the centre of grease free slides. After which, the reverse side of the slides was cleaned with cotton wool and allow for air drying and stained with giemsa stain for 60 minutes. After which the slides were washed off gently with clean water. The slides were placed on a rack in order to air dry for eventual examination of the slides under microscope, using oil immersion at 100x magnification to observe for Plasmodium parasite. Presence of ring forms and or trophozoites of Plasmodium indicated positive result while absence of either trophozoites or ring form indicate negative result after a period of 10 minutes of thorough examination by qualified microscopist under 100x high power field of microscope.
Molecular analysis
DNA extraction: The DNA was extracted using Quick-DNA™ Miniprep Plus Kit with catalog No. D4069 from Zymo research.
Techniques and procedures outlined and recommended by the manufacturers were strictly adhered to briefly, 200 μl of biofluid and cell buffer was added on the pieces of the filter paper containing the dried blood sample in the eppendorf tube. After which 20 μl of protienase K was added and mixed thoroughly and incubated at 55°C for 10 minute in order to digest the various component of the sample.
After which 200 μl of genomic binding buffer was added. The entire mixture was then transferred in to a zymo spin column in a collecting tube and centrifuge in a refrigerated centrifuge at 1200 rpm for 1 minute. After which the collecting tube was discarded with the follow through. 400 μl of DNA pre-wash buffer was added to the column in a new collection tube and centrifuge for 1 minute. This was followed by the addition of 700 μl of genomic DNA wash buffer and centrifuge for 1 minute. After which 200 μl of genomic buffer was then added and centrifuge for 1minute. The tube was then discarded with the follow through. Finally in order to elute the DNA 50 μl of DNA elution buffer was added and incubated for 5 minutes and then centrifuge for 1 minute.
DNA confirmation and purity and concentration determination: In order to confirm for the presence of DNA in the entire sample extracted, a gel electrophoresis was run was in 2% agarose stained with 0.5 μl of ethidium bromide and was allowed to run for a period of 1hour at 100 mA, after which the gel was visualised using Ultraviolent (UV) Trans illuminator. Nano drop Spectrophotometer was used to determine the concentration and purity of the DNA extracted.
Primers: The primer (F5’AACAGACGGGTAGTCATGATTGAG3’ and R5’GTATCTGATCGTCTTCACTCCC3’) used were adopted from the work of and validated [24]. All validated Primers were sent to Inqaba biotecTM Africa’s genomic company for synthesis and supply. The primers were reconstituted/ diluted by using the recommended dilution factor (appropriate amount of distilled water) as specified by the manufacturer and stored at -4oC as stock solution.
The actual working solution was obtained by diluting 10 μl of the stock in 90 μl of Nano pure water making (10%).
Amplification of 18S rRNA gene of Plasmodium falcifarum: The amplification was carried out using classic DW-K960 thermal cycler and the reaction was carried in 25 μl reaction mixture containing 5 μl of the extracted DNA as the template, 1 μl of primer (0.5 μl each of F5’AACAGACGGGTAGTCATGATTGAG3’ R5’GTATCTGATCGT CTTCACTCCC3’), 6.5 μl distilled water and 12.5 μl of the PCR Master mix (Containing dNTPs, MgCl2 and Taq DNA Polymerase).
The gene was amplified by setting an initial denaturation at 95oC for 15minutes then followed by forty (40) cycles of denaturation at 94°C for 45 seconds while annealing at 60°C for 90seconds and extension at 72°C for 1 minute. The final extension was carried out at 72°C for 5 minutes. For this band size of 276 bp was used as control for the confirmation of Plasmodium falciparum while distilled water was used as negative control for all PCR in the research.
| Primer Sequence | Cycling condition | Cycles |
|---|---|---|
| F5’AACAGACGGGTAGTCATGATTGAG3’ R5’GTATCTGATCGTCTTCACTCCC3’ | 95℃, 15 min | 40 |
| 95℃, 45 sec | ||
| 60℃, 90 sec | ||
| 72℃, 1 min | ||
| 72℃, 5 min |
Table 1: PCR cycling condition for the amplification 18S portion of ribosomal RNA gene.
Gel electrophoresis
The amplified genes were subjected to electrophoresis in 2% Agarose stained with Ethidium bromide. The gel was allowed to run for a period of 1 hour at 100 mA, after which the gel was visualised using Ultraviolent (UV) Transilluminator.
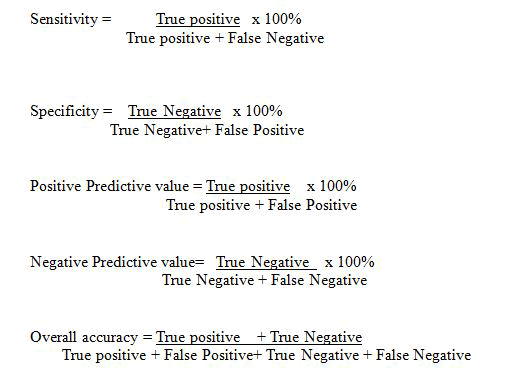
Determination of performance of polymerase chain reaction and microscopy
In order to determine the effectiveness of PCR and microscopy in malaria diagnosis, it sensitivity, specificity, positive predictive value, negative predictive value and accuracy were calculated using the formula.
Results
Demographic and clinical information of the subjects
Table 2 below shows some basic demographic and clinical characteristic of the study subjects, where the age of the subjects ranges from 5-50 years with the mean age of 28.60 ± 10.60. The mean ambient body temperature of the subjects ranges from 33°C-43°C with the mean of 37.77 ± 1.92. For the molecular analysis, the concentration of the DNA sample extracted ranges from 100.10-600.2 ng/μl of the sample and the mean concentration was 300.55 ± 100.03. For purity, the mean value of A260/280 was 1.72 ± 0.55 and it ranges from 0.7-5.11.
| Characteristics | Mean | Range | Male | Female |
|---|---|---|---|---|
| Age | 28.60 ± 10.60 | 5-55 Years | 114 (57.0%) | 86 (43.0%) |
| Body temperature | 37.77 ± 1.92 | 33-43℃ | ||
| DNA concentration | 300.57 ± 10.03 | 100.10-600.2.ng/l | ||
| A260/280 | 1.72 ± 0.55 | 0.7-5.11 |
Table 2: Demographic and Clinical characteristic of the study subject and basic characteristics of the DNA sample.
Malaria prevalence using microscopy and polymerase chain reaction
Out of the two hundred blood sample samples analysed by microscopy 167 (83.5%) were malaria positive, while a prevalence of 105 (52.5%) was recorded when analysed with polymerase chain reaction, as shown in Figure 2 below. Statistically the two different techniques show no significant difference (×2=0.787, df=1, P>0.05).

Figure 2: Chromosome 13 of Plasmodium falciparum indicating 18S portion of Ribosomal RNA gene.
Results of malaria diagnosis using PCR and microscopy
Table 3 below shows the diagnostic results of PCR and Microscopy, out of the two hundred (200) samples analysed by both techniques, 90 (45.0%) samples were positive by both PCR and microscopy, hence true positive, while 77 (38.5%) were negative with PCR but positive with microscopy, hence false negative. 15 (7.5%) samples were positive with only PCR, thus false positive and 18 (9.0%) samples were found to be negative when tested using both PCR and microscopy. Performance of Microscopy revealed that sixteen 16 (8.0%) samples were found to be false negative, 72 (36.0%) and 22 (11.0%) sample were false positive and true negative respectively.
| Microscopy | ||||
|---|---|---|---|---|
| Techniques | Positive | Negative | Total | |
| PCR | Positive | 90 (45.0%) | 15 (7.5%) | 105 (52.5%) |
| Negative | 77 (38.5%) | 18 (9.0%) | 95 (47.5%) | |
| Total | 167 (83.5%) | 33 (16.5%) | 200 (100%) | |
| Microscopy | ||||
| PCR | Positive | 90 (45.0%) | 72 (36.0%) | 162 (81.0%) |
| Negative | 16 (8.0%) | 22 (11.0%) | 38 (19.0%) | |
| Total | 106 (53.0%) | 94 (47.0%) | 200 (100%) | |
Table 3: Polymerase chain reaction and microscopy results.
Performance of PCR and microscopy in malaria diagnosis
Therefore the overall performance of PCR in relation to microscopy revealed sensitivity, specificity, positive predictive and negative predictive values of 53.89%, 54.54%, 85.71% and 18.94% respectively. PCR recorded an overall accuracy of 0.54. Microscopy revealed a sensitivity and specificity values of 84.91% and 23.40% respectively, while a positive predictive value of 55.53% and negative predictive value of 57.89% were recorded, with 0.81 as the overall performance recorded in microscopy as shown in Table 4 below.
| Determinant | PCR | Microscopy |
|---|---|---|
| Sensitivity | 53.89% | 84.91% |
| Specificity | 54.54% | 23.40% |
| PPV | 85.79% | 55.53% |
| NPV | 18.94% | 57.89% |
| Accuracy | 54.00% | 0.81. |
Note: PPV=Positive predictive value, NPV=Negative Predictive Value
Table 4: Performance of PCR and Microscopy in falciparum-malaria diagnosis.
One of the strategies to control malaria is the precise laboratorial diagnosis in order to treat positive cases appropriately and is one of the basic key strategy to malaria eradication [25,26]. In addition, World Health Organisation has since realized the importance and impact of novel techniques like PCR to malaria diagnosis in terms of reliability and accuracy in order to overcome various disadvantages and other shortcomings faced by microscopy as the gold standards and other recommended diagnostic technique. The two diagnostic techniques (PCR and microscopy) used in this study revealed two different results where microscopy reported a very high malaria prevalence of 83.5% and 52.5% by PCR. The difference observed may be attributed to the fact that microscopy produced additional 62 positive samples in excess of the 105 positive samples produced by PCR. Though PCR is more sensitive than microscopy as it can detect infection with parasite as low as 5 parasite/μL of blood sample [27].
Low sensitivity of PCR recorded in the presence study might be attributed to some other inherent factors of the technique like the concentration of the parasites’ DNA from which the 18srRNA gene was amplified from chromosome 13, this could lead to the decrease in the positive samples by the PCR as such affecting the sensitivity values of the PCR and other performance indices of the technique. In addition, microscopy is the one of the of most routine laboratory technique for the diagnosis of malaria infection in the study area, therefore laboratory technologists have a mystery of the technique which makes it difficult to be affected by some either internal or external factors un noticed [28,29]. Contrary to the findings of the presence study, Obimakinde, 2018 reported almost the same prevalence of 71.43% and 73.57% by microscopy and Polymerase chain reaction respectively. These high prevalence reported by the two techniques in the presence study is not surprising, instead it only confirms the endemicity of the disease in the study area.
Performance of PCR reported in the presence study in terms of sensitivity, specificity and negative predictive values is lower than that of who reported high performance of PCR with 65.3%, 95.6% and 98.8% as sensitivity, specificity and negative predictive values respectively, but with lower positive predictive value of 33.3% as compared to 85.79% reported in the presence status [30]. The sensitivity and specificity reported is also lower than 100% and 79% respectively reported by [31]. The sensitivity value of 53.89% of PCR reported in this study indicated that PCR was able to detect 53.89% of the subjects suffering from malaria. The sensitivity of PCR reported in this study is by far higher than 12.63% reported by from southeast Nigeria, when comparing the performance of different malaria diagnostic tools including PCR among pregnant Cohorts in Onitsha Christian, while 100% specificity value was recorded which higher than 54.54% reported in the presence study which was number of individuals free from malaria by PCR [32]. In addition, presence study recorded 85.79% as positive predictive value, which correspond to the number of subjects that tested positive and actually have malaria infection, while on the other hand negative predictive value of 18.94% reported in the presence study indicated the number of subjects that tested negative and actually do not have malaria disease. Though the sensitivity and specificity of PCR recorded in this study is lower than 95% and 90% respectively recommended by World Health Organisation, the technique (PCR) was able to confirm almost 86% subjects who actually have the disease condition (malaria).
Discussion
Microscopy recorded a sensitivity value of 84.91% in the presence study; this is similar to the findings of who reported a sensitivity value of 89.4 but with higher specificity, positive and negative predictive values of 100% each [33]. In addition, the findings from this study also contradict the findings of who reported a higher sensitivity, specificity and Positive and Negative predictive values of 91.0%, 97.5%, 96.8% and 92.8% respectively [34]. Microscopy in the presence study detected 84.91% of the individuals suffering from malaria infection and 23.40% free individuals. Nevertheless, 55.53% of the individuals tested positive and really have malaria, while 57.89% study subjects tested negative and they actually do not have malaria infection. Like in PCR, sensitivity and specificity values reported in the presence study is lower than the recommended of 95% and 90% respectively for sensitivity and specificity.
Conclusion
The accuracy of the two techniques used in this study was found to be 0.54 and 0.81 respectively for PCR and Microscopy. This finding is contrary to the finding of who reported a lower accuracy value of 0.42 and 0.4 respectively for microscopy and PCR. Both PCR and microscopy have demonstrated high level of sensitivity and specificity of PCR is by far higher than that of microscopy. Though the Sensitivity and specificity recorded is lower than World Health organizations’ recommended values, the techniques can still provide the minimum required result. Both techniques have relatively demonstrated appreciable predictive values with a very good level accuracy.
References
- Edem EN, Mbong EO, Hussain S (2020) Accuracy of malaria diagnosis by RDT using microscopy as gold standard amongst pregnant women attending antenatal clinic in Eket. Ann Clin Immunol Microbiol 2:1–4.
- Adeola O, Oluyomi S, Sola A, Bassey O, Oluwagbemiga A, et al. (2018) Performance of Microscopy Method and Rapid Diagnostic Tests in Malaria Diagnosis amongst Pregnant Women in Lagos, Southwest Nigeria. Divers Equal Heal Care 15:104-109.
- Yaya S, Bishwajit G, Ekholuenetale M, Shah V, Kadio B, et al. (2017) Knowledge of prevention, cause, symptom and practices of malaria among women in Burkina Faso. PLoS One 12:1-14.
[Crossref] [Googlescholar] [Indexed]
- Obimakinde ET, Simon-oke I, OsunyemiOs (2018) The effectiveness of microscopy: Rapid diagnostic test and molecular assay in diagnosing malaria. J Parasit Dis Diagnosis Ther 3:10-14.
- Musbau S, Bala U, Umar YD (2014) Prevalence of malaria parasite infection among pregnant women attending general Sani Abacha specialist hospital Damaturu. Sch J Appl Med Sci 2:3281-3283.
- Muhammad I, Abubakar B, Mohammed MT, Abdullahi A, Asiya M (2022) Determination of malaria rapid diagnostic test effectiveness compared to microscopy (Gold standard). DYSONA-Life Sci 3:49-56.
- Sixpence A, Nkoka O, Chirwa GC, Milanzi EB, Mangani C, et al. (2020) Levels of knowledge regarding malaria causes, symptoms and prevention measures among Malawian women of reproductive age. Malar J 19:1-13.
- Mbanefo A, Kumar N (2020) Evaluation of malaria diagnostic methods as a key for successful control and elimination programs. Trop Med Infect Dis 3:1-13.
- Depina AJ, Dia AK, Ascencao A de, Martins S, Ferreira MC, et al. (2019) Knowledge, attitudes and practices about malaria in Cabo Verde : a country in the pre-elimination context. BMC Public Health 19:1-14.
- Danwang C, Noubiap JJ, Souopgui J, Gaudart J, Yombi JC, et al. (2021) Accuracy of malaria diagnostic tests invasively collected performed on non- samples : a systematic review and meta- analysis. BMJ Glob Heal. 6:1-7.
- Hathiwala R, Mehta PR, Nataraj G, Hathiwala S (2017) LED fluorescence microscopy : Novel method for malaria diagnosis compared with routine methods. J Infect Public Health 10:824-828.
[Crossref] [Googlescholar][Indexed]
- Fransisca L, Kusnanto JH, Satoto TBT, Sebayang B, Andriyan E (2015) Comparison of rapid diagnostic test Plasmotec Malaria-3, microscopy and quantitative real-time PCR for diagnoses of Plasmodium falciparum and Plasmodium vivax infections in Mimika Regency, Papua, Indonesia. Malar J 2:1-11.
[Crossref] [Googlescholar] [Indexed]
- Zaki WM, Madkhali AM (2016) Accuracy of immunochromatography diagnostic test versus microscopy in the diagnosis of malaria among clinically suspected patients in Jazan area, KSA. Parasitol United J 9:95-102.
- Kitutu FE, Wamani H, Selling KE, Katabazi FA, Kuteesa RB, et al. (2018) Can malaria rapid diagnostic tests by drug sellers under field conditions classify children 5 years old or less with or without Plasmodium falciparum malaria? Comparison with nested PCR analysis. Malar J 17:1-12.
[Crossref] [Googlescholar] [Indexed]
- Badiane A, Thwing J, Williamson J, Rogier E, Diallo MA, et al. (2022) Sensitivity and specificity for malaria classification of febrile persons by rapid diagnostic test, microscopy, parasite DNA, histidine-rich protein 2 and IgG : Dakar, Senegal 2015. Int J Infect Dis 121:92-97.
- Ricciardi A, Ndao M (2015) Diagnosis of Parasitic Infections: What’s Going On ?. J Biomol Screen. 20:6-21.
- Nijhuis RHT, Van LL, Verweij JJ, Claas ECJ, Wessels E (2018) Multiplex real-time PCR for diagnosing malaria in a non-endemic setting : a prospective comparison to conventional methods. Eur J Clin Microbiol Infect Dis 37:2323-2329.
- Gupta P, Gupta P, Rao S, Singh N, Kalita D (2018) Comparison between microscopy and raid diagnostic tests in diagnosis of malaria at a tertiary medical care Institution in Uttarakhand (A-3 year study). Asian J Pharm and Clinical Res 11:23-25.
- Aigbiremo M, Cheryl E, Ndiaye T, Sadikh A, Ndiaye D, et al. (2021) Comparative analysis of four malaria diagnostic tools and implications for malaria treatment in southwestern Nigeria. Int J Infect Dis 108:377-381.
- Richardson DC, Ciach M, Zhong KJY, Crandall I, Kain KC (2002) Evaluation of the makromed dipstick assay versus PCR for diagnosis of plasmodium falciparum malaria in returned travelers. J Clin Microbiol 40:4528–4530.
- Nair CB, Manjula J, Subramani PA (2016) Differential diagnosis of malaria on truelab uno 1, a portable, real-time, micropcr device for point-of-care applications. PLoS One 11:1-14.
- Siwal N, Singh US, Dash M, Kar S, Rani S, et al. (2018) Malaria diagnosis by PCR revealed differential distribution of mono and mixed species infections by Plasmodium falciparum and P . vivax in India. PLoS One 13:1-14.
- Wardhani P, Verawaty T, Oetama C, Milka A, Hamidah N (2020) Test with real time polymerase detection method on mercial use. Infect Dis Rep 12:56-60.
- Londono BL, Eisele TP, Keating J, Bennett A, Chattopadhyay C, Heyliger G, et al. (2009) Haiti Emerg Infect Dis 15:14-16.
- Maria S, Santi DI, Kirchgatter K, Cristina K, Anna S, et al. (2004) PCR-based diagnosis to evaluate the performance of malaria referrence centres. Rev Inst Med trop S Paulo 46:183-187.
- Rifaie-graham O, Pollard J, Raccio S, Balog S, Rusch S, et al. (2019) As an assay for malaria diagnosis. Nat Commun 10:1-8.
- Rodulfo H (2007) Comparison of the diagnosis of malaria by microscopy, immunochromatography and PCR in endemic areas of Venezuela. Brazilian J Med Biol Res 40:535-543.
- Michael L, Wilson M (2013) Laboratory Diagnosis of Malaria. Arch Pathol Lab Med 137.
- Efunshile M, Bs MB (2011) Prevalence of the molecular marker of chloroquine resistance (pfcrt 76) in Nigeria 5 years after withdrawal of the drug as first-line antimalarial : A cross-sectional study. South Asia J Child Heal 5:39-42.
- Masanja IM, Mcmorrow ML, Maganga MB, Sumari D, Udhayakumar V, et al. (2015) Quality assurance of malaria rapid diagnostic tests used for routine patient care in rural Tanzania : Microscopy versus real-time polymerase chain reaction. Malar J 14:1-7.
- Uba CC, Ikegbunam MN, Anagor IS, Eleanya LC, Ezeumeh EN, et al. (2021) Comparative performance of different malaria diagnostic tools among pregnant cohorts in Onitsha Southeast Nigeria. Adv Infect Dis 11:384-394.
- Khan SA, Ahmed S, Mushahid N, Anwer M, Saeed S, et al. (2013) Comparison of real time polymerase chain reaction with microscopy and antigen detection assay for the diagnosis of malaria. J Coll Physicians Surg Pakistan 23:787-792.
- Adiatmaja CO, Butarbutar TV, Betaubun AM, Wardhani P (2020) Comparison of malaria microscopy and polymerase chain reaction for identification of Plasmodium in Papua, Indonesia. Syst Rev Pharm 11:91-95.
- Shankar H, Singh MP, Phookan S, Singh K, Mishra N (2021) Diagnostic performance of rapid diagnostic test, light microscopy and polymerase chain reaction during mass survey conducted in low and high malaria-endemic areas from two North-Eastern states of India. Parasitol Res 120:2251-2261.
[Crossref] [Googlescholar][Indexed]