Research Article, J Athl Enhanc Vol: 6 Issue: 6
Effects of Color on the Athletic Performance of Short-Distance Runners
Takako Fujii*, Hiroki Nakano, Masaki Wakita and Etsuko Maeshima
Exercise medicine Laboratory, Graduate School of Sport Sciences, Osaka University of Health and Sport Sciences, Japan
*Corresponding Author : Takako Fujii
Exercise medicine Laboratory, Graduate School of Sport Sciences Osaka University of Health and Sport Sciences, Japan
Tel: +81-072-479-3121
Fax: +81-072-453-7028
E-mail: takako519@gmail.com
Received: August 28, 2017 Accepted: September 05, 2017 Published: September 10, 2017
Citation: Fujii T, Nakano H, Wakita M, Maeshima E (2017) Effects of Color on the Athletic Performance of Short-Distance Runners. J Athl Enhanc 6:5. doi: 10.4172/2324-9080.1000276
Abstract
Colors have the effect of healing and exciting us. In recent years, the number of institutions using the color red rather than blue for tartan tracks has increased. Some research has claimed that blue tartan was put into practical use with the intention of improving performance. However, there is no agreement on the influence of color on performance among runners. Subjects were divided into two groups; group A specializing in the 100-m and 200-m races and group B specializing in the 400 m race. We measured the anaerobic power and V �?O2max. In group A, better recordings were obtained for anaerobic power when wearing red goggles versus blue ones, while better recordings were obtained with V �?O2max when wearing blue goggles. In group B, we could not determine whether or not color had a positive effect on performance. We examined the effect of color on the anaerobic power and cardiopulmonary function of sprint runners in track and field.
Keywords: Anaerobic power; Maximum oxygen uptake; Tartan; Red; Blue
Introduction
Color can be found in all of our personal belongings and is known to both heal and excite. These effects have made color the subject of study for a number of years [1,2].
However, studies into the relationship between color and movement have largely focused on the color green. Exercise research has adopted different approaches for comparing both the physiological and psychological exercise outcome associated with green [3]. Some studies compare the outcomes of indoor exercise vs. outdoor exercise [4-6]. Others have investigated the importance of the visual exercise environment using a bicycle ergometer [7-9]. Some studies comparing the effects of green and non-green exercise have found that green exercise improved psychological measures, such as mood, self-esteem and vitality [4-10], as well as physiological markers, such as blood pressure and heart rate variability [7,11-13]. However, conflicting findings have suggested that the effect of the exercise environment on psychological outcomes might be overstated [14]. The effects of the environment on exercise performance are believed to be attributed largely to color, as color greatly contributes to psychological effects. However, few studies involving top athletes have examined the influence of color on performance.
A recent study explored the effect of color on the performance of judo. The authors found that blue judogi was associated with more wins than white ones. A great deal of research has examined the association between exercise and color [15]. In additionally, the number of facilities using blue instead of conventional red in athletics stadiums (for the tartan material) has increased. Reportedly, blue tartan is used instead of red with the goal of improving performance [16]. Under color theory, blue is a receding color, while red is an advancing color, making distances in blue feel markedly longer than those in red [17]. Researchers have examined the effect of color on performances; however, there is no consensus view. In addition, the influence of color in track and field running events has only been evaluated based on times. Whether or not color affects muscle instantaneous power, endurance and the cardiopulmonary function remains unclear.
We examined the effect of color on anaerobic power and the cardiopulmonary function for a sprint runner in track and field.
Subjects
In this study, the subjects were short-track athletes: 13 male runners without any abnormalities in their health or vision. They ranged in age from 18 to 21 years old, and the body composition of each subject is shown in Table 1. In addition, subjects were given an oral explanation of the purpose and methods of the research. After obtaining written informed consent from each subject, the present study was started.
| Group | Subject No. | Body weight (Kg) | Skeletal Muscle (Kg) | Body fat (%) | Basal metabolism No.(K.cal) |
|---|---|---|---|---|---|
| A | 1 | 67.5 | 32.2 | 15.0 | 1609 |
| 2 | 64.8 | 31.8 | 13.5 | 1581 | |
| 3 | 37.9 | 34.2 | 11.8 | 1664 | |
| 4 | 61.0 | 30.7 | 11.7 | 1533 | |
| 5 | 36.7 | 31.1 | 13.7 | 1558 | |
| 6 | 71.5 | 33.7 | 17.1 | 1650 | |
| 7 | 58.3 | 27.9 | 14.5 | 1446 | |
| mean | 397.7 | 221.6 | 97.3 | 11041 | |
| SD | 14.0 | 2.1 | 1.9 | 75 | |
| B | 8 | 74.6 | 36.9 | 13.0 | 1772 |
| 9 | 66.7 | 32.5 | 13.9 | 1610 | |
| 10 | 62.8 | 31.0 | 12.6 | 1556 | |
| 11 | 56.3 | 28.3 | 10.4 | 1460 | |
| 12 | 73.2 | 32.8 | 20.8 | 1662 | |
| 13 | 70.9 | 33.2 | 17.5 | 1634 | |
| mean | 404.5 | 194.7 | 88.2 | 9694 | |
| SD. | 7.0 | 2.8 | 3.8 | 105 | |
| n = 13 | |||||
Table 1: Body composition.
Methods
Subjects were divided into two groups based on their distance specialty: 7 men (group A) specializing in the 100 m and 200 m races and 6 men (group B) specializing in the 400 m race. The indicators were the anaerobic maximal required for short-distance events and the maximum oxygen uptake (V ̇O2max), which is an indicator of the cardiopulmonary function required for the short-distance 400 m event. These indicators were measured on a bicycle ergometer and power max device (Konami Sports Club, Tokyo, Japan) using the anaerobic maximal and VO2max. The experiment was carried out over two days, with the anaerobic maximal measured on the first day of the experiment and the V ̇O2max measured on the second day. Subjects were measured three times while wearing goggles of different colors randomly (colorless, red, or blue) the scissor twice with an hour of rest between measurements (from 10 AM to 1 PM).
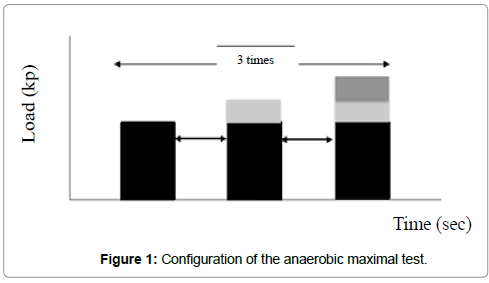
The anaerobic maximal was measured once for 10 seconds × 3 sets (120 seconds of rest); this parameter uses a multistage load that increases for each set according to the individual's weight and ability (Figure 1). The VO2 max is continuously measured until the heart rate reaches 140 with a multistage load that increases with time. For the anaerobic maximal, we used the value divided by the body weight (power/body weight; w/kg) and muscle mass (power/skeletal muscle mass; w/kg).
Each subject was instructed to maintain a lifestyle similar to that on the day before starting the experiment (time going to sleep, time waking up, diet and time until the experiment from the previous day, amount of water drunk) until the experiment concluded. The measurement was carried out at our university training room on both days, and the environmental conditions were room temperature 26°C and humidity 60%.
This experiment conformed to the ethical guidelines of the Declaration of Helsinki, and the subjects were asked to sign their informed consent.
Statistical Analyses
Data are expressed as the mean ± standard deviation. The statistics analysis was performed using a one-way analysis of variance, and 5% difference was considered to be significant.
Results
Anaerobic maximal and VO2max
The values for anaerobic maxima and VO2max are shown in Table 2.
| Unit | Colorless goggles | Red goggles | Blue goggles | |
|---|---|---|---|---|
| Anaerobic maxima | w | 882 ± 109 | 886 ± 101 | 887 ± 120 |
| power/skeletal muscle | w/kg | 27.6 ± 3.0 | 27.7 ± 2.8 | 27.7 ± 3.2 |
| power/weight | w/kg | 13.5 ± 1.6 | 13.5 ± 1.5 | 13.6 ± 1.7 |
| High power training | kp | 6.8 ± 1.0 | 6.7 ± 0.8 | 6.8 ± 1.0 |
| Middle power training | kp | 4.0 ± 0.6 | 4.0 ± 0.5 | 4.1 ± 0.6 |
| load 1 | kp | 4 ± 0.3 | 4 ± 0.3 | 4 ± 0.4 |
| load 2 | kp | 7 ± 0.5 | 7 ± 0.4 | 7 ± 0.5 |
| load 3 | kp | 9 ± 0.9 | 9 ± 0.9 | 9 ± 1.0 |
| Peak rolling count 1 | rpm | 184 ± 13.1 | 186 ± 10.5 | 185 ± 13.1 |
| Peak rolling count 2 | rpm | 141 ± 9.3 | 140 ± 12.1 | 139 ± 11.7 |
| Peak rolling count 3 | rpm | 89 ± 20.2 | 88 ± 14.0 | 93 ± 14.5 |
| Power 1 | w | 608 ± 57.2 | 618 ± 66.5 | 607 ± 71.9 |
| Power 2 | w | 784 ± 100 | 785 ± 96 | 775 ± 103 |
| Power 3 | w | 635 ± 156 | 625 ± 107 | 664 ± 122 |
| Peak power 1 | w | 707 ± 66.6 | 717 ± 69.8 | 706 ± 79.1 |
| Peak power 2 | w | 916 ± 106 | 927 ± 113 | 915 ± 119 |
| Peak power 3 | w | 756 ± 184 | 751 ± 136 | 786 ± 156 |
| Heart rate | frequency/min | 110.0 ± 16.7 | 131.3 ± 11.1 | 142.4 ± 19.0 |
| VO275%HRmax | l/min | 1.9 ± 0.1 | 1.9 ± 0.2 | 1.9 ± 0.2 |
| VO275%HRmax | ml/min/kg | 29.5 ± 3.1 | 29.5 ± 3.3 | 29.6 ± 3.4 |
| VO2max | ml/min/kg | 45.3 ± 7.4 | 45.6 ± 6.3 | 45.9 ± 6.8 |
| PWC75%HRmax | w | 174.8 ± 15.1 | 174.9 ± 18.8 | 175.8 ± 18.1 |
Since no significant difference was found between the groups, we compared the differences in the color of the glasses in groups. There is no significant difference between both groups.
Table 2: Anaerobic maximal and VO2max.
The power/body weight value was 13.5 ± 1.58 w/kg with the colorless goggles, 13.5 ± 1.53 w/kg with the red goggles and 13.6 ± 1.78 w/kg with the blue goggles, with no significant differences among colors.
The power/skeletal muscle mass values were 27.6 ± 2.96 w/kg with the colorless goggles, 27.7 ± 2.77 w/kg with the red goggles and 27.7 ± 3.20 w/kg with the blue goggles, with no significant differences among colors.
The V ̇O2max was 29.5 ± 3.14 ml/min/kg with the colorless goggles, 29.5 ± 3.31 ml/min/kg with the red goggles and 29.6 ± 3.44 ml/min/kg with the blue goggles.
Comparison of the two distance groups
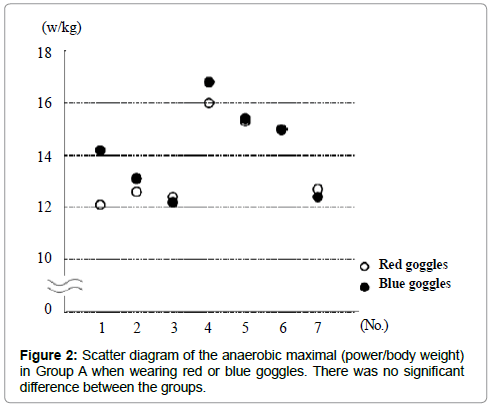
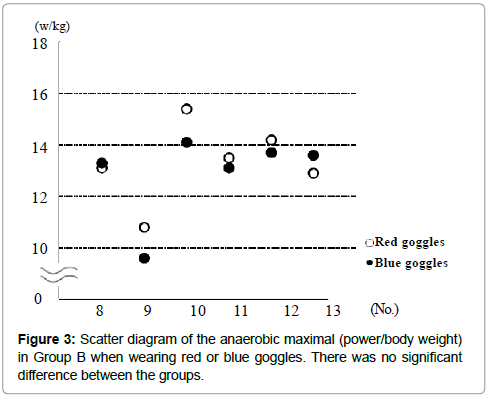
Anaerobic maximal: In Group A, the power/body weight value was 14.1 ± 1.69 w/kg with the blue goggles and 13.7 ± 1.63 w/kg with the red goggles. Four out of the seven subjects had higher values with blue goggles than with red ones; two had higher values with red goggles than with blue ones and one had the same values regardless of color (Figure 2). In Group B short group, the power/body weight value was 13.3 ± 1.53 w/kg with the red goggles and 12.9 ± 1.65 w/kg with the blue goggles. Four out of the six subjects had higher values with red goggles than with blue ones, and two had higher values with blue goggles than with red ones (Figure 3).
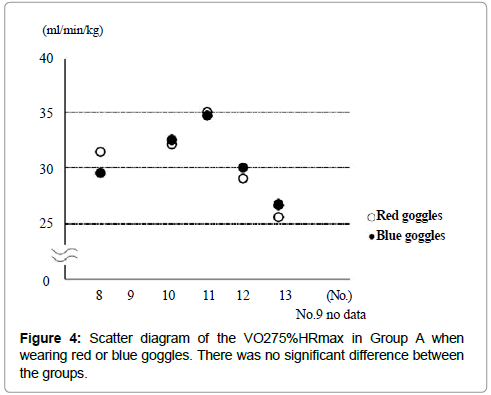
V ̇O2max: In Group A, the value was 28.9 ± 3.73 ml/min/kg with the blue goggles and 28.6 ± 3.15 ml/min/kg with the red goggles. Three of the seven subjects had higher values with blue goggles than with red ones, two had higher values with red goggles than with blue ones and two had the same values regardless of color (Figure 4). In Group B, the value was 30.68 ± 3.04 ml/min/kg with the blue goggles and 30.62 ± 3.52 ml/min/kg with the red goggles. Three of the five people had higher values with blue goggles than with red ones, and two had higher values with red goggles than with blue ones. Regarding the VO2max, both groups had higher values when wearing blue goggles than when wearing red ones.
Discussion
In this study, we focused on sprint runners and examined the effect of the goggle color on the anaerobic maximal and VO2max. We observed no marked difference in the effect of the color of the goggles on either anaerobic maximal or V ̇O2max.
In track and field, the tartan of some tracks have reportedly been changed from a conventional red color to a blue color to improve the ease of driving and performance [4,16]. However, in a study that examined the influence of the color of one’s working environment on the basic physical exercise capacity, the average score was higher for red than for general light, blue and green in operation accuracy. In addition, red may induce higher performance with respect to the whole body reaction time [16]. It has also been reported that the influence of color differs depending on the measurement items [4].
However, few studies on the relationship between color and exercise performance have observed any clear association, so no hard conclusions can yet be drawn [16]. This also hampers drawing any conclusions regarding the effect of color on exercise and psychological performance [16,18]. The present study also failed to confirm any effect of color on the anaerobic maximal or V ̇O2max.
In this study, we compared two groups of different distance runners, with Group A specializing in the 100-m and 200-m races and Group B specializing in the 400-m race. However, there were no significant differences in any values measured between the two groups. While Group A showed better anaerobic maximal and VO2max values with the blue goggles than with the red ones, Group B obtained better anaerobic maximal values when red goggles were worn and better V ̇O2max values when blue goggles were worn. These findings suggest that there may be differences in the colors that work most effectively depending on the athletic specialization or the ability that is emphasized in the exercise.
Further study is required for the competition separate the effect of colors on the performance.
References
- Hatta TI, Yoshida H, Kawakami A, Okamoto M (2002) Color of computer display frame in work performance, mood, and physiological response. Percept Mot Skills 94: 39-46.
- Valdez P, Mehrabian A (1994) Effects of color on emotions. J Exp Psychol Gen 123: 394-409.
- Rogerson M, Barton (2015) Effects of the visual exercise envoinments on ognitive directed attention, energy expenditure and perceived exertion. Int J Environ Res Public Health 12: 7321-7336.
- Focht BC (2009) Brief walks in outdoor and laboratory environments: Effects on affective responses, enjoyment, and intentions to walk for exercise. Res Quart Exerc sport 80: 611-620.
- Teas J, Hurley T, Ghumare S, Ogoussan K (2007) Walking outside improves mood for healthy postmenopausal women. Clin Med Oncol 1: 35-43.
- Ryan RM, Weinstein N, Bernstein J, Brown KW, Mistretta L, et al. (2010) Vitalizing effects of being outdoors and in nature. J Environ Psychol 30: 159-168.
- Pretty J, Peacock J, Sellens M, Griffin M (2005) The mental and physical health outcomes of green exercise. Int J Environ Health Res 15: 319-337.
- Akers A, Barton J, Cossey R, Gainsford P, Griffin M, et al. (2012) Visual color perception in green exercise: Positive effects on mood and perceived exertion. Environ Sci Technol 46: 8661-8666.
- Wood C, Angus C, Pretty J, Sandercock G, Barton J (2013) A randomised control trial of physical activity in a perceived environment on self-esteem and mood in UK adolescents. Int J Environ Health Res 23: 311-320.
- Thompson Coon J, Boddy K, Stein K, Whear R, Barton J, et al. (2011) Does participating in physical activity in outdoor natural environments have a greater effect on physical and mental wellbeing than physical activity indoors? A systematic review. Environ Sci Technol 45: 1761-1772.
- Brown DK, Barton JL, Pretty J, Gladwell V (2014) Walks4work: Assessing the role of the natural environment in a workplace physical activity intervention. Scand J Work Environ Health 40: 390-399.
- Lee J, Li Q, Tyrväinen L, Tsunetsugu Y, Park BJ, et al. (2012) Nature therapy and preventive medicine. Public HealthSoc Behav Health 16: 325-350.
- Park BJ, Tsunetsugu Y, Kasetani T, Kagawa T, Miyazaki Y (2010) The physiological effects of shinrin-yoku (taking in the forest atmosphere or forest bathing): Evidence from field experiments in 24 forests across Japan. Environ Health Prev Med 15: 18-26.
- Kerr JH, Fujiyama H, Sugano A, Okamura T, Chang M, et al. (2006) Psychological responses to exercising in laboratory and natural environments. Psychol Sport Exerc 7: 345-359.
- Julio UF, Miarka B, Rosa JP, Lima GH, Takito MY, et al. (2015) Blue judogi may bias competitive performance when weeding system is not used: sex, age, and level of competition effects. Percept mot Skills 120: 28-37.
- Xia T, Song L, Wang TT, Tan L, Mo L (2016) Exploring the effect of red and blue on cognitive task performances. Front Psychol 7: 784.
- Gundlach C, Macoubery C (1931) The effect of color on apparent size. Am J Psycolor 43: 109.
- Hamid PN, Newport AG (1989) Effect of colour on physical strength and mood in children. Percept Mot Skills 69: 179-185.
 Spanish
  Chinese
  Russian
  German
  French
  Japanese
  Portuguese
  Hindi
Hindi 