Spanish
  Chinese
  Russian
  German
  French
  Japanese
  Portuguese
  Hindi
Hindi Research Article, J Fashion Technol Textile Eng Vol: 9 Issue: 12
Experimental Study and Improving the Productivity of Assembly Line Balancing in Teleja Garment Manufacturing in Ethiopia
Yohannes Admassu*
Department of Garment Technology, Faculty of Textile and Apparel Fashion Technology, Ethiopian Technical University, Addis Ababa, Ethiopia
- *Corresponding Author:
- Yohannes Admassu
Department of Garment Technology, Faculty of Textile and Apparel Fashion Technology, Ethiopian Technical University, Addis Ababa, Ethiopia
Tel: 0941956066
E-mail: admassu77777@gmail.com
Received Date: December 20, 2021; Accepted Date: January 03, 2022; Published Date: January 10, 2022
Citation: Admassu Y (2021) Experimental Study and Improving the Productivity of Assembly Line Balancing in Teleja Garment Manufacturing in Ethiopia. J Fashion Technol Textile Eng 9:12. 233. DOI: 10.37532/jftte.2021.9(12).233
Copyright: All articles published in Journal of Fashion Technology & Textile Engineering are the property of SciTechnol, and are protected by copyright laws. Copyright © 2021, SciTechnol, All Rights Reserved.
Abstract
This study is designed to assess and improve apparel sewing section efficiency and productivity throughout line balancing. Apparel industry is one of the oldest and among the most global industry, being primarily concerned with the design and production of cloth and their supply. The central process in apparel manufacturing is the joining together of components which is known as the sewing process , which is the most labour intensive type of manufacturing process. Proper utilization of resources in garment sewing section is more critical to enhance the performance of the apparel industry by reducing production cost and minimizing wastage. For effective utilization of resources in the sewing section, good line balancing is important to increase productivity and production efficiency. This research was a design to analyse and improve the assembling line in the case of Telaje garment manufacturing and sales plc. The study was first conduct observations in the production floor and start work with the selection of sewing line in the garment production process. Among the nine lines of the factory select one on the production floor and one garment ordered product known as five pocket men’s jeans trousers are selected. For this study, both qualitative and quantitative research approaches were employed. Both primary and secondary data sources are used to detail the collected relevant data to understand the current efficiency scenario of the factory. The main challenges to minimizing line efficiency and productivity with the expected performance measurement are improper utilization of resources and improper implementation of line balancing in sewing section, therefore this thesis work shows that the bottleneck process and consequence solution will be searched, and finally significantly improving the productivity by 418 unit products/ day and, hence the efficiency will increase from 28.83% to 50.04% of the line.
Keywords: Assembly line; Line balancing; Bottleneck; Productivity
Keywords
Assembly line; Line balancing; Bottleneck; Productivity
Introduction
As a supply chain of textile industry, garment industry is one of the major industries of the world [1]. The production process of garments is separated into four main phases: designing/ clothing pattern generation, fabric spreading and cutting, sewing and ironing, and packing. The joining together of garment components, known as the sewing process which is the most labour intensive part of garment manufacturing. Furthermore, since the sewing process is labour intensive; apart from material costs, the cost structure of the sewing process is also important [2,3]. Therefore, this process is of critical importance and needs to be planned more carefully As a consequence, good line balancing with small stocks in the sewing line has to be drawn up to increase the efficiency and quality of production. The production process includes a set of workstations, at each of which a specific task is carried out in a restricted sequence, with hundreds of employees and thousands of bundles of subassemblies producing different styles simultaneously. An assembly line is defined as a set of distinct tasks which is assigned to a set of workstations linked together by a transport mechanism under detailed assembling sequences specifying how the assembling process flows from one station to another [4]. In assembly line balancing, the allocation of jobs to machines is based on the objective of minimizing the workflow among the operators, reducing the throughput time as well as the work in progress and thus increasing the productivity. Sharing a job of work between several people is called division of labour. Division of labour should be balanced equally by ensuring the time spent at each station is approximately the same. Each individual step in the assembly of the product has to be analysed carefully and allocated to stations in a balanced way over the available workstations. Each operator then carries out the operations properly and the work flow is synchronized [5, 6]. Manufacturing a product in an assembly line requires partitioning the total amount of work into a set of elementary operations called tasks. Tasks are assigned to operators depending on the constrains of different labour skill levels. Assembly lines have been widely used in various production systems to produce high volume standardized products. An assembly line includes a series of stations arranged along a material handling system. The components are processed depending on a set of tasks for a given cycle time. Tasks are assigned to an ordered sequence of stations according to a given precedence relationship among them. The problem of assigning tasks to stations to optimize a specific objective, such as minimizing the number of stations for a given cycle time, minimizing the cycle time for a given number of stations, or maximizing the efficiency of an assembly lines, subject to the precedence relationships among tasks, is called the assembly line balancing (ALB) problem. Multi-manned assembly line balancing problems (MALBP) are a new type of generalized assembly line balancing problems in which there is the possibility of assigning more than one operator to each work station according to the product features [3,7]. These types of balancing problems typically occur in industries with high volumes of products. In this type of assembly line, in each workstation, instead of one worker, several workers simultaneously perform different operations on the same individual product. The main goal of using this kind of multi manned workstations is to minimize the number of workstations in the line while the total effectiveness of the line (in terms of the number of workers) remains optimal. In this work, the asses’ assembly line balancing of the sewing sections to enhance the productivity and efficiency of the company
Materials and Methodology
Methods
This research was designed to analyse and enhance the assembling lines in the case of Telaje garment Manufacturing and sales Plc. The study was first conducted through observation starting from the production floor. Selection of sewing lines and ordered products are made. Then the experimental work is performed and then analysed. Based on the results obtained, the way for improving asse Telaje garment production will be proposed. Both qualitative and quantitative approach methods were used. Collected data were analysed using descriptive statistics for analysis. The obtained results were presented using numerical value and the graph
Data Collection
The data were collected from Telaje Garment Manufacturing and Sales plc. in the garment sewing section. Both primary and secondary data sources were used to collect relevant data. Primary data was collected from direct observation from the production floors and interviews with the line supervisors and other responsible persons. The data mainly focused on one type of product within the assembling line knows as five pocket men Jeans Trousers. Secondary data were collected through reviewing related literature, different books and journals and different legal documents. For the effectiveness of this study, some garment sewing section line balancing calculations including work study, time study, and SMV were used.
Data Analysis
For this study, among nine lines of the factory, one line on the production floor, and one garment ordered product which is known as five pocket men’s jeans trousers are selected. For the selected product, perform an operation breakdown based on their style and operational sequences before doing line balance. Working out a performance breakdown to compare the current factory method and the possible standard methods. Examine work measurement to establish the time for a qualified worker to carry out a specified job at a defined level of performance, and collecting and recording the time studies to systematic recording and critical examination of existing & proposed ways of doing work. Further Calculation was made for SMV & Efficiency to know the time required to complete one piece of garment by a qualified (standard) operator at standard condition. Finally, for smooth production flow, improved efficiency and productivity, appropriate and a balance line will be proposed with modified layout based on.
Results and Discussion
For this thesis work the researcher interpret and analysis three main data, first analysis current company used data as it is, this data was directly collected from the company. Secondly analysis current factory performance study by the researcher who record observing time to analysis correctly for method study and time study to the current garment assembly line in sewing section, thirdly critically analysis assembly line balance of the factory and implemented finding solutions on the assembly line balancing of Telaje garment and sales plc., Based on the two data reduce drawback of the existing scenario and implementation proposed solutions to enhance productivity and efficiency (Table-1).
| Assigned | Description of operation Type of machine |
M/c type | No. opr | Cycle time | Rating (%) |
SAM | |||||
|---|---|---|---|---|---|---|---|---|---|---|---|
| 1 | 2 | 3 | 4 | 5 | Avg | ||||||
| A01 | O/L Fly Box and Left Fly | 3Th o/l | 1 | 32 | 31 | 33 | 30 | 32 | 31.6 | 80 | 0.53 |
| B | Front | ||||||||||
| B01 | Attach Side Pkt facing to Pkt Lining | DNLS | 1 | 14 | 15 | 13 | 14 | 14 | 14 | 85 | 0.25 |
| B02 | hem coin pkt | DNLS | 1 | 12 | 12 | 13 | 12 | 12 | 12.2 | 90 | 0.23 |
| B03 | press coin pkt edge | Iron | 17 | 16 | 17 | 16 | 17 | 16.6 | 85 | 0.29 | |
| B04 | attach coin pkt | DNLS | 23 | 22 | 21 | 23 | 24 | 22.6 | 80 | 0.38 | |
| B06 | Sew Side Pocket Bag To Front | DNLS | 2 | 38 | 37 | 39 | 36 | 36 | 37.2 | 80 | 0.63 |
| B07 | top s/t side pkt bag | SNLS | 1 | 29 | 28 | 27 | 25 | 26 | 27 | 80 | 0.46 |
| B08 | Run Stich Side Pkt Bag | DNLS | 1 | 19 | 20 | 19 | 21 | 22 | 20.2 | 85 | 0.36 |
| B09 | Tack Side Pkt | SNLS | 1 | 29 | 29 | 27 | 28 | 26 | 27.8 | 80 | 0.47 |
| B10 | Sew Left Front Fly & Edge S/T | SNLS | 2 | 55 | 54 | 57 | 53 | 55 | 54.8 | 75 | 0.87 |
| B11 | J-Stitch | SNLS | 1 | 26 | 24 | 24 | 24 | 25 | 24.6 | 85 | 0.44 |
| B12 | Attach Zipper Right Fly & Fly Box | DNLS | 2 | 53 | 52 | 51 | 51 | 51 | 51.6 | 75 | 0.82 |
| B13 | Front Rise Attach | SNLS | 1 | 43 | 44 | 43 | 42 | 42 | 42.8 | 75 | 0.68 |
| B14 | Top Stich Front Rise | SNLS | 1 | 26 | 27 | 25 | 24 | 23 | 25 | 85 | 0.45 |
| C | Back | ||||||||||
| C01 | hem back pkt mouth | DNLS | 2 | 21 | 23 | 23 | 19 | 26 | 22.4 | 80 | 0.38 |
| C02 | sew decoration stitch | 1 | 74 | 72 | 73 | 72 | 71 | 72.4 | 70 | 1.07 | |
| C03 | Mark Back Pkt Position | W/Table | 1 | 18 | 16 | 15 | 19 | 17 | 17 | 85 | 0.31 |
| C04 | Attach Bk pkt to back trouser | SNLS | 5 | 125 | 122 | 127 | 119 | 121 | 106.4 | 70 | 1.58 |
| C05 | Attach back yoke & trouser | 5TH OL | 1 | 32 | 30 | 29 | 31 | 30 | 30.4 | 85 | 0.55 |
| C06 | top s/t back yoke & trouser | FOA | 1 | 35 | 34 | 36 | 32 | 35 | 34.4 | 80 | 0.57 |
| C07 | Sew Back Rise | 5TH OL | 1 | 18 | 19 | 21 | 23 | 19 | 20 | 80 | 0.33 |
| C08 | Top Stich Back Rise | FOA | 1 | 29 | 27 | 23 | 28 | 27 | 26.8 | 80 | 0.45 |
| D | Assembly | ||||||||||
| D01 | Sew Inseam | 5th ol | 1 | 142 | 137 | 144 | 134 | 140 | 139.4 | 70 | 2.06 |
| D02 | Top Stitch Side Seam | FOA | 1 | 121 | 128 | 144 | 144 | 144 | 136.2 | 70 | 2.02 |
| D03 | Sew Side Seam | 5TH OL | 1 | 51 | 49 | 49 | 52 | 51 | 50.4 | 75 | 0.8 |
| D04 | Topstitch waist side | SNLS | 1 | 40 | 38 | 34 | 36 | 35 | 36.6 | 80 | 0.62 |
| D05 | Make Belt Loop | BLM/fdr | 1 | 18 | 18 | 19 | 18 | 17 | 18 | 90 | 0.34 |
| D06 | Mark Belt Loop Position | 1 | 29 | 26 | 29 | 30 | 26 | 28 | 85 | 0.48 | |
| D07 | Tack Belt Loop On Waist Body | SNLS | 1 | 51 | 51 | 51 | 53 | 51 | 51.4 | 80 | 0.86 |
| D08 | Waist Band Attach To Body | SNLS | 4 | 215 | 178 | 225 | 218 | 224 | 212 | 75 | 3.36 |
| D09 | Topstitch waist band corner | SNLS | 4 | 427 | 447 | 440 | 448 | 416 | 435.6 | 70 | 6.45 |
| D10 | Bottom Hemming | SNLS | 1 | 147 | 144 | 140 | 155 | 145 | 146.2 | 75 | 2.32 |
| D11 | Make Tack On Fly, Side Pkt | BT | 1 | 39 | 41 | 39 | 40 | 48 | 41.4 | 80 | 0.7 |
| D12 | Quality Inspection | 42 | 42 | 43 | 41 | 40 | 41.6 | 80 | 0.7 | ||
| D12 | Trimming | 32 | 34 | 33 | 30 | 33 | 32.4 | 85 | 0.58 | ||
| Sum | 2122 | 2087 | 2146 | 2141 | 2121 | 2123.4 | 80 | 33.39 | |||
Table 1: Line balancing data of the factory.
The above data was collected by the researcher using stop watch method for five cycle time during the production process, in some causes this cycle time extended up to fifteen if the recorded data have high range. From the Table 1, the researchers only wrought recording observing time and calculated SAM value, such as operation breakdown of five pockets, mean jeans, trousers, machine types, and target output taken as it is. The data was collected from each operator during performing each task, the data was recorded in seconds by stop watch method, this data is known as observing time, so that to assembly five pockets mean jeans trousers 2123.4 seconds observing time is required and 33.39 standard minute. From this we understand SAM values of the Table 1 approached to the standard SAM value of five pockets mean jeans trousers. According to Sharmin Akter, Kazi Rezwan Hossain [8]
Efficiency= {(per hour production × total SMV)/ (man required × working minute)} × 100%
Where the numbers of operators are 44 and garment SAM is 33.39
Efficiency= {(per hour production × total SMV)/ (man required × working minute)} ×100%
=184×33.39×8×100
=44×480
= 29.1%
According to Noor Ahmed Raaz [5]
To calculate the operator efficiency, the following formula should be followed by any industrial engineer. Examples to calculate a single operation such as O/L Fly Box and Left Fly
Operator efficiency (%) = (Total minute produced by an operator × 100) / Total minute attended
Where, Total minutes produced=Total pieces made × SAM of the operation
Thus that Total minute produced=184 × 1.0145
=186.668
Total minutes attended=Total hours worked in the machine × 60
= 8hr × 60
= 480
Operator Efficiency % = (Total minute produced by an operator × 100) / (Total minute attended by operator)
= (186.668 ×100) / 480
=38.89%
In Figure 1 the researcher observes and records the individual operator cycle times to perform each task to be assigned. The graphs indicate the maximum and minimum observing time of 10 operators. First five observing times indicate high time taken operation and the second five operations are low operation time taken

Figure 1: Process time.
Pitch Time = Garment SAM / No. of operations.
In Figure 2 Pitch time is used for line setting and calculating the production targets for the line.

Figure 2: Pitch Time graph.
A graphical presentation of individual operation’s time and pitch time on the same chart is called pitch diagram. In this chart on X-axis operation the assigned name and on Y-axis the time value is depicted. First, conduct a capacity study for all operators and determine how many pieces the operators are making at each operation. Where more than one operator is doing the same operation, sum up their capacity for that particular operation. Based on this information, the calculated existing scenario of pitch time is mandatory for assembly line balancing (Figure 3).

Figure 3: Operator efficiency.
Control limits Upper limit= (pitch time ×100) / Target organization efficiency
Lower limit= 2×pitch time upper limit
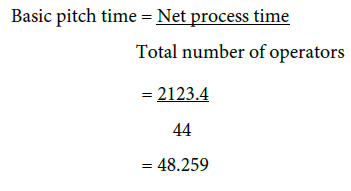
Where pitch time referee value for synchronization of the division of labour, it provides the average time allotted to each worker.
Pitch time =48.259
Target organization efficiency=55%
Upper limit= (48.259×100) / 55
=87.74seconds
Lower limit= 2×pitch time upper limit
=2×48.259-87.74
=8.778 seconds
The above Table 2 and data somehow it is different from the existing data in operational breakdown and sequence. Those data work on based on preceding diagram and standard operational sequence of five pocket jeans men trouser. Observed Data are recorded by the researcher by using of stop watch methods and same calculated method from the above.
| Sl. no. | Operations | M/C Type | Manpower | Average Basic Time | SMV |
|---|---|---|---|---|---|
| Front | |||||
| Coin pocket hemming | DNLS | 1 | 14 | 0.23 | |
| Coin pocket attach jet piece (right) | DNLS | 1 | 29 | 0.47 | |
| Pocket bag attach with jet piece | DNLS | 1 | 38 | 0.62 | |
| O/l pocket bag | 3T O/L | 1 | 21 | 0.35 | |
| Top stitch pocket bag | SNLS | 1 | 23 | 0.37 | |
| O/l zipper fly | 3T O/L | 1 | 14 | 0.23 | |
| O/l front panels @ crotch | 3T O/L | 1 | 15 | 0.25 | |
| Zipper attach @ left fly | DNLS | 1 | 31 | 1.0 | |
| Left fly attach front panel (inseam & top stitch) | SNLS | 2 | 50 | 0.8 | |
| J-stitch left fly | SNLS | 1 | 19 | 0.32 | |
| Front pocket mouth hemming | DNLS | 1 | 16 | 0.41 | |
| Pocket bag stitch to front panel side & top (wt. W/c label) | SNLS | 2 | 37 | 0.6 | |
| Right fly attach with zipper & crotch join | SNLS | 2 | 47 | 0.76 | |
| Back | |||||
| Pocket hemming | DNLS | 1 | 28 | 0.46 | |
| Pocket o/l | ST O/L | 1 | 13 | 0.22 | |
| Pocket creasing | ADPC | 1 | 16 | 0.27 | |
| Pocket attaching | SNLS | 5 | 105 | 1.77 | |
| Second stitch back pocket | SNLS | 1 | 17 | 0.28 | |
| Back yoke attach | ST O/L | 1 | 120 | 1.94 | |
| Back rise join | ST O/L | 1 | 32 | 0.53 | |
| Size label attach | SNLS | 1 | 23 | 0.38 | |
| Assembly | |||||
| Main label attach waist band, & w/b joining in chain | SNLS | 6 | 186 | 3.1 | |
| Sew inseam | FOA | 2 | 39 | 0.65 | |
| Side seam join (attach front & back panels) | 5T O/L | 2 | 33 | 0.8 | |
| Top stitch side seam | ST O/L | 2 | 51 | 0.85 | |
| Prepare waists band | SNLS | 1 | 48 | 0.81 | |
| Waist band stitch | SNLS | 3 | 189 | 3.15 | |
| Waist band corners finish | SNLS | 4 | 244 | 4.07 | |
| Loop preparation | BLM/fdr | 1 | 97 | 1.27 | |
| Loop attach | SNLS | 1 | 45 | 0.75 | |
| Bottom hemming | BHM | 1 | 123 | 2.05 | |
| Trimming | 1 | 35.7 | 0.59 | ||
| Quality inspection | 1 | 40.1 | 0.68 | ||
| Total | 54 | 1838.8 | 31.03 | ||
Table 2: Proposed operational breakdown and sam values.
According to Brian Harrington to find out numbers of work stations required:
Takt time = Available working Time/ Customer Demand
Availability working minutes per day = 480 minutes and customer demand =418
= 480minutes/418units
=1.148 minutes/unit product
=69 second
Each station should at least have a 69 second design cycle time to meet required demand. So that to know numbers of work station as follows
Number of Stations = Total task Cycle Time / Takt Time
Therefore total cycle time =1838.8 Sec and Takt time =69 seconds
Number of Stations =1838.8 /69 = 27 workstation
Production estimation
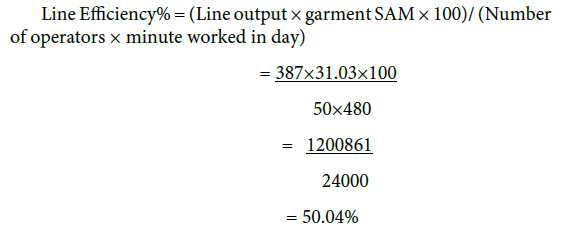
Estimation Daily production = Total man minutes available in a day/SAM × Average Line efficiency
So that, total number of operators=50, total minutes available =480 minutes/day, SAM =31.03 and according to Karuna Singh [9] line efficiency is 50% for calculated estimation production
Total available man-minutes =Total no. of operators × Working hours in a day×60
=50×480 minutes = 24000mintus
So Estimation Daily production = Total man minutes available in a day/SAM × Average Line efficiency
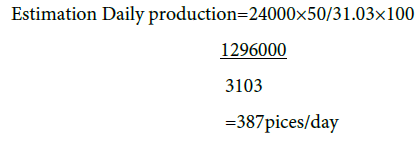
Where 31.03 SAM value from Table 2.
As comparing the existing scenario and proposed data based on rate, basic time, SAM value target and total capacity are analysis as follows. In existing scenario it gives 90% of rating but based upon operator experience, Fluid motions, coordination and wasted actions this data is more exaggerated so that proposed rating is 80% within the line. Average basic time for the existing scenario are not properly recording and the proposed average basic time is 1838.8 second by reducing un necessary movements of operator and batter working methods. Due to incorrect recording of basic time, tabulated and calculation problem and assign of allowance the existing scenario of SAM value is 23.33 but to properly calculated based on the data assign by the factory is 33.39 but the proposed line data SAM value are 31.03 finally based on the above data proposed line target output per day is 387 and per hour 48 and line efficiency are 50.04% (Table 3).
| Assigned No | Description of Operation | M/C Type | Existing M/C and Opr. |
Existing Line Output |
Existing Balance Efficiency |
Proposed M/C and Opr. |
Proposed Line Output |
Proposed Balance Efficiency Cy |
|---|---|---|---|---|---|---|---|---|
| D01 | Sew Inseam | 5th ol | 1 | 184 | 29.1% | 2 | 387pices/day | 50.04% |
| D02 | Top Stitch Side Seam | FOA | 1 | 184 | 29.1% | 2 | 387pices/day | 50.04% |
| D08 | Waist Band Attach To Main Body | SNLS | 2 | 184 | 29.1% | 6 | 387pices/day | 50.04% |
| D09 | Topstitch waist band corner | SNLS | 2 | 184 | 29.1% | 6 | 387pices/day | 50.04% |
Table 3: Highly bottleneck operation in the existing scenarios and balanced proposed line.
Bottleneck processes are a Delay in transmission that slow down the production rate. This can be overcome by balancing the line. From the above pitch diagram and line capacity graph we understand that workers having lower capacity level are doing their jobs at operation such as Sew Inseam, Top Stitch Side Seam, Waist Band Attach To Main Body and Topstitch waist band corner are take more time that cross upper control Limit (UCL) and it is approximately 87.74seconds. They require more processing time for which cannot pass required amount of product to the next operator or next operation. These positions are creating bottlenecks on the other side not any operators were doing the jobs more promptly than the requirement. So this indicates the line was imbalance. Work load is excess that was distributed among the higher capacity possessing workers considering the layout. Thus the bottlenecks were solved and maximum capacity was utilized and most importantly productivity was improved. Finally minimize thus bottleneck process and increasing line productivity and total line efficiency enhancing up to 50.04% proposed line Operational procedure for selected style [10, 11].
Production Cost for five pocket trousers
In the daily production report, many companies include the actual garment production costs of the style. In this study, the production cost represents the sewing room cost and is taken to identify the cost of each situation. Therefore, all direct and indirect costs that are connected to garment sewing and managing sewing lines are considered in the calculated garment production cost. Based on telaje garment manufacturing and seals PLC production manager handles eight lines, monthly salary is 8500:00 birr considered as cost incurred per line per day by dividing the number of lines. To calculate machine deprecation average price of machine 16000ETB it gave 10 years deprecation for one day =16000birr/10year×12month×26 day =4.1birr, where 26 are working days in a month.
The rent of the house was 60,000birr/month. Rent of per day = 60000birr/26day=2307.69birr. For one line divided by the number of lines which is 288.46birr.
Expense per month 12,000 birr; for one day =12000birr/26day = 461.538birr; for one line 461.538/8 = 57.69birr. Actual garment production cost of five pocket trousers is sum of the cost incurred for direct and indirect cost (Table 4).
| No | Employee designation | Daily salary | Number of employees | Total daily salary in ETB |
|---|---|---|---|---|
| 1 | Manager | 461.53 | 1 | 461.53 |
| 2 | Designer | 326.92 | 2 | 653.92 |
| 3 | Production Manager | 326.92 | 1 | 326.92 |
| 4 | Line Supervisor | 276.92 | 1 | 276.92 |
| 5 | Maintenance | 84.65 | 2 | 169.3 |
| 6 | Quality Control | 84.65 | 1 | 84.65 |
| 7 | Recorder | 69.23 | 1 | 69.23 |
| 8 | Bundle Transporter | 69.23 | 2 | 138.46 |
| 9 | Operators | 69.23 | 44 | 3046.12 |
| 10 | Helper | 69.23 | 4 | 276.92 |
| 11 | Expense | 57.69 Birr | 57.69 | |
| 12 | Depreciation | 4.1 Birr | 44 machine | 184.4 |
| 13 | Rent | 288.69 Birr | .33 | 288.46 |
| Total | 6034.52Birr per day | |||
| Existing Line Daily Production Cost Per Picess | pcs daily output184 | Daily production cost = Total cost/day = 6034.52 daily output/pcs 184 32.796Birr/pcs |
6034.52 | |
| Proposed Line | Daily product=220.375pcs | Daily production cost = Totalcost/day = 6470.5 daily output/pcs 387 =16.72Birr/pcs |
6470.5 |
Table 4: Production cost of trouser excising line scenario 1 and 2.
From the Figure 4 we understand some performance measurement with regarding to line balancing focused on manpower, machine, output per 8 hour, working time per day and line balancing efficiency of selected line in the case of output per day the proposed line has shown positive performance from 184 output per day for the existing to 387pices/day output per day and also line efficiency increase from 29.1% to 50.04%. In order to minimize bottleneck area of the line increasing manpower by 6 operator and machine from 44 to 50 machine from the existing scenario.

Figure 4: Performance measurement.
Conclusion
The objective of this thesis was to improve the productivity of the manual single model assembly line. Line balancing concept was applied to a case study problem and four different assembly solutions were developed and compared, namely, (I) Increasing the level of resources in the bottleneck process, (II) avoiding non-value added activities by changing work method and layout, (III) merging operations having similar machines and (IV) combination of scenario II and III. Based on the analysis of each key performance indicator (KPIs), after measuring the results, the fourth scenario was suggested for implementation. This thesis work analysis the current situation relate to assembly line and developed the proposed line to improve the key performance parameters such as line efficiency, productivity, and production cost by reducing and eliminating the problem of existing scenario of the line based on this proposed scenario was improving the efficiency from 29.1% to 50.04%,productiveity from 184 pieces/day to 387 pieces/day and production cost was minimize from 32.796 cost per pieces( ET birr) to16.72 cost per pieces( ET birr). Therefore this thesis work improved assembly line in all aspects especially productivity and efficiency of the company.
Authors’ Contributions
Yohannes Admassu, researched the data, undertook data processing, contributed to data analysis, interpretation, and preparation of the manuscript. Contributed to the direction of the study, supervised data acquisition, reviewed, and revised the manuscript.
Acknowledgement
The authors wish to thank the Ethiopian Technical University, the manager of Teleja Garment in Dese, Ethiopia industrial group, for their cooperation during sample analysis and experimental activities.
Data Availability
Data will be provided upon request
Funding
No funding.
Conflict of Interest
There is no conflict of interest.
References
- Islam M M, Hossain M T, Jalil M A, Khalil E (2015) Line balancing for improving apparel production by operator skill matrix. Int Sci Technol Soc 3: 101-106.
- James C Chen (2014) Assembly Line Balancing Problem of Sewing Lines in Garment Industry. Proceedings of the 2014 International Conference on Industrial Engineering and Operations Management Bali, Indonesia.
- Rahman M M, Baset M A (2014) Investigating a Balanced Sewing Line for Basic & Long Pant Manufacturing: An Empirical Study on Apparel Industry of Bangladesh.
- Bahadır S K (2011) Assembly line balancing in garment production by simulation. Assembly line–theory and practice.
- Noor Ahmed Raaz, How to Calculate Standard Minute Value (SMV) in Garment Industry, Atish Dipankar University of Science & Technology October 19, 2015.
- Tyler D J (1991) Materials Management in Clothing Production. BSP Professional Books Press, London.
- Kumar N, Mahto D (2013) Assembly line balancing: a review of developments and trends in approach to industrial application. Glob J Res Eng: 13.
- Akter S, Hossain K R (2017) Analysis on the proper utilization of man and machine to improve the efficiency and a proper line balancing of a sewing line: A case study. Int J Sci Eng Res 8: 778-784.
- Singh K (2016) Implementing industrial engineering as a tool in the industry. NIFT.
- Chan K C, Hui P C, Yeung K W, Ng F S (1998) Handling the assembly line balancing problem in the clothing industry using a genetic algorithm. Int J Cloth Sci Technol 10: 21-37.
- Gebrehiwet T B, Odhuno A M (2017) Improving the Productivity of the Sewing Section through Line Balancing Techniques: A Case Study of Almeda Garment Factory. Int J Sci Basic Appl Res (IJSBAR) 36: 318-328.