Research Article, J Fashion Technol Textile Eng S Vol: 0 Issue: 4
Handfeel of Single Jersey Fabrics as Assessed by a New Physical Method
Abu-Rous M1*, Malengier B2, Liftinger E1 and Innerlohinger J1
1Lenzing Aktiengesellschaft, Werkstrasse 2, 4860 Lenzing, Austria
2Centre for Textile Science and Engineering, Department MaTCh, Ghent University, BE-9052 Gent, Belgium
*Corresponding Author : Abu-Rous M
Project Manager Fiber Science R&D, Lenzing Aktiengesellschaft, Werkstraße 2, 4860 Lenzing, Austria
Tel: +43 (0)664 8532318
E-mail: m.aburous@lenzing.com
Received: December 05, 2017 Accepted: February 20, 2018 Published: February 26, 2018
Citation: Abu-Rous M, Malengier B, Liftinger E, Innerlohinger J (2018) Handfeel of Single Jersey Fabrics as Assessed by a New Physical Method. J Fashion Technol Textile Eng S4:006. doi:10.4172/2329-9568.S4-006
Abstract
Hand feel of fabrics made of cotton, polyester and wood-based cellulose fibers lyocell, modal and viscose was assessed by Fabric Touch Tester (FTT), Tissue Softness Analyzer (TSA), ring pullthrough and PhabrOmeter® and compared with human handfeel ranking. Additionally, the effect of repeated washing and drying on fabric handfeel was investigated by TSA. TSA ranking of softness and smoothness corresponded to the rankings by other direct physical methods as well as with human handfeel. Fabrics made from wood-based cellulosic fibers especially modal types showed better handfeel results than cotton even after repeated washing cycles. A divergence between physical and human assessment was observed on polyester.
Keywords: Hand feel; Tissue softness analyzer; Fabric touch tester; Lyocell; Modal
Introduction
Assessing fabric handfeel by physical methods has been a lively topic in the last 50 years. The complexity of human feel and subjective judgment goes far beyond mechanical fabric properties. Physical methods are hence expected to cover only a partial aspect of handfeel. Correlation between hand evaluations and a set of physical measurements can be found when the comparison is limited to well-defined fabric constructions depending on the targeted fabric use. The typical physical approach to simulate human hand evaluation of textiles is usually based on applying a physical stress similar to a hand action such as squeezing, bending, shearing etc. on the fabric and to receive an equivalent physical response [1,2].
Since Kawabata measurement system, various attempts were made to simplify the method or to provide more handy approache. Methods such as ring pull-through, Handle-o-meter, PhabrOmeter®, drape coefficient, have been developed. The newly developed Fabric Touch Tester (FTT) by SDL Atlas provides a simultaneous measurement of roughness, bending, friction and thermal conductivity [3,4]. A completely new approach is the Tissue Softness Analyzer (TSA), developed by Emtec Electronic GmbH, Germany. The method is based on analyzing the acoustic signals generated by applying a friction on the fabric surface [5-7]. TSA was in use for quality control in the hygiene tissue sector [6,7] as well as in nonwoven and textile sectors [6,7]. Earlier handfeel assessments on heavy and light woven fabrics applying TSA and FTT in comparison with classical physical methods as well as with human handfeel assessment gave promising results validating both methods for woven fabric segments [8].
Different to weaves, knitted fabrics are characterized by enhanced flexibility and fabric volume, leading to a different handfeel perception and expectedly different fabric physical response.
Wood-based cellulosic fibers such as viscose (CV), modal (CMD) and lyocell (CLY) are commonly known to offer a softer fabric than cotton (CO) and linen [3,9].
In this work, the handfeel of comparable single jersey knitted fabrics made of cotton, polyester and wood-based cellulosic fibers, typical for inner wear, was evaluated. The rankings given by FTT, TSA and ring pull-through were compared with human handfeel evaluations. Additionally, the effect of repeated washing and drying on fabric handfeel was investigated by TSA.
Materials and Experimental
Single jersey fabrics of different fiber contents were knitted at Lenzing AG (Table 1).
| Fabric | Mass per unit area [g/m²] | Thickness [µm] |
|---|---|---|
| CMD | 107 | 562 |
| µCMD | 96 | 540 |
| CV | 104 | 610 |
| CLY | 110 | 614 |
| CO | 106 | 636 |
| CMD/CO | 111 | 594 |
| CLY/CO | 113 | 608 |
| PES | 108 | 500 |
Table 1: Single jersey fabrics based on Nm70/1 ring yarn.
MicroModal® (μCMD) is a fiber with a fine titer (0.9 dtex) developed by Lenzing and is well known for its conspicuously soft fabrics [4]. Lenzing®, TENCEL®, Lenzing Modal®, MicroModal® and Lenzing Viscose® are registered trademarks of Lenzing Aktiengesellschaft. Abbreviations of the generic fiber names are used here for practical reasons.
The following methods and instruments were employed to assess the fabric hand. If nothing else mentioned, all evaluations took place on the front side of fabric. The first 4 tests were performed at Lenzing AG. The fabrics were conditioned at 23°C and 50% RH.
Hand evaluations
These evaluations were performed at Lenzing. The selected fabrics, all white and similar in appearance, were ranked according to their softness by by a panel consisting of ten persons unaware of sample composition. The fabrics were evaluated on a scale of 1-8, where score 8 indicates a fabric with the best handfeel and score 1 indicates a fabric with the worst.
Ring pull-through
Round fabric samples of 20 cm diameter, are pulled through a metal ring with a diameter of 2 cm and the displacement/force diagram is measured. The value of maximal force measured (Fmax) is related to handfeel-relevant parameters such as bending rigidity, friction and compressibility.
PhabrOmeter®
These measurements on single jersey fabrics were performed at Lenzing customer service center, Hong Kong following AATCC Test Method 202. The samples were pushed through an opening and a displacement/force curve is measured. Besides the maximal needed force Fmax, the analysis of the resulting curves as given by El-Moghazy [2] attributes fabric properties such as softness, smoothness and drape to each segment of the displacement/force plot.
Tissue Softness Analyzer (TSA)
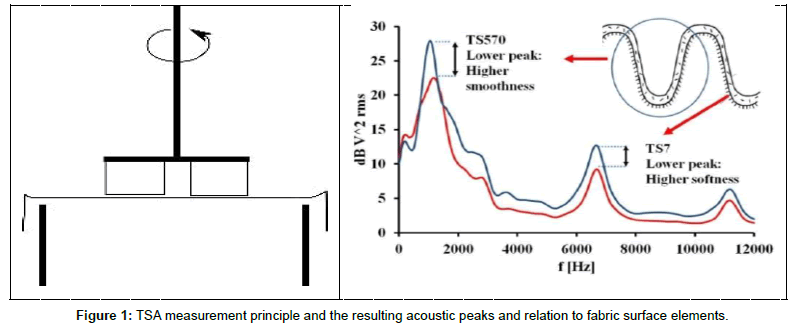
These measurements were performed at Lenzing using a device supplied by Emtec Electronic (Germany), as shown in Figure 1. The rotating part of the TSA generates noise while moving over the fabric surface, which is captured by a microphone and analyzed into its amplitude signals. In the resulting sonic spectrum, the signal peak (in dB V2 rms) at 750 Hz is a measure for the fabric vibration under the rotating part and should correlate with fabric smoothness, while the peak at 6500 Hz occurs through the vibration on the rotating part itself while moving above the fabric surface and is considered a measure for the softness of surface fibers. The lower the generated noise, the smoother resp. softer is the fabric (higher peak=higher roughness resp. smoothness). HF-value (Hand Feel) is calculated on the basis of the TSA measurements and the fabric weight and thickness. The used HF calculation algorithm is given in the device setting and it has been developed based on experience from the hygiene tissue sector. It was included into this work only for orientation.
Fabric Touch Tester (FTT)
These measurements were performed by the University of Ghent (UGent). The physical properties simultaneously measured by this device are bending, friction, roughness, compression and thermal conductivity [3,4]. Based on these values, primary handfeel indices such as smoothness and softness are calculated as well as two global hand indices (total hand and total feel). In this study, we only consider the bending work (BW) measured by FTT and the active softness and smoothness (mean values of 10 individual measurements).
Results and Discussion
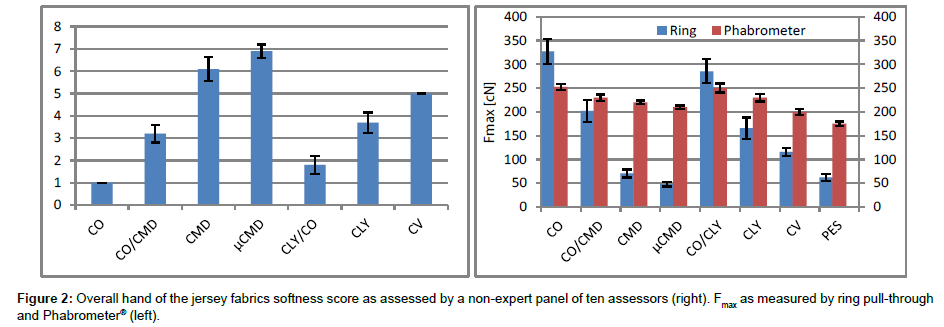
Figure 2 (left) shows the average values of the overall hand of single jersey fabrics as obtained with hand evaluations. Polyester fabrics were excluded from this comparison as they were distinguished by all test persons by its typical, unpleasant, synthetic touch which is independent of the fabric softness. The average hand ranking showed that μCMD received the best result, followed by the CMD and CV. They were followed by the CLY fiber, then by the cotton blends. Cotton fabric was found to be the least soft.
Fmax values resulting from Ring and Phabrometer® pull-through are shown in Figure 2 (right). Higher peaks indicate lower softness resp. smoothness. Phabrometer® appears less sensitive to the differences than the ring pull-through method due to the narrow opening of the ring which means more displacement resistance. Figure 3 shows softness, smoothness and drape numeric values as derived from the Phabrometer® curve plot. On the right side, relative hand values (RHV) in comparison to cotton, as calculated by Phabrometer® are shown. Within the cellulosic group, trends are similar to the hand evaluation. The polyester fabric received the highest RHV by the physical method, as it showed the lowest displacement resistance.
Measured (TS750 for smoothness, TS7 for softness) and calculated (HF) TSA results are summarized in Figure 4 left resp. right. The higher the TS peaks, the lower the smoothness resp. softness. Wood-based cellulosics provided lower peaks than cotton and the results of the CO/CLY and CO/CMD blends lay in between. HF values are calculated based on the TS values and the fabric weight and thickness. The higher HF, the better is the all-over hand feel. Although the HF calculation was originally optimized for hygiene tissues, the trends are, PES exempted, similar to the human hand feel ranking.
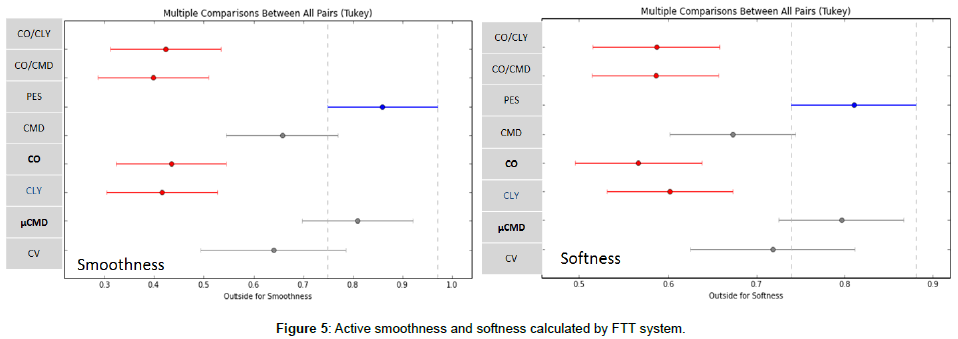
Figure 5 shows FTT results for softness and smoothness. An Anova analysis (alfa=0.05) was performed to identify significant differences between the fabrics. A post-hoc Tukey test showed a significant difference (p<0.05) between the smoothness of the μCMD fabrics and the cotton fabric, as shown by the non-overlapping bars of the chart left. PES and μCMD are the smoothest fabrics. Figure 5 right indicates the μCMD and PES as the softest, followed by CV and CMD. Wood-based cellulosics were by trend found softer than cotton. The μCMD fabrics showed by best hand among the cellulosic fabrics.
Generally, three groups can be distinguished: the softest group of fabrics belonging to the CV/CMD fiber technology with μCMD as the favorite, followed by fabrics based on CLY technology, then by cotton and its blends. A fabric ranking, though ignoring quantitative differences, as given by the different methods is shown in Table 2.
| Best | Worst | ||||||
|---|---|---|---|---|---|---|---|
| Average hand ranking | µCMD | CMD | CV | CLY | CMD/CO | CLY/CO | CO |
| RING pull-through | µcMD | CMD | CV | CLY | CMD/CO | CLY/CO | CO |
| Phabrometer® | |||||||
| Fmax | CV µCMD | CMD | CLY CMD/CO | CLY/CO CO | |||
| RHV | µCMD CV |
CMD CLY |
CMD/CO | CLY/CO | CO | ||
| Smoothness | µCMD CV |
CMD CLY |
CMD/CO CLY/CO | CO | |||
| Softness | CV µCMD |
CMD CLY |
CMD/CO | CLY/CO | CO | ||
| Drape | CV µCMD CMD |
CLY | CMD/CO | CLY/CO | CO | ||
| TSA | |||||||
| TS750 | µCMD | CMD | CV | CLY | CMD/CO | CLY/CO | CO |
| TS7 | µCMD | CMD CV |
CLY CMD/CO | CLY/CO CO |
|||
| HF | µCMD | CMD | CV CMD/CO |
CLY | CLY/CO CO | ||
| FTT | |||||||
| Softness | µCMD | CV | CMD | CLY | CMD/CO CLY/CO CO | ||
| Smoothness | µCMD | CMD CV | CMD/CO CLY/CO CLY CO | ||||
Table 2: A comparison of single jersey fabrics handle assessment by human panels and objective tests.
Conclusion
The handfeel advantage of man-made cellulosics in single jersey fabric construction could be assessed both by objective test methods and human evaluation. Especially the MicroModal® and modal fabrics showed excellent handfeel values. TSA technology can offer handfeel assessment of single jersey fabric which is comparable to other known physical methods. A wide agreement among the physical methods in the extreme ranges of fabric hand feel was observed. In the middle range, divergences among methods and among hand assessors were observed due to the similarity of fabrics. Physical forces play only a partial role in human handfeel perception. All-over handfeel values were influenced by single parameters. While human perception of “soft” and “smooth” is often intermingled, measurements of “smooth” based on surface friction can easily be misled by the fact that softer surfaces often have higher friction, but are still perceived as “smooth” by humans. Based on physical measurements, polyester fabric received best softness and smoothness values, while its typical synthetic touch was recognized by humans, who concurred in giving low rating. The non-absorbing synthetic fabric is felt as “warm”. Further works are necessary to assess the validity of the TSA method for further textile constructions, the effect of surface treatments on handfeel of textiles, and to optimize the algorithm of the calculated hand feel (HF) value. Comparison measurements by other methods and referring to a reliable human panel are mandatory for this assessment. The inclusion of the thermal aspect (warm/cool feeling) is also of high importance and could not be covered by this study due to the lack of reliable technology.
References
- Basset RJ, Postle R Pan N (1999) Experimental methods for measuring fabric mechanical properties: A review and analysis. Textile Res J 69: 866.
- El Mogahzy YE, Kilinc FS, Hassan M (2005) Effect of mechanical and physical properties on fabric hand. Woodhead Publishing Limited, Cambridge, UK.
- Hu J, Hes L, Li Y, Yeung KW, Yao BG (2006) Fabric touch tester: Integrated evaluation of thermal-mechanical sensory properties of polymeric materials. Polymer Testing 25: 1081-1090.
- Liao X, Li Y, Hu J, Wu X, Li Q, et al. (2014) A simultaneous measurement method to characterize touch properties of textile materials. Fiber Polym 15: 1548-1559.
- Grüner G, Grüner A (2011) Method and device for determining the softness of sanitary papers and textiles. US Patent US8082791-B2.
- Clay KC, Pawlowska L, Huang X (2016) Utilising KemView™ sheet analyser to optimise softness and control the creping process. Tissue World Magazine.
- Grüner A (2016) TSA–Tissue/nonwovens softness analyzer–a new and objective method to measure the softness of nonwovens and textiles. Proceedings of Man-Made Fiber Congress, Dornbirn, Austria.
- Abu-Rous M, Liftinger E, Innerlohinger J, Malengier B, Vasile S, et al. (2017) A new physical method to assess handle properties of fabrics made from wood-based fibers. IOP Conference Series: Materials Science and Engineering.
- Haudek HV, Vitti E (1980) Textilfasern. Melliand Textilberichte KG, Heidelberg, Germany.
 Spanish
  Chinese
  Russian
  German
  French
  Japanese
  Portuguese
  Hindi
Hindi 