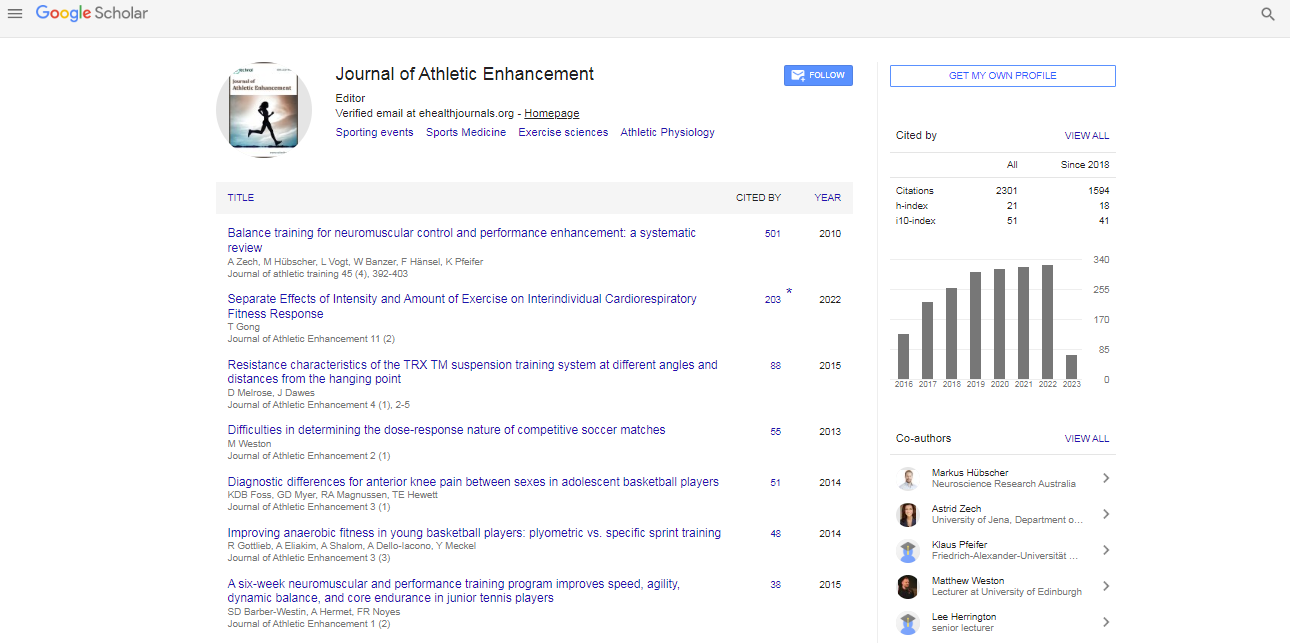
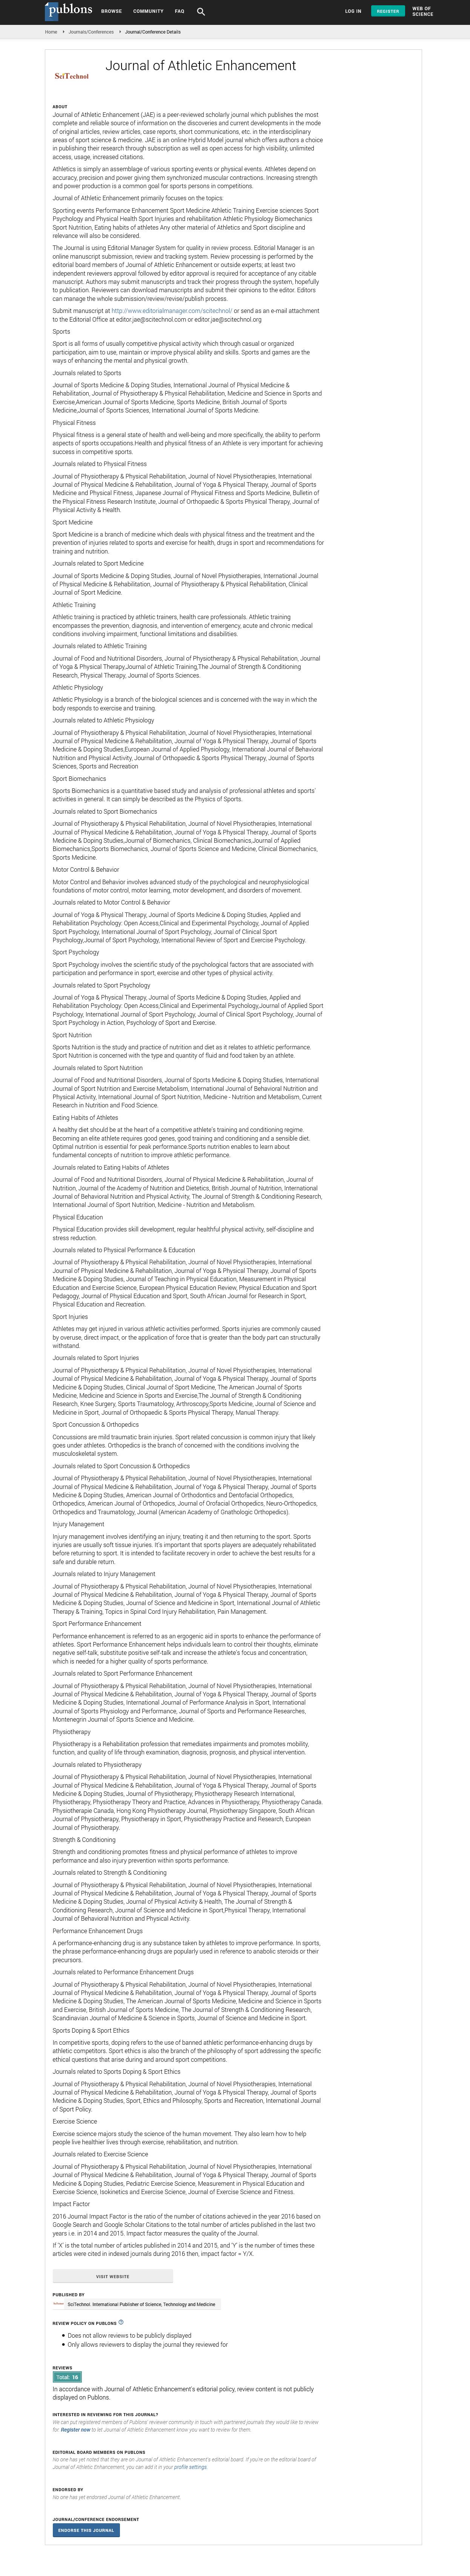
Spanish
  Chinese
  Russian
  German
  French
  Japanese
  Portuguese
  Hindi
Hindi Research Article, J Athl Enhanc Vol: 6 Issue: 4
Is AGT The New Gene For Muscle Performance? An Analysis of AGT, ACTN3, PPARA and IGF2 on Athletic Performance, Muscle Size and Body Fat Percentage in Caucasian Resistance Training Males
Lucy Ellis, Christopher Collins*, James Brown and Wes Pooley
Muhdo Health Ltd, UK
*Corresponding Author : Christopher Collins
Muhdo Health Ltd, QMU and Edge Hill University, UK
Tel: 07876592310
E-mail: chris.collins@muhdo.com
Received: May 14, 2017 Accepted: May 30, 2017 Published: June 05, 2017
Citation: Ellis L, Collins C, Brown L, Pooley W (2017) Is AGT The New Gene For Muscle Performance? An Analysis of AGT, ACTN3, PPARA and IGF2 on Athletic Performance, Muscle Size and Body Fat Percentage in Caucasian Resistance Training Males. J Athl Enhanc 6:4. doi: 10.4172/2324-9080.1000266
Abstract
Genetics has long been the field of athletic performance that has been forsaken, however with new advancements in testing ability and availability, certain genes have come to the forefront of physical ability, genes such as ACE and ACTN3 are known colloquially as the FIT genes. This analysis looked into 211 resistance training male Caucasians, the genes and SNPs that were analysed were AGT (rs699), ACTN3 (rs1815739), PPARA (rs4253778) and IGF2 (rs680). Certain gene alleles appear to be interlinked in this group, with certain variants being in higher numbers in this athlete group going against studies on mass population groups. The study suggests that when a favourable genetic profile is combined with correct training it can have an advantageous effect on the individual. However, these results are speculative until a larger group can be analysed, yet, this provides a very good window of opportunity for further analysis into these elusive FIT genes. The gene AGT (rs699) C allele appears to show a good correlation to power performance activity, possibly by increasing the activity of angiotensin II (a skeletal muscle growth factor), however there is a possible link with AGT, fat mass and power to weight ratio. The C allele in rs181739 and G allele in rs680 appear to positively influence back muscle strength performance, although the G allele in rs4253778 appears to have a negative influence upon muscle performance.
Keywords: Genetics; AGT; Athletic Performance; Resistance Training
Introduction
Athletic performance has largely been attributed to the intensity and frequency of training and type of coaching from a young age. The ability for an individual to have correct muscular force velocity for power performance, or on the contrary, increased oxygenation of muscles for an endurance performance is crucial for the athlete to be a master in their field. These attributes are strongly influenced by our genetics, and if an individual doesn’t have this genetic make-up it can reduce their chances of becoming an elite level athlete.
Now the heritability of traits is considered an important genetic factor to ability. It is thought that up to 66% of athletic status is heritable, including our body composition types, (mesomorph, ectomorph or endomorph somatotype) which are now thought to be influenced by not just 1st generation but 2nd generation; such as grandparents [1]. Our genetic heritage can estimate for strength, power, training response, VO2 max, endurance capabilities and even the percentage of fast twitch: slow twitch muscle fibres. Genetic variation testing can be beneficial in protecting athletes from injury and also to identify talent, discovering advanced methods for training and diet via reduced trial and error.
There are many specific genes and polymorphisms within these genes that are associated with performance, and these have been identified and deemed “FIT” genes. Since 2009, more than 200 genetic variants have been found to be associated with physical performance and some of those are deemed to be elite status [2]. These genes are identified to give some individual advanced traits, assuming they follow correct nutrition and training plans. So long as the individual has a specific genotype of the gene, they may be at an advantage or a disadvantage when it comes to fellow athletes. These genes do not have adequate reproducibility in studies, however there have been notable exceptions. A-actinin-3 (ACTN3); angiotensinogen (AGT); Insulin-like-growth factor 2 (IGF2); peroxisome proliferatoractivated receptor alpha (PPARA).
Individually these polymorphisms may not account for a substantial increase in athletic genetic ability, but cumulatively the candidate genes may have an effect on athletic performance.
The genes that were analysed in this test study were the following:
AGT
This gene provides instructions for making the protein angiotensin; angiotensin is a peptide hormone that causes vasoconstriction and a subsequent increase in blood pressure. AGT have been implicated in risk for hypertension and related disorders, such as heart disease and pre-eclampsia. Certain gene variants will indicate increased production of angiotensinogen, which can result in increased vasoconstriction and high blood pressure.
AGT SNP RS699
The protein encoded by this gene, pre- angiotensinogen or angiotensinogen precursor, is expressed in the liver and is cleaved by the enzyme renin in response to lowered blood pressure. The AGT gene is part of the renin- angiotensin system, which plays essential roles in regulating blood pressure, body salt, and fluid balance. There are several possible ways in which the CC genotype might predispose people to improved power and strength capacity—including increased production of angiotensin II, which is crucial for muscle performance [3].
PPARA
Peroxisome proliferator-activated receptor alpha (PPAR-alpha), PPAR-alpha is a transcription factor and a major regulator of lipid metabolism in the liver. PPAR-alpha is activated under conditions of energy deprivation and is necessary for the process of a key adaptive response to prolonged fasting.
PPARA SNP RS4253778
Studies show C allele has an advantage for power - oriented athletes, presumably due to the hypertrophic effects on skeletal muscle and increase in glucose utilization in response to anaerobic exercise [4].
ACTN3
ACTN3 is probably the most well-known gene, as has been nicknamed the “Sprinters” gene. Ability The gene instructs the body to produce a specific muscle protein called alpha-actinin-3 which has been shown to contribute to a muscles ability to generate forceful, repetitive, muscle contractions.
ACTN3 SNP RS1815739
This gene encodes a member of the alpha-actin binding protein gene family. The encoded protein is primarily expressed in skeletal muscle and functions as a structural component of sarcomeric Z line. CC [RR] genotype associated with increased strength (OR=2.31; p=0.0001) [5].
IGF2
Insulin-like growth factor 2 (IGF-2) is one of three protein hormones that share structural similarity to insulin. The major role of IGF-2 is as a growth-promoting hormone during gestation.
IGF2 SNP RS680
IGF-II gene region polymorphisms related to muscle damage, muscle damage can lead to higher adaptive changes which may relate to greater muscle mass post stimuli. If this is true it may explain why some athletes require more rest BUT end up with similar sized or larger overall muscle mass when compared with peers [6].
The following paper outlines these four candidate genes and associated known polymorphisms with sport and exercise. Further, these polymorphisms will be assessed to outline their influence on athletic performance and anthropometric measurements.
Methods
Subjects
The subject group for this study was 211 male Caucasians, all have competed in at least one bodybuilding or physique competition and have between 4-5 years’ experience in resistance training. They had an age range of 23-26years, each having not competed in any other sports at a semi or professional level.
Genetic testing
The subjects completed a genetic test utilising a buccal swab (Isohelix SK-1S), no food or drink was consumed for at least 2 hours before the test. The samples were collected between 48 hours of each other, the samples were analysed via PCR in an ISO17025 lab. 191 gene variants were analysed which included the required, rs699, rs680, rs4253778 and rs1815739.
Physical Testing
Physical tests were carried out across three gym sites in the United Kingdom at the same time as the genetic testing collection, the tests that were carried out were:
a. Biceps (arm) Circumference - Flexed at highest peak (CM)
b. Maximal Pull-Ups (Pronated Grip) STRICT
c. Weight of Subject (KG)
d. BF% - Tanita BC545N
Results were anonymised and kept encrypted and securely.
Statistics
Data was analysed using IBM SPSS. Genotypes were grouped into their respective homozygous or heterozygous groups and Hardy Weinberg equation used to check equilibrium. A comparison of the mean for the groups was performed using the One-Way Analysis of Variance (ANOVA) with post hoc tests. Significance was accepted at a p value of less than 0.05.
Results
Table 1 Average values for each gene and associated genotype with standard deviation for each of the anthropometric values that were assessed during the study.
| IGF2 | ACTN3 | AGT | PPARA | |||||||||
|---|---|---|---|---|---|---|---|---|---|---|---|---|
| AA (n=95) | AG (n=39) | GG (n = 77) | CC (n= 74) | CT (n=75) | TT (n=62) | CC (n=99) | CT (n=35) | TT (n=77) | CC (n=42) | CG (n=99) | GG (n=70) | |
| Bicep Circumference (cm) | 38.54 ± 2.42 | 36.83 ± 1.93 | 40.26 ± 1.76 | 36.71 ± 2.64 | 37.60 ± 2.73 | 41.56 ± 1.96 | 38.17 ± 2.47 | 42.20 ± 3.04 | 40.39 ± 1.57 | 43.21 ± 2.46 | 42.23 ± 2.99 | 40.47 ± 1.63 |
| Pull up Max | 18.00 ± 4.05 | 14.00 ± 3.90 | 13.00 ± 1.70 | 18. ± 3.97 | 14.00 ± 5.43 | 14.00 ± 1.85 | 18.00 ± 4.4 | 16.00 ± 3.61 | 13.00 ± 1.83 | 22.00 ± 3.49 | 17.00 ± 5.99 | 13.00 ± 1.69 |
| Body weight (kg) | 74.44 ± 6.05 | 74.26 ± 5.25 | 80.88 ± 4.95 | 72.98 ± 6.24 | 74.60 ± 6.66 | 82.66 ± 5.36 | 75.89 ± 5.98 | 85.33 ± 5.32 | 78.02 ± 4.76 | 96.79 ± 6.17 | 84.37 ± 5.45 | 76.87 ± 4.78 |
| Body fat (%) | 11.715 ± 1.36 | 11.895 ± 1.94 | 13.28 ± 1.50 | 11.31 ±1.45 | 12.20 ± 1.55 | 13.33 ± 1.59 | 11.65 ± 1.35 | 13.51 ± 1.83 | 13.46 ± 1.59 | 13.57 ± 1.34 | 13.46 ± 1.58 | 13.61 ± 1.57 |
Table 1: Average values for each gene and associated genotype with standard deviation for each of the anthropometric values that were assessed during the study.
Table 2 is outlining the number of alleles represented in the 211 samples and the percentage frequency of the genotype population.
| Gene | Polymorphism | Number of Alleles | % of population |
|---|---|---|---|
| AGT | CC | 99 | 46.91 |
| CT | 35 | 16.58 | |
| TT | 77 | 36.49 | |
| PPARA | CC | 42 | 19.90 |
| CG | 99 | 46.91 | |
| GG | 70 | 33.17 | |
| ACTN3 | CC | 74 | 35.07 |
| CT | 75 | 35.55 | |
| TT | 62 | 29.38 | |
| IGF2 | AA | 95 | 45.02 |
| AG | 39 | 18.48 | |
| GG | 77 | 36.49 |
Table 2: Table outlining the number of alleles represented in the 211 samples and the percentage frequency of the genotype population.
PPARA rs4253778
The frequency of the genotypes within the PPARA gene varied significantly between the heterozygous CG and the homozygous dominant CC (46.92% to 19.91%) with the GG homozygous allele being 33.18%. A linear trend was found between bicep circumference and maximum pull ups. Those with the CC genotype had the largest bicep circumference and achieved the most pull ups compared to CG and GG (43.21cm biceps to 22 pull ups, 42.23cm biceps to 17 pull ups, and 40.47cm biceps to 13 pull ups for CC, CG and GG respectively). The GG genotype however had significantly greater body fat % compared to CG but not to CC, and no significant difference in body weight compared to the other two genotypes (t (198)=1.87, p<0.00; t (187)=2.45, p>0.05); body weight P>0.05). Individuals who expressed the GG genotype had on average significantly smallest biceps and lowest pull up scores when compared to the CC genotype (t (138)=1.97, p<0.00; t (82)=2.654, p<0.00). When the data is adjusted for maximum pull ups, GG genotypes achieved the lowest value for pull ups suggesting that their muscular strength was low.
ACTN3 rs1815739
The frequency of the alleles within the ACTN3 gene showed the CC gene to be non-significantly more frequent than the other two variables (t (105)=2.05, p>0.05). Individuals with the CC genotype had average values for bicep circumference, maximum pull ups, body weight and body fat % of 36.71cm, 18, 72.98kg, 11.31% respectively. Compared to the TT values, TT individuals had larger bicep circumferences (41.56cm), less pull ups (14), greater body weight (82.96kg) and a greater body fat % (13.33%). Though these results were not significant (P>0.05), there are clear differences between the values associated with bicep circumference and maximum pull ups, (Table 1). This is in line with previous data as discussed below.
AGT rs699
Current findings found the CC allele of the population in this study to be 46% compared to 36% of the TT variation (Table 2). This concurs with previous data studies.
The dominant CC genotype showed a significant difference between body fat % and maximum pull ups when compared to the TT genotype (t (98)=1.67, p<0.05). The CC individuals on average achieved 17 pull ups compared to 13 pull ups of the TT genotype. CC individuals in this study had lower body fat % which could have contributed to their ability to perform more pull ups, these individuals also had to lowest body fat which may explain why they were able to do more pull ups, however, when adjusting for the size of biceps (CC= 38cm, TT=40cm), the CC genotype individuals have a better strength ratio than the TT variables.
IGF2 RS680
The frequency of the homozygous AA alleles in the population was 45.02%, for heterozygous AG was 18.48% and for GG alleles was 36.49%.
The AA genotype showed the greatest average pull up value (19 when rounded up), and the lowest body fat % (11%) compared to the other genotypes. On the contrary, the “strength” associated genotype of GG whilst they had the largest bicep circumference, the ratio of size: max pull up was 1:0.9 suggesting a low association between the two values. The IGF2 GG genotype had the highest body fat % (13.33%) compared with the other genotypes which would provide an explanation as to why their pull up values were much lower (13 vs 18 for AA) as potentially there was too much body weight to lift. This body fat % and large bicep circumference however is normally attributed to power output performances such as power lifting or even strong man events.
Significant differences were found between the AA and GG genotypes for both body weight (t (169)=1.97, p<0.05) and the body fat % (t (169)=1.24, p<0.05) (Graphs 1-4).

Graph 1:

Graph 2:

Graph 3:

Graph 4:
Discussion
Athletic performance is influenced by genetics and already to date there are many genes that are associated with performance. There are numerous systems that interact together which is why athletic performance is considered one of the most complex human qualities. Differences in height and body composition, gender and other body morphologies means that individuals are naturally more suited to different sports or competitions. It takes numerous years to develop an athlete into a specific sport, yet if they are not genetically gifted in that sport they may not become elite. Genetic testing is paving the way forward to identify individuals with those elite genes in order to point them in the right direction of sporting performance.
(PPARA) rs4253778 Polymorphism in Endurance
The PPARA gene (which encodes for the nuclear receptor protein peroxisome proliferator activated receptor alpha) is a very good candidate in athletic ability due to its roles in glucose homeostasis and lipid metabolism. During endurance sports, it is known to be regulated during metabolic and physiological stress, altering fatty acid oxidation mitochondrial pathways therefore becoming an important part in immune responses [7].
The rs4253778 polymorphism is located on intron 7 of the gene. The G allele has been linked to an increased fatty acid oxidation and an increased number of type I slow twitch muscle fibres, as commonly attributed to endurance athletes due to their ability to use oxygen more efficiently. Individuals with the GG genotype of this genotype have a greater oxygen value compared to those with the C allele, therefore this allele has promise to be an important genetic candidate for endurance. This genotype has been demonstrated to have a high frequency in elite long distance athletes such as rowers, combat athletes and Russian endurance athletes when compared to control groups or sprinters who had CC genes [8,9].
However, the C allele of this genotype has been associated with increased lipid levels and an increased risk of coronary artery disease. The CC allele not only is linked to coronary artery disease but also to type II diabetes mellitus, largely due to the increased plasma lipid levels [10,11].
The current study found similar results to previous papers suggesting decreased strength and more endurance with the GG allele. The endurance attributes of this genotype can explain the results of this study as these individuals on average had the smallest biceps. This data suggests these individuals had more type 1 slow twitch muscle fibres which are smaller and less dense in size.
AGT rs699
AGT is a potent vasoactive peptide produced by proteolysis of the AGT prohormone and plays a critical role in cardiovascular homeostasis through the renin-angiotensin system. It plays an essential role in regulating blood pressure and blood supply, electrolyte balance and fluid balance. The rs699 polymorphism has been found to predispose individuals to improved strength and power through increasing angiotensin II which is crucial in muscular performance. Studies of this polymorphism have found the CC genotype to be 3.1 times higher in power athletes than in endurance athletes.
The C allele of the rs699 polymorphism (location 1q42.2) encodes for the threonine variant, has been associated with a 1.5x increased risk of hypertension due to increases in blood pressure. Those who are homozygous for the C allele have a 2x increased risk of hypertension. Individuals who display this C variant often have increased levels of strength, and studies have shown a correlation between strength training and high blood pressure [12].
Carriers of one or two of the C alleles have a greater response to specific strength and power training compared to endurance exercises. Studies have shown their training is better suited around low repetition work, or an increased load. Data from this study has supported previous work, showing that the C allele carries had a greater strength to muscular size ratio [8]. From this it can be concluded that the individuals may have smaller type II glycolytic fibres, however the strength: size ratio from these variables gives rise to a large proportion of strength comparative to size.
Those who were TT had the largest body fat % and the largest bicep circumference, and it may be considered that their size of bicep can be partially down to an increased fat mass around the bicep.
This data suggests that the C allele of the AGT rs699 could potentially increase the activity of angiotensin II (a skeletal muscle growth factor) and therefore this polymorphism could favour power performances. This corresponds to previous research.
rs1815739 results (ACTN3)
The genetic profile in endurance performance is very different to that of a sprint or power athlete. The endurance athlete must have sustained muscular contractions, and therefore will have a high VO2 max, lactate threshold and generally a very low body fat [13]. All of these things are influenced by hereditary of genes. On the other hand, power athletes require forceful and high speed muscular contractions, which utilise anaerobic pathways and muscular stores of creatine phosphate, adenosine triphosphate and glucose. Power athletes will also generally have a larger proportion of type II glycolytic fibres than endurance athletes.
This is where the a-actinin family of actin binding proteins is important. The ACTN3 gene is solely expressed and specialised in fast glycolytic, myosin heavy type II fibres which produce forceful contractions upon stimulation of the muscle. The ACTN3 gene is the only genotype that has consistently shown a positive association with performance in power athletes, and this data is also supported by mechanistic data from knockout mouse models. The C allele and CC genotype is largely represented in elite power athletes, whilst the TT genotype is more associated with lower strength and lower proportion of type II fibres. Power output plays a critical role in sprint and strength based activities. The ratio of the CC genotype body weight to maximum pull ups was 1.0:0.54 suggesting a strong association with strength.
This gene however is extremely population dependent. The favourable CC allele for power performance has a greater frequency in individuals of a Jamaican or American descent compared to individuals from Eastern or West African backgrounds. This can also explain the prevalence of elite sprint athletes in the Olympics who are of this origin, specifically where Jamaicans currently dominate the sport both in the male and female sprints [14]. The odd of having the CC genotype is 3.7 times larger in world class athletes compared to lower level (such as county or state) athletes. The current study shares these results with lower level athletes, as the frequency of all three genotypes was largely the same (6% difference from CC to TT; seen in Table 1). This suggests that the hereditary difference expressed through the ACTN3 protein occurs during maximal output at high level performances, and athletes who participate in lower level competitions may not yet have reached that potential.
This SNP has also been associated with varying responses to muscle damaging exercise, depending on the type of exercise. Power type training involves a higher demand of stretch-shortening related movements and therefore the muscles are damaged more with the intention to gain size. The CC allele further adds to the damage response, reducing the long-term damaging effects of exercise and essentially, increasing recovery rate
IGF2 rs680
Previous studies on elite and national level judo athletes showed a higher frequency of GG and AG alleles in their study. Back muscle strength relative to height and weight was higher in subjects with the GG+GA genotype than in those with the AA genotype [15]. The same study found that the GG genotype for IGF2 as associated with back muscle strength and not handgrip strength. This may explain why the GG genotype from the current population didn’t achieve very good pull up results as expected as perhaps it was grip, rather than strength that was lacking. Or the fact that they were just heavy and carried the most body fat.
It may also be that strength attributes from this genotype are not fully seen unless the athlete is of an elite level. Participants in this study were not fully elite athletes; therefore their genetic potential may not have been fully reached.
A recent study has shown the IGF2 SNP to have strength loss immediately after muscle damaging exercise [16]. This study found no initial association between the AA genotype and strength, however after maximal eccentric exercise there was significant reduction in strength. These people also had increased levels of CK up to 7 days post exercise, which suggested that the AA genotype individuals increased activation of satellite cells and proliferation assisting skeletal muscle repair. This increased muscular damage could lead to a more efficient repair process and therefore increased hypertrophy.
Until there is a clear relationship between the IGF2 polymorphism and strength in young and older generations of athletes, the conclusions here are speculative.
Limitations
1. Recruitment of elite and highly elite individuals is rare – most genes for athletic performance can only find statistical significance in elite compared to normal.
2. Sample size is known to be affected by allele frequency, degree of linkage disequilibrium (measure of association between alleles at different loci), inheritance models (additive vs dominant) and effect size – odds ratio of all variants. Potentially need more than 250 cases to achieve 80% power.
3. Genes affected by environment and difficult to get people from all backgrounds together, so it would need a multisite collaboration and potentially share the study amongst countries.
4. Subject height was not taken into consideration; biceps circumference would be affected on lever length.
Conclusion
Outcome
ACTN3: C allele showed greater muscle performance however individuals appeared to have lower BF% and therefore a more favourable power to weight ratio.
IGF2: conclusions are speculative as data from this study and previous studies contradict each other. Here we found that the GG allele had the lowest strength as determined by pull ups; however the GG allele has been associated with strength, so uses different muscle fibres.
AGT: This data suggests that the C allele of the AGT rs699 could potentially increase the activity of angiotensin II (a skeletal muscle growth factor) and therefore this polymorphism could favour power performances. The CC genotype showed a far better pull-up max achievement when compared to the TT genotype counterparts.
PPARA – G allele associated with endurance due to more oxygenation for slow twitch muscle fibres. C allele has been linked to coronary artery disease but the homozygous version is not popular.
There is plenty of data associating PPARA and ACTN3 on endurance or power output alike; however there are limited studies on the IGF2 and AGT polymorphisms. More studies using larger sample sizes should focus on these two genes. Long term follow up studies should focus on these genes to see if specific training methods prove advantageous.
The evidence suggests that when a favourable genetic profile is combined with correct training, it can have an advantageous effect on the individual.
References
- Peeters MW, Thomis MA, Loos RJ, Derom CA, Fagard R, et al. (2007) Heritability of somatotype components: a multivariate analysis. Int J Obesity Related Metabolic Disorders 31: 1295-1301
- Bray MS, Hagberg JM, Pérusse L, Rankinen T, Roth SM, et al. (2009) The human gene map for performance and health-related fitness phenotypes: the 2006-2007 update. Med Sci Sports Exerc, 41: 35-73
- Gomez-Gallego F, Santiago C, González-Freire M, Yvert T, Muniesa CA, et al. (2009) The C allele of the AGT Met235Thr polymorphism is associated with power sports performance. Appl Physiol Nutr Metab 34: 1108-1111
- Ahmetov II, Fedotovskaya ON2 (2015) Current Progress in Sports Genomics. Adv Clin Chem 70: 247-314
- Eynon N, Hanson ED, Lucia A, Houweling PJ, Garton F (2013) Genes for elite power and sprint performance: ACTN3 leads the way. Sports Med 43: 803-817
- Devaney JM, Hoffman EP, Gordish-Dressman H, Kearns A, Zambraski E, et al. (2007) IGF-II gene region polymorphisms related to exertional muscle damage. J Appl Physiol 102: 1815-1823
- Lopez-Leon S, Tuvblad C, Forero DA (2016) Sports genetics: the PPARA gene and athletes’ high ability in endurance sports. A systematic review and meta-analysis. Biol Sport 33: 3-6
- Ahmetov II, Mozhayskaya IA, Flavell DM, Astratenkova IV, Komkova AI, et al. (2006) PPARalpha gene variation and physical performance in Russian athletes. Eur J Appl Physiol 97: 103-108
- Ahmetov II, Egorova ES, Gabdrakhmanova LJ, Fedotovskaya ON (2016) Genes and Athletic Performance: An Update. Med Sport Sci 61: 41-54
- Andrulionyte L, Kuulasmaa T, Chiasson JL, Laakso MSTOP-NIDDM Study Group (2007) Single nucleotide polymorphisms of the peroxisome proliferator-activated receptor-alpha gene (PPARA) influence the conversion from impaired glucose tolerance to type 2 diabetes: the STOP-NIDDM trial. Diabetes 55: 1181-1186
- Enquobahrie DA, Smith NL, Bis JC, Carty CL, Rice KM (2008) Cholesterol ester transfer protein, interleukin-8, peroxisome proliferator activator receptor alpha, and Toll-like receptor 4 genetic variations and risk of incident nonfatal myocardial infarction and ischemic stroke. AM J Cardiology, 101: 1683-1688
- Nakajima T, Jorde LB, Ishigami T, Umemura S, Emi M (2003) Nucleotide diversity and haplotype structure of the human angiotensinogen gene in two populations. Am J hum Genet 70: 108-123
- Ruiz JR, Gómez-Gallego F, Santiago C, González-Freire M, Verde Z, et al. (2009) Is there an optimum endurance polygenic proï¬Âle? J Physiol 587: 1527-1534.
- Yang N, MacArthur DG, Wolde B, Onywera VO, Boit MK, et al. (2007) The ACTN3 R577Xpolymorphism in East and West African athletes. Med SciSports Exerc, 39: 1985-1988
- Itaka T, Agemizu K, Aruga S, Machida S (2016) G Allele of the IGF2 ApaI Polymorphism Is Associated With Judo Status. J Strength Cond Res 30: 2043-2048
- Devaney JM, Hoffman EP, Gordish-Dressman H, Kearns A, Zambraski E, et al. (2007) IGF-II gene region polymorphisms related to exertional muscle damage. J Appl Physiol 102: 1815-1823