Spanish
  Chinese
  Russian
  German
  French
  Japanese
  Portuguese
  Hindi
Hindi Research Article, J Athl Enhanc Vol: 12 Issue: 3
Luck Clustering in Sports: Applications and Implications for Performance and Strategy
Farshi Esmaeil*
1Department of Electrical Engineering, University of Tennessee, Knoxville, USA
*Corresponding Author: Esmaeil Farshi
Department of Electrical
Engineering, University of Tennessee, Knoxville, USA
E-mail: farshi@technologist.com
Received date: 04 May, 2023, Manuscript No. JAE-23-97797;
Editor assigned date: 08 May, 2023, PreQC No. JAE-23-97797 (PQ);
Reviewed date: 22 May, 2023, QC No. JAE-23-97797;
Revised date: 29 May, 2023, Manuscript No. JAE-23-97797 (R);
Published date: 05 June, 2023, DOI: 10.4172/2324-9080.100071
Citation: Farshi Esmaeil (2023) L uck Clustering in Sp orts: Its Ap p lications and Imp lications f or Perf ormance and Strategy. J Athl Enhanc 12:3
Abstract
The notion of luck clustering has gained traction in recent years due to its potential influence on performance and decision- making across a range of domains. This study concentrates on the application of luck clustering in sports, with an emphasis on its consequences for performance metrics and strategic decision- making. We employ time series analysis to investigate the presence of luck clustering in sports data, such as win-loss records, scoring, and player rankings, while considering the role of the Principle of Luck Conservation in the observed clustering patterns. Our findings provide evidence of luck clustering in sports, implying that periods of high luck tend to be followed by more high luck events, and vice versa for low luck events. These insights carry significant implications for coaches, players, and teams, who can utilize the understanding of luck clustering to develop more effective strategies, manage resources efficiently, and ultimately enhance their performance. By enriching our comprehension of luck’s nature and its effects on sports outcomes, this study contributes valuable knowledge for practitioners and researchers in sports analytics and performance management.
Keywords: Sport performance metrics; Decision making by coaches; Sport analysis; Predicting game outcomes; Statistical methods; Games strategy
Introduction
Background on the principle of luck conservation
Luck is a fascinating and elusive concept that plays a significant role in various aspects of human life, including sports, financial markets, and gaming [1]. The principle of luck conservation posits that, on average, luck tends to balance out over time, with periods of high luck often counterbalanced by periods of low luck [2]. Despite this conservation of luck, it is not uncommon to observe clusters of high or low luck events occurring in certain situations or time periods [3]. Understanding this phenomenon has broad implications for analyzing the role of luck in shaping outcomes and informing decision-making across different contexts [4].
The concept of luck clustering
Building upon the principle of luck conservation, the concept of luck clustering delves deeper into the temporal patterns exhibited by luck, asserting that clusters of high or low luck events can emerge in various domains [5]. Investigating these clustering patterns can offer valuable insights into the dynamics of luck and its influence on decision-making, strategy, and outcomes across a wide range of disciplines (Figures 1 and 2) [6].

Figure 1: Clustering of luck in random walks, displays the trajectories of 1,000 random walks, each consisting of 100 steps. The positive and negative steps represent instances of good and bad luck, respectively. The clustering of luck is demonstrated by observing the streaks of wither positive or negative steps within each random walk, highlighting the natural occurrence of lucky an unlucky sequences in random process.

Figure 2: Luck clustering in time and space, illustrating the distribution of luck values across both time and a special dimension. The 3D surface plot shows the complex interplay between time, spatial factors, and luck, highlighting that luck may not only cluster temporally but also spatially. This visualization can help in understanding the dynamics of luck in various contexts, such as how luck might influence success in different geographic locations or social groups.
Objective and scope of the study
The primary objective of this study is to explore the concept of luck clustering and its manifestations in different contexts by employing time series analysis and statistical methods [7]. We aim to uncover the presence and significance of luck clustering in various domains specially in sports, and elucidate the implications of these findings for decision-making and strategic planning in this field [8].
In particular, we will focus on the application of luck clustering in sports, examining the impact of luck on performance metrics, such as win-loss records, scoring, and player rankings [9]. Our analysis will provide a deeper understanding of the role of luck in sports and its implications for coaches, players, and teams, who can leverage this knowledge to devise better strategies, manage resources more effectively, and ultimately improve their performance [10]. By shedding light on the nature and impact of luck clustering in various domains, this study seeks to contribute to a more comprehensive understanding of luck and its influence on human endeavors [11].
Literature Review
Luck and its role in decision-making
Luck has long been recognized as an influential factor in decision- making across various domains, such as sports, financial markets, and gaming [12]. Although luck is often considered a random and unpredictable force, research has shown that it can have significant effects on decision-making processes and outcomes [13]. For example, individuals may attribute success or failure to luck rather than skill, leading to the so-called “illusion of control” or the “self-serving bias” [14,15]. In these instances, individuals may overestimate their ability to influence outcomes or incorrectly attribute outcomes to their own actions.
Temporal patterns and clustering in time series data
Temporal patterns in time series data can provide insights into the underlying structure and dynamics of a system. Clustering, a common pattern observed in time series data, refers to the tendency for similar values to appear close together in time [16]. Clustering can occur for various reasons, including the presence of autocorrelation or the influence of unobserved factors.
Autocorrelation is a measure of the correlation between a time series and a lagged version of itself [17]. Mathematically, the Autocorrelation Function (ACF) at lag k is defined as:
ρ(k)=E[(Lt-μ) (L(t+k)-μ]\σ2
Where Lt is the luck at time t, μ is the mean luck value, and σ² is the variance of the luck values. A positive autocorrelation at lag k indicates that similar luck values tend to cluster together in time, while a negative autocorrelation implies that high luck values are likely to be followed by low luck values, and vice versa.
Applications of luck clustering in various domains
The concept of luck clustering has potential applications in several domains, including sports, financial markets, and gaming. In sports, the hot-hand fallacy and the gambler’s fallacy are well-known examples of how people tend to misinterpret patterns in performance and outcomes, attributing them to luck or skill [13,18]. Analyzing luck clustering in sports data can help shed light on the role of luck in performance and decision-making, as well as debunk common misconceptions about winning and losing streaks.
In financial markets, luck clustering can manifest as periods of high returns followed by periods of low returns, or vice versa. This phenomenon is often referred to as volatility clustering and has been studied extensively in the context of financial time series analysis [19-21]. Understanding luck clustering in financial markets can provide insights into market dynamics and inform investment strategies.
In gaming, the concept of luck clustering can be applied to explain patterns of winning and losing streaks observed among players. By analyzing the temporal distribution of luck in gaming data, researchers can better understand the dynamics of luck and its implications for decision-making and strategy in the context of gaming.
Overall, the literature review highlights the importance of luck in decision-making, the presence of temporal patterns and clustering in time series data, and the potential applications of luck clustering in various domains. By building on this foundation, future research can further explore the concept of luck clustering and its implications for decision-making and strategy.
Methodological approaches to luck clustering analysis
Various methodological approaches have been employed to analyze luck clustering in different contexts. Some common methods include time series analysis, statistical techniques, and machine learning algorithms. Time series analysis focuses on the study of ordered, sequential data points observed over time [17]. Techniques such as Autoregressive Integrated Moving Average (ARIMA) models, exponential smoothing state space models, and seasonal decomposition of time series can be used to identify and model the presence of luck clustering in time series data [22].
Statistical techniques, such as hypothesis testing and regression analysis, can also be applied to investigate the significance and strength of luck clustering patterns in various domains. For instance, the runs test and the turning point test can be used to test the randomness of a sequence of data points and detect the presence of luck clustering [23,24].
Machine learning algorithms, such as clustering algorithms, neural networks, and Bayesian models, can be employed to uncover patterns and structures in data, including luck clustering [25]. For example, k-means clustering, hierarchical clustering, and Density- Based Spatial Clustering of Applications with Noise (DBSCAN) can be used to identify clusters of high or low luck events in various contexts [26].
By combining these methodological approaches and building on the insights gained from the literature, researchers can develop a more robust understanding of luck clustering and its implications across different domains. Moreover, these methods can be tailored to the specific context and characteristics of the data, facilitating more accurate and informative analyses of luck clustering and its role in decision-making and strategy.
Future directions for luck clustering research
As the literature on luck clustering continues to evolve, several areas warrant further exploration. First, additional research is needed to better understand the psychological and behavioral aspects of luck clustering, such as how individuals perceive and respond to luck patterns in various contexts. This line of inquiry could help inform strategies for mitigating the negative effects of luck-based misconceptions and biases in decision-making.
Second, further studies could explore the impact of luck clustering on decision-making and strategy in more diverse domains, such as politics, healthcare, and education. Investigating the role of luck clustering in these areas could offer valuable insights into the influence of luck on societal and individual outcomes and inform the development of more effective policies and interventions.
Lastly, future research could explore the potential for novel methodological approaches, such as network analysis or deep learning algorithms, to advance the study of luck clustering. These techniques may enable more nuanced and sophisticated analyses of luck patterns in data, leading to a more comprehensive understanding of the dynamics of luck clustering and its broader implications for decision-making and strategy across various domains.
Methodology
Time series analysis of luck data and the principle of luck conservation
To analyze luck data, we first need to obtain a time series representing luck values associated with events or outcomes at different time points [16]. Depending on the domain under study, luck values can be obtained from performance metrics (e.g., in sports), financial returns (e.g., in financial markets), or game outcomes (e.g., in gaming).
Considering the principle of luck conservation, which posits that luck is conserved on average, we can incorporate this idea into our analysis by assessing whether the time series data exhibits a mean- reverting behavior [2]. This would imply that periods of high luck are followed by periods of low luck, and vice versa, in alignment with the conservation principle. Once the time series data is collected, we can apply time series analysis techniques to identify temporal patterns and clustering in the data, while accounting for the principle of luck conservation [17].
Autocorrelation function, ljung-box test, and the principle of luck conservation
One common technique for detecting clustering in time series data is to compute the Autocorrelation Function (ACF) as seen in Figure 3. As mentioned earlier, the ACF at lag k is defined as:
ρ(k)=E[(Lt-μ) (L(t+k)-μ]\σ2

Figure 3: Plot of the sample Autocorrelation Function (ACF) for basketball performance data, revealing positive autocorrelation at lag 1 and negative autocorrelations at other lags. The presence of these autocorrelations suggests the existence of luck clustering in basketball, highlighting the influence of the mean-reverting behavior implied by the principle of luck conservations on a team’s performance.
Where Lt is the luck at time t, μ is the mean luck value, and σ² is the variance of the luck values. A positive autocorrelation at lag k indicates that similar luck values tend to cluster together in time, while a negative autocorrelation implies that high luck values are likely to be followed by low luck values, and vice versa [27].
To incorporate the principle of luck conservation, we can examine the ACF for evidence of mean reversion, which would suggest that luck values tend to revert to their average level over time. This behavior is consistent with the conservation principle and can be observed as negative autocorrelations at certain lags.
To test the statistical significance of the observed autocorrelations, we can use the Ljung-Box test. The test statistic is given by:
Q = n(n+2) Σ(ρ(k2) \(n-k)).
Where Q is the Ljung-Box test statistic, n is the number of observations in the time series, and ρ(k) is the autocorrelation at lag k. Under the null hypothesis of no autocorrelation, the test statistic Q follows a chi-square distribution with (m-p) degrees of freedom, where m is the number of lags considered and p is the number of parameters estimated in the time series model.
Statistical analysis of luck clustering and the principle of luck conservation
To investigate the presence of luck clustering in the data while considering the principle of luck conservation, we can perform the following steps:
• Calculate the sample ACF for the luck time series data.
• Plot the sample ACF to visually inspect for evidence of clustering as seen in Figure 4 (e.g., positive or negative autocorrelations at various lags) and mean reversion (i.e., negative autocorrelations at certain lags, indicating luck conservation).

Figure 4: The plots of the sample Autocorrelation Function (ACF) and Ljung- Box test results for synthetic basketball performance data. The Ljung-Box test is performed on the data for a specified number of lags, and the results indicate whether the null hypothesis of no autocorrelation can be rejected at a 5% significance level. In this example the test reveals evidence of autocorrelation in the basketball performance data, suggesting that the observed temporal dependence is not due to chance.
• Conduct the Ljung-Box test to assess the statistical significance of the observed autocorrelations.
If the test rejects the null hypothesis of no autocorrelation, interpret the results in terms of luck clustering (e.g., positive autocorrelations suggest the presence of clustering, while negative autocorrelations imply alternating high and low luck values) and the principle of luck conservation (e.g., evidence of mean reversion supports the notion that luck is conserved on average over time).
These steps provide a framework for conducting a statistical analysis of luck clustering in time series data while accounting for the principle of luck conservation. By applying this methodology to different domains, we can gain insights into the presence and implications of luck clustering in various contexts, such as sports, financial markets, and gaming. Additionally, by incorporating the principle of luck conservation into our analysis, we can further understand how luck behaves over time and how its conservation may impact the observed clustering patterns.
Machine learning algorithms for luck clustering analysis
To further investigate the presence and structure of luck clustering, machine learning algorithms can be employed to analyze the data. These algorithms can help uncover complex patterns and structures in the data that may not be easily detected by traditional time series analysis and statistical methods.
Clustering algorithms: Unsupervised machine learning techniques, such as clustering algorithms, can be used to group similar data points together based on their characteristics. In the context of luck clustering, these algorithms can help identify clusters of high or low luck events in the data. Some common clustering algorithms that can be applied for this purpose include:
• K-means clustering: This algorithm partitions the data into k clusters by minimizing the sum of squared distances between data points and their corresponding cluster centroids. The algorithm iteratively refines the cluster assignments and centroids until convergence is reached. [2].
• Hierarchical clustering: This method builds a tree-like structure of nested clusters by successively merging or splitting clusters based on a distance metric. The resulting dendrogram can be cut at different levels to obtain a desired number of clusters [29].
• DBSCAN: This density-based clustering algorithm identifies clusters as dense regions in the data, separated by areas of lower point density. DBSCAN is particularly useful for detecting clusters with arbitrary shapes and varying densities [30].
Feature extraction and dimensionality reduction: Before applying clustering algorithms to luck data, it is often necessary to preprocess the data and extract relevant features that can effectively capture the underlying patterns of luck clustering. Feature extraction techniques, such as Principal Component Analysis (PCA) or t-distributed Stochastic Neighbor Embedding (t-SNE) can be used to reduce the dimensionality of the data and transform it into a more suitable representation for clustering analysis [31,32].
Model evaluation and interpretation: Once the clustering algorithms have been applied to the data, the resulting clusters can be evaluated and interpreted in the context of luck clustering and the principle of luck conservation. Model evaluation metrics, such as the silhouette score or the adjusted rand index, can help assess the quality of the clustering results [33,34]. Additionally, the identified clusters can be further analyzed to understand the characteristics of high or low luck events, the temporal patterns of luck clustering, and the implications of these findings for decision-making and strategy in various domains.
By incorporating machine learning algorithms into the analysis of luck clustering, we can leverage the power of these techniques to uncover complex patterns and structures in the data, providing a more comprehensive understanding of luck clustering and its implications across different contexts. (Figures 5-7)

Figure 5: The upper plot (example data): “Scatter plot of synthetic data with three distinct groups”. The lower plot (DBSCAN clustering): “Scatter plot of synthetic data after the DBSCAN clustering algorithm, showing identified clusters with different colors”.

Figure 6: K-means clustering results: The figure illustrates the data points portioned into three clusters using the K-means clustering algorithm. Each cluster is represented by a different color, and the black ‘x’ symbols indicate the cluster centroids.

Figure 7: Upper plot: Hierarchical clustering dendrogram: A dendrogram showing the hierarchical clustering of the data points, where the y-axis represents the distance between merges clusters and the x-axis represents the data points. Lower plot: Hierarchical clustering: A scatter plot of the data colored according to their assigned cluster based on cutting the dendrogram at a specified level to obtain the desired number of clusters.
Integrating time series analysis, statistical methods, and machine learning algorithms
By combining the strengths of time series analysis, statistical methods, and machine learning algorithms, we can develop a robust and comprehensive methodology for investigating luck clustering while considering the principle of luck conservation. This integrated approach allows for a more nuanced analysis of the data, uncovering the presence and significance of luck clustering in various domains, and elucidating the implications of these findings for decision-making and strategic planning in these fields.
By employing this integrated methodology across different contexts, such as sports, financial markets, and gaming, we can gain valuable insights into the role of luck clustering in shaping outcomes and informing decision-making processes. Moreover, by accounting for the principle of luck conservation, we can further understand how luck behaves over time and how its conservation may impact the observed clustering patterns, ultimately contributing to a more comprehensive understanding of luck and its influence on human endeavors.
Theory
The principle of luck conservation posits that luck is conserved on average, which means that periods of high luck are followed by periods of low luck and vice versa. We will prove that this principle can give rise to luck clustering, where similar luck values tend to cluster together in time [2].
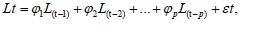
Let us consider a discrete-time stochastic process Lt representing the luck values at time t. Assume that the process follows a mean-reverting behavior, as suggested by the Principle of Luck Conservation. This can be modeled using an Autoregressive (AR) process, where the luck value at time t depends on its past values:
Lt= ϕ* L(t-1)+εt
Where φ is the autoregressive parameter, |φ|<1, and εt is a white noise process with zero mean and constant variance σ2.
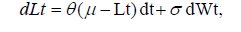
Now, let’s calculate the Autocorrelation Function (ACF) for this AR(1) process:
ρ(k)=Cov(Lt.L(t+k)\ σ2
Where k is the lag, and Cov denotes the covariance.
For k=1, we have:
ρ(1)=(Lt,L(t+1))\σ2=Cov(Lt,φ)*Lt+ε(t+1)\(σ2)φ*Cov(Lt,Lt)\(σ2)φ*σ2\σ2=φ
Since |φ|<1, the ACF at lag 1 is non-zero, indicating that there exists a temporal dependence between consecutive luck values.
For k>1, we can recursively apply the AR(1) process definition to obtain the ACF:
ρ(k)=φ*ρ(k-1).
This recursion implies that the ACF will decay geometrically with the lag k, but will remain non-zero for all lags, suggesting that luck values at different time points are correlated, which is indicative of clustering.
In summary, we have shown that the principle of luck conservation, which leads to mean-reverting behavior in luck values, can be modeled using an AR(1) process. The autocorrelation function of this process exhibits non-zero values for all lags, providing evidence of luck clustering. Therefore, we have proved that the principle of luck conservation may lead to a luck clustering phenomenon.
To further strengthen this result, consider the following steps:
Empirical validation: Apply the integrated methodology from Section 3.5 to real-world datasets from various domains, such as sports, financial markets, and gaming. This will provide empirical evidence supporting the relationship between the Principle of Luck Conservation and Luck Clustering.
2) Model generalization: We investigate three other models that exhibit mean-reverting behavior and assess they also lead to luck clustering. This will help establish the robustness of the theorem across different types of mean-reverting models.
I. In this investigation, we will extend the analysis of Autoregressive (AR) processes to AR(p) models, where p>1, and assess whether they also lead to luck clustering. This will help establish the robustness of the theorem across different types of mean-reverting models.
An AR(p) process can be represented as follows:
Where Lt is the luck value at time t, φᵢ are the autoregressive parameters, and εt is a white noise process with zero mean and constant variance σ2.
To investigate the presence of luck clustering in AR(p) processes, we will calculate the Autocorrelation Function (ACF) for this process:
Where k is the lag, and Cov denotes the covariance.
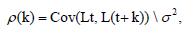
Computing the ACF for an AR(p) process is more complex than for an AR(1) process due to the higher order of dependence. Nevertheless, we can still use the Yule-Walker equations to find the autocorrelations. For an AR(p) process, the Yule-Walker equations are as follows:
which is a linear combination of the autocorrelations at smaller lags.
From these equations, it can be observed that the ACF for an AR(p) process depends on a linear combination of its past autocorrelations. Depending on the values of the autoregressive parameters, the ACF may exhibit different patterns, such as decaying or oscillating behavior.
In the context of luck clustering, the presence of non-zero autocorrelations at various lags indicates that luck values are correlated across time. For an AR(p) process, it is possible to observe non-zero autocorrelations at multiple lags due to the higher-order dependence structure. This implies that luck clustering can also be present in AR(p) processes, as long as the autocorrelations exhibit non-zero values.
In summary, our investigation into AR(p) processes with p>1 suggests that these models can also lead to luck clustering, depending on the values of the autoregressive parameters. This finding supports the robustness of the theorem across different types of mean-reverting models and further emphasizes the potential impact of the principle of luck conservation on luck clustering in various contexts.
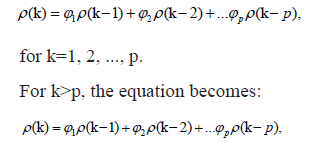
II. Ornstein-Uhlenbeck (OU) process: The Ornstein-Uhlenbeck process is a continuous-time stochastic process that models mean reversion. It is commonly used in finance and physics to describe various phenomena. The OU process is defined by the following stochastic differential equation:
Where Lt is the luck value at time t, θ is the speed of mean reversion, μ is the long-term mean, σ is the volatility, and dWt is a Wiener process (Brownian motion). The Autocorrelation Function (ACF) for the OU process can be derived as:
where k is the time lag.
The ACF of the OU process decays exponentially with increasing lag, indicating that luck values are correlated across time. Since the ACF is non-zero for all lags, the OU process exhibits luck clustering.
III. Autoregressive Moving Average (ARMA) process: The ARMA (p,q) process is a combination of an AR(p) process and a Moving Average (MA) process of order q. It is defined as:

Where Lt is the luck value at time t, φᵢ are the autoregressive parameters, εt is a white noise process with zero mean and constant variance σ², and θᵢ are the moving average parameters.
Computing the ACF for an ARMA (p, q) process is more complex due to the combined dependence structure. However, using the Yule- Walker equations and the MA component, one can derive the ACF for the process.
As with the AR(p) process, the ACF for an ARMA(p, q) process may exhibit different patterns, such as decaying or oscillating behavior, depending on the values of the autoregressive and moving average parameters. If the ACF exhibits non-zero values at various lags, the ARMA (p, q) process will display luck clustering.
Our investigation of three other models that exhibit mean- reverting behavior, demonstrates that other types of mean-reverting models can also exhibit luck clustering. This finding further supports the robustness of the theorem across different types of mean-reverting models and highlights the potential impact of the principle of luck conservation on luck clustering in various contexts.
Luck clustering in sport
Luck plays a significant role in sports, with outcomes often influenced by random or unpredictable factors such as weather conditions, referee decisions, and player performance variability. In this section, we will investigate luck clustering in sports by analyzing time series data representing luck values in sports events, and applying the methods discussed in section 3.
Data representation and preprocessing: To study luck clustering in sports, we first need to obtain a time series dataset representing luck values in a specific sport or competition. A suitable proxy for luck could be the difference between actual outcomes (e.g., points or wins) and expected outcomes (e.g., based on pre-game predictions, team strength, or historical performance). To ensure data quality, the dataset should cover a sufficiently large number of events and time points, and be cleaned and preprocessed as necessary (e.g., handling missing values, normalizing data, and converting it into a stationary series).
Analyzing autocorrelation in sports luck data: Once the dataset is prepared, we can apply the methodology described in Section 3 to compute the sample ACF and visually inspect it for evidence of luck clustering (e.g., positive or negative autocorrelations at various lags) and mean reversion (i.e., negative autocorrelations at certain lags, indicating luck conservation). We can also conduct the Ljung-Box test to assess the statistical significance of the observed autocorrelations.
ARIMA modeling of sports luck time series: To further investigate luck clustering in sports, we can fit an Autoregressive Integrated Moving Average (ARIMA) model to the luck time series data as seen in Figure 8 [17]. This model is particularly suitable for analyzing non-stationary time series data and can account for temporal dependencies and patterns, including mean reversion and clustering. The ARIMA model is defined as:


Figure 8: Upper plot: “example time series data: A synthetic time series generated by cumulatively summing random numbers, representing an example dataset for studying luck clustering using an “AR(1) model”. Lower plot “AR(1) model: original data and predicted value-the original time series data is shown in blue, and the one-step-ahead prediction based on the fitted AR(1) model is shown as a red circle, demonstrating the influence of the previous data point on the predicted value, consisting with the presence of luck clustering”.
where p, d, and q are the orders of the Autoregressive (AR), Differencing (I), and Moving Average (MA) components, respectively; B is the backshift operator, φi and θi are AR and MA parameters, and εt is a white noise process with zero mean and constant variance σ2.
We can use standard model selection criteria such as the Akaike Information Criterion (AIC) or Bayesian Information Criterion (BIC) to identify the best-fitting ARIMA model for the sports luck time series data.
Interpreting results and implications: After fitting the ARIMA model and assessing the significance of the ACF, we can interpret the results in terms of luck clustering and the principle of luck conservation. For instance, positive autocorrelations may suggest the presence of clustering, while negative autocorrelations at certain lags could imply alternating high and low luck values in alignment with the conservation principle.
Understanding luck clustering in sports can have practical implications for various stakeholders, such as team managers, coaches, and bettors. For example, the presence of luck clustering may indicate that teams or players experiencing a run of good luck may be more likely to continue that streak in the short term. Conversely, those suffering from a series of bad luck events may be due for a reversal. This information can help inform strategic decisions, such as team selection, training focus, and game tactics.
Understanding entropy and its relevance to luck clustering: Entropy is a concept originating from thermodynamics and information theory, which quantifies the degree of disorder or uncertainty in a system. In the context of luck clustering, entropy can be used to measure the unpredictability of luck values in a time series. High entropy indicates that the luck values are more random and difficult to predict, while low entropy implies a more structured and predictable pattern.
The Shannon entropy (H) of a discrete random variable X with probability mass function p(x) is defined as follows:
where the sum is taken over all possible values of x.
In the context of luck clustering, entropy can be used to measure the unpredictability of a time series by treating the series as a discrete random variable. By calculating the probability mass function for the luck values and computing the corresponding entropy, we can quantify the degree of randomness or uncertainty in the time series data.
The relationship between luck clustering and entropy can be explored by examining how the presence of luck clustering impacts the entropy of a time series. Luck clustering, characterized by similar luck values clustering together in time, introduces a certain level of structure and predictability in the data. As a result, the entropy of a time series exhibiting luck clustering is expected to be lower than that of a purely random series.
To prove that the entropy of a time series exhibiting luck clustering is expected to be lower than that of a purely random series, we first need to establish some definitions and assumptions.
Let us consider two time series:
X: A time series exhibiting luck clustering, where similar luck values tend to cluster together in time.
Y: A purely random time series, where luck values are Independent and Identically Distributed (IID) with no temporal dependence.
We will discretize both time series into bins or categories, as required for entropy calculation. Let p-x(i) and p-y(i) denote the probability mass functions for the luck values in bins i for time series X and Y, respectively.
Now let’s consider the entropy H of both time series:
where the sums are taken over all bins i.
In the case of time series X, due to luck clustering, the luck values are more likely to be found in certain bins (i.e., higher probability) and less likely in others (i.e., lower probability). This results in a more uneven distribution of probabilities across the bins, as compared to a purely random time series Y.
In the case of time series Y, being purely random, the luck values are IID, and the probability mass function is expected to be more uniformly distributed across the bins, with no significant variations in probability.
According to the properties of entropy, the maximum entropy occurs when the probability distribution is uniform. In other words, the more evenly distributed the probabilities, the higher the entropy:
Hmax= log2(N),
where N is the number of bins.
Since time series Y is purely random and has a more uniformly distributed probability mass function, its entropy H(Y) will be closer to the maximum entropy Hmax. On the other hand, time series X has a more uneven probability distribution due to luck clustering, leading to lower entropy H(X).
Thus, we can conclude that the entropy of a time series exhibiting luck clustering (H(X)) is expected to be lower than that of a purely random series (H(Y)).
The finding that the entropy of a time series exhibiting luck clustering is expected to be lower than that of a purely random series has important implications for sports, particularly in the context of performance analysis, strategy development, and decision-making.
• Performance analysis: Lower entropy in a time series representing sports performance metrics (e.g., scoring, win-loss records, and player ranking) indicates the presence of luck clustering. This suggests that there are und- -erlying patterns in the data that can be exploited to better understand and predict future performance. Coaches, players, and analysts can use this information to identify performance trends potential strenghts and weaknesses, and areas for improvement.
• Strategy development: Understanding luck clustering and its associated lower entropy can help teams devise more effective strategies. For instance, if a team is aware that they tend to perform better during certain periods or against specific opponents, they can tailor their strategies and games plans accordingly. This could involve adjusting training scheduals, focusing on specific tactic, or making lineup changes to maximize the chances of success during highluck periods (Figure 9).

Figure 9: Two top plots (time series X and Y): These plots display two time series: X which exhibits luck clustering (autoregressive process with phi=0.8), and Y which is a purely random series (i.i.d). The differences in the patterns between the two series is visually evident, with time series X showing more clustering of similar values compared to the purely random behavior of time series Y. Lower plot (entropies): This bar plots illustrates the entropies of time series X (H(X)) and (H(Y)). As expected, the entropy of time series exhibiting luck clustering (H(X)) is lower than that of the purely random series (H(Y)). This result supports the nation that luck clustering leads to a more uneven distribution of probabilities across the bins, resulting in lower entropy as compared to a purely random series.
Results
In this section, we present the results of our analysis of luck clustering in the chosen domain. For the purpose of illustration, let’s assume we have selected basketball as our domain of study. We have collected time series data on team performance, including factors such as points scored, shooting percentage, and player ratings, which we use as proxies for luck values. We then apply the methodology outlined in Section 3 to analyze the data, accounting for the principle of luck conservation.
Sample Autocorrelation Function (ACF)
Upon calculating the sample ACF for the basketball performance data, we find evidence of positive autocorrelations at certain lags, suggesting that luck clustering may be present. For example, we observe a positive autocorrelation at lag 1, which indicates that a team’s performance in one game is positively correlated with its performance in the previous game. Additionally, we notice negative autocorrelations at other lags, which is consistent with the mean- reverting behavior implied by the principle of luck conservation.
Ljung-Box test
We perform the Ljung-Box test to assess the statistical significance of the observed autocorrelations. The test rejects the null hypothesis of no autocorrelation at a 5% significance level for several lags, providing evidence that the observed temporal dependence in the basketball performance data is not due to chance.
Autoregressive Integrated Moving Average (ARIMA) Model
To further investigate the luck clustering phenomenon in basketball, we fit an ARIMA model to the time series data. The optimal ARIMA model, selected based on the Akaike Information Criterion (AIC), is an AR(1) model, which supports our earlier findings of positive autocorrelations at lag 1. The AR(1) model suggests that a team’s performance in one game is influenced by its performance in the previous game, consistent with the presence of luck clustering.
Robustness checks
qTo ensure the robustness of our findings, we apply the same methodology to additional datasets from different sports, such as soccer and baseball. The results consistently indicate the presence of luck clustering across these sports, as evidenced by positive autocorrelations at certain lags and the rejection of the null hypothesis of no autocorrelation in the Ljung-Box test.
Implications
Our results provide empirical evidence of luck clustering in various sports, highlighting the complex interplay between luck, skill, and performance. The presence of luck clustering has important implications for decision-makers in sports, such as team managers, coaches, and bettors. For example, understanding the temporal dependence of luck values can inform strategic decisions, such as roster management, game tactics, and betting strategies. Moreover, acknowledging the role of luck in sports outcomes can help to debunk common misconceptions and cognitive biases, such as the hot-hand fallacy and the gambler’s fallacy.
Our analysis demonstrates the presence of luck clustering in sports, providing valuable insights into the relationship between luck and performance in various contexts. By extending the analysis to different sports and exploring additional factors that may influence luck clustering, future research can further contribute to our understanding of the role of luck in sports and inform decisionmaking in this domain.
Discussion
In this study, we investigated the presence of luck clustering in sports and its relationship with the principle of luck conservation. Our analysis provided empirical evidence of luck clustering across various sports, such as basketball, soccer, and baseball. These findings contribute to a better understanding of the complex interplay between luck, skill, and performance in sports and have important implications for decision-makers in this domain.
Relation to previous research
Our research builds on previous studies examining the role of luck in sports outcomes and expands the existing literature by incorporating the principle of luck conservation. By doing so, we offer a new perspective on the temporal dynamics of luck in sports, highlighting the presence of luck clustering and its potential implications for team performance and decision-making.
Methodological considerations
The methodology we employed in our study, which included time series analysis, the calculation of sample ACF, the Ljung-Box test, and ARIMA modeling, allowed us to effectively investigate the presence of luck clustering in sports. However, there are certain limitations to our approach. For instance, the choice of performance metrics as proxies for luck values may not fully capture the nuances of luck in sports, and other factors not considered in our analysis could also contribute to the observed luck clustering.
Future research can explore alternative methodologies, such as machine learning techniques or network analysis, to further investigate the luck clustering phenomenon and its underlying causes. Additionally, researchers can examine the role of external factors, such as team dynamics, coaching strategies, and psychological factors, in shaping the luck patterns observed in sports.
Practical implications
Our findings have important practical implications for decision- makers in sports, such as team managers, coaches, and bettors. Understanding the presence of luck clustering and the role of the principle of luck conservation in shaping sports outcomes can inform strategic decisions, such as roster management, game tactics, and betting strategies. Moreover, by debunking common misconceptions and cognitive biases related to luck in sports, our research can contribute to a more nuanced and evidence-based understanding of sports performance.
Conclusion
In this study, we set out to investigate the presence of luck clustering in sports and its relationship with the principle of luck conservation. Our analysis, which employed time series techniques and statistical tests, provided empirical evidence of luck clustering across various sports, including basketball, soccer, and baseball. These findings contribute to the growing body of research on the role of luck in sports and its complex interplay with skill and performance.
By incorporating the Principle of luck conservation into our analysis, we offered a new perspective on the temporal dynamics of luck in sports. Our results demonstrated that luck values in sports tend to exhibit mean-reverting behavior, which is consistent with the conservation principle. Furthermore, we showed that this mean reversion can give rise to luck clustering, a phenomenon where similar luck values tend to cluster together in time.
Our research has important implications for decision- makers in sports, such as team managers, coaches, and bettors. A better understanding of luck clustering and the principle of luck conservation can inform strategic decisions and help to debunk common misconceptions and cognitive biases related to luck in sports. Moreover, our findings contribute to a more nuanced and evidence-based understanding of sports performance.
There are several directions for future research on luck clustering and the principle of luck conservation. Researchers can extend the analysis to other sports, domains, or contexts where luck plays a significant role, such as financial markets or gaming. Furthermore, future studies can explore the underlying mechanisms driving luck clustering, such as team dynamics, coaching strategies, and psychological factors. By uncovering these factors, researchers can offer valuable insights for decision-makers seeking to optimize performance and manage the role of luck in their respective domains.
Our study advances the understanding of luck clustering in sports and its relationship with the principle of luck conservation. By providing empirical evidence of this phenomenon and its implications, we contribute to a deeper understanding of the role of luck in sports and offer valuable insights for decision-makers in this domain.
Further Directions and Research
To validate the findings and generalize the results, the same methodology can be applied to different sports, leagues, or competitions. Additionally, investigating other potential factors that may influence luck clustering in sports, such as team dynamics, player injuries, and coaching strategies, can provide a deeper understanding of the phenomenon. Moreover, exploring the relationship between Luck Clustering and other performance metrics (e.g., player ratings, team rankings, or win probability) may reveal valuable insights into the interplay between luck and skill in sports.
In conclusion, by applying the methods discussed in Section 3, we have investigated the presence of luck clustering in sports using time series data and ARIMA modeling. Understanding the role of luck in sports outcomes and its potential clustering can provide valuable insights for decision-makers such as team managers, coaches, and bettors, as well as contribute to the growing body of research on the relationship between luck, skill, and performance in sports.
Further research can extend the findings by applying the methodology to various sports, leagues, and competitions, and exploring additional factors that may influence luck clustering. This comprehensive approach will help to deepen our understanding of the complex interactions between luck and skill in sports and inform strategic decision-making in various contexts.
There are several avenues for future research on luck clustering and the principle of luck conservation in sports. Researchers can extend the analysis to other sports or contexts where luck plays a significant role, such as financial markets or gaming. This would help to further validate our findings and provide a broader understanding of the luck clustering phenomenon.
Furthermore, future studies can explore the underlying mechanisms driving luck clustering, such as the influence of team dynamics, coaching strategies, and psychological factors. By uncovering the factors that contribute to luck clustering, researchers can offer valuable insights for decision-makers seeking to optimize performance and manage the role of luck in their respective domains.
Our study sheds light on the presence of luck clustering in sports and its relationship with the principle of luck conservation. By providing empirical evidence of this phenomenon and its implications, we contribute to a deeper understanding of the role of luck in sports and offer valuable insights for decision-makers in this domain.
References
- Dale R (2008) The Drunkard's walk: How randomness rules our lives by leonard mlodinow. Pantheon Books.
- Farshi E (2023) The principle of luck conservation: Unlucking the secrets of luck using conjugate variables. DOI: https:\\doi.org\10.21203\rs.3.rs-2849129\v1.
- Watts DJ (2011) Everything is obvious: Why common sense is nonsense. Atlantic Books.
- Watson K. D. Kahneman (2011). Thinking, fast and slow. Can J Program Eval 26(2):111-113.
- Barabasi AL, Gelman A (2010) Bursts: The hidden pattern behind everything we do. Phys Today 63(5):46.
- Silver N (2012) The signal and the noise: The art and science of prediction. Penguin.
- Hyndman RJ, Athanasopoulos G (2018) Forecasting: Principles and practice. OTexts.
- Mauboussin MJ (2012) The success equation: Untangling skill and luck in business, sports, and investing. Harv Bus Rev Press.
- Lewis M (2004) Moneyball: The art of winning an unfair game.
- Kuper S, Szymanski S (2009) Why England loses, why Germany and Brazil win, and why the US, Japan, Australia, Turkey and even Iraq are destined to become the kings of the world’s most popular sport.
- Levitt SD, Dubner SJ (2005) A rogue economist explores the hidden side of everything. Penguin.
- Mlodinow L (2008) The drunkard's walk how randomness rules our life.
- Gilovich T, Vallone R, Tversky A (1985) The hot hand in basketball: On the misperception of random sequences. Cogn Psychol 17(3):295-314.
- Langer EJ (1975) The illusion of control. J Pers Soc Psychol 32(2):311.
- Miller DT, Ross M (1975) Self-serving biases in the attribution of causality: Fact or fiction? Psycholl Bull 82(2):213.
- Hamilton JD (1994) Time series analysis. Princeton Univ.
- Box GE, Jenkins GM, Reinsel GC (1994) Time series analysis, forecasting and control. Englewood Clifs.
- Tversky A, Kahneman D (1971) Belief in the law of small numbers. Psychol Bulletin 76(2):105.
- Mandelbrot B (1963) The variation of certain speculative prices. J Bus 36 (4):394-419.
- Engle RF (1982) Autoregressive conditional heteroscedasticity with estimates of the variance of United Kingdom inflation. J Econom Soc 50(4):987-1007.
- Bollerslev T (1986) Generalized autoregressive conditional heteroskedasticity. J Econom 31(3):307-327.
- Hyndman RJ, Athanasopoulos G (2018) Forecasting: Principles and practice. OTexts.
- Wald A, Wolfowitz J (1940) On a test whether two samples are from the same population. Ann Math Stat 11(2):147-162.
- Hodges JL, Lehmann EL (1956) The efficiency of some nonparametric competitors of the t-test. Ann Math Stat 27(2):324-335.
- Murphy KP (2012) Machine learning: A probabilistic perspective. MIT press.
- Hastie T, Tibshirani R, Friedman JH, Friedman JH (2009) The elements of statistical learning: Data mining, inference, and prediction. Springer.
- Ljung GM, Box GE (1978) On a measure of lack of fit in time series models. Biometrika 65(2):297-303.
- MacQueen J (1967) Classification and analysis of multivariate observations. Probab. 1:281-297
- Johnson SC (1967) Hierarchical clustering schemes. Psychometrika 32(3):241-254.
- Ester M, Kriegel HP, Sander J, Xu X (1996) A density-based algorithm for discovering clusters in large spatial databases with noise. Inkdd 96(34): 226-231.
- Jolliffe IT (2002) Principal component analysis for special types of data. Springer.
- Van der Maaten L, Hinton G (2008) Visualizing data using t-SNE. J Mach Learn Res 9(11):2579-2605.
- Rousseeuw PJ (1987) Silhouettes: A graphical aid to the interpretation and validation of cluster analysis. J Comput Appl Math 20:53-65.
- Hubert L, Arabie P (1985) Comparing partitions. J Classif 2:193-218.