Spanish
  Chinese
  Russian
  German
  French
  Japanese
  Portuguese
  Hindi
Hindi Research Article, J Fashion Technol Textile Eng Vol: 6 Issue: 1
Regularities in Variation of Support Functions of Physically Nonlinear Elastic-Visco-Plastic Law of Strain of Cotton Yarn
Sultanov KS1*, Ismþilova SI1 and Mamatova NR2
1Institute of Mechanics and Seismic Stability of Structures of the Academy of Sciences of the Republic of Uzbekistan
2Tashkent Institute of Textile and Light Industry, Uzbekistan
*Corresponding Author : Karim Sultanovich Sultanov
Institute of Mechanics and Seismic Stability of Structures of the Academy of Sciences of the Republic of Uzbekistan, Durmon yuli,31, Tashkent, 100125, Uzbekistan
Tel: +(871) 262-71-32
Fax: (871) 262-71-52
E-mail: sultanov.karim@mail.ru; sultanov.karim@gmail.com
Received: December 26, 2017 Accepted: February 09, 2018 Published: February 09, 2018
Citation: Sultanov KS, Ismþilova SI, Mamatova NR (2018) Regularities in Variation of Support Functions of Physically Nonlinear Elastic-Visco-Plastic Law of Strain of Cotton Yarn. J Fashion Technol Textile Eng 6:1. doi:10.4172/2329-9568.1000166
Abstract
Support functions of the parameters variation of proposed physically nonlinear elastic-viscoplastic law of strain of cotton yarn are determined on the basis of the results of processing the experimental data on yarn tension to breakage. These functions allow us to determine the average values of nonlinear law parameters, which allow its use in practice in solving the applied problems of yarn mechanics and determining and evaluating the strength of cotton yarn.
Keywords: Cotton yarn; Nonlinear law; Variable modulus of strain; Parameters of modulus change; Experiment; Yarn strength; Linear density of yarn
Problem Statement
On the basis of fundamental concepts [1-3] and principles of the mechanics of structurally unsteady bodies and media under strain [4-7], a physically nonlinear elastic-visco-plastic law of strain of cotton yarn under tension to breakage was proposed [8]. Taking into account the unloading, this law takes the following form.
 (1)
(1)
 (2)
(2)
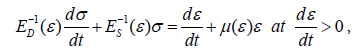
where σ is a longitudinal tensile stress, t − a longitudinal strain of yarn, t − time.
A nonlinear function ES(ε) a quasi-static modulus of strain under cotton yarn tension is defined. The methods for determining ED(ε) a function of dynamic strain modulus, μ(ε) a function of viscosity parameter, ER(ε) a function of unloading modulus are also considered [8]. Strain law (1) is developed on the basis of a linear viscoelastic model of a standard linear body.
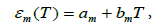
It was shown in [8] that the nonlinear function of the change in modulus of cotton yarn strain ES(ε) has the following parameters: EN is an initial value at ε= εN=0; Ee is a minimum value at ε= εe; Em is a maximum value at ε= εm; Ek is a critical value of the strain modulus at ε= εk at the moment of yarn breakage. Here a value of strain modulus in the interval [εm εk], denoted by ES at ε= εS has also been introduced. The point is that strain modulus in the interval [εm εk], is not always decreasing. In some cases, after reaching the value Em, with further rise in strain, the decline of E ceases, and remains approximately constant or increases. This moment at ε= εS and E = Es is fixed as an additional point. Behind this point, the value of E either continues to decrease or remains constant, or increases.
Thus, the parameters of strain modulus E(ε) variation under yarn tension to breakage are EN, Ee, Em, ES, Ek,εN, εe, εm, εS, εk. The values of these parameters depend on linear density of cotton yarn as the results of experiments show [8]. The aim of this work is to determine the dependence of these parameters on linear density of cotton yarn.
Determination of the Parameters of Strain Modulus
Experiments on cotton yarn tension to breakage were carried out with the nominal linear densities: T=14.0 (2); 15.4 (2); 16.5 (2); 18.5 (5); 29.0 (16); 50.0 (10); 72.0 (4); 100.0 (3); 160.0 (1) tex [8]. The number of spools with given linear density is indicated in parentheses. A total of 45 spools were produced. Before the test, as noted in [8], linear density of the yarn for each spool was determined separately [8]. As a result, actual linear densities of the yarn in each of the 45 spools [8] were obtained, which are given below.
For given nominal density T=14.0 tex: 14.56 and 14.6 tex; for T=15.4 tex: 14.7 and 15.0 tex; for T=16.5 tex: 16.7 and 16.9 tex; for T=18.5 tex: 17.73; 18.41; 18.6; 19.2 and 20.2 tex; for T=29.0 tex: 27.7; 28.10; 28.30; 28.50; 28.52; 28.61; 28.63; 28.7; 28.96; 29.03; 29.1; 29.27; 29.4; 29.5; 29.56 and 31.3 tex; for T=50.0 tex: 48.18; 48.2; 48.54; 49.10; 49.16; 49.32; 49.8; 50.03; 50.02 and 50.7 tex; for T=72.0 tex: 70.68; 71.41; 71.21 and 71.42 tex; for T=100.0 tex: 97.36; 97.4; 102.76 tex and T=162.13 tex.
Cotton yarns from each spool were tested on the «Statimat C» device consistently for 50 times, i.e. the experiment is repeated for 50 times. Then, the obtained 50 dependences of tensile force F (ÑÂÃÂ) versus strain ε (%) are averaged by the software installed in the device. From the obtained average dependence F(ε) we determine the change in strain modulus E(ε) by the method described [8]. From each dependence E(ε) (total number of dependences E(ε) is 45), the values of parameters EN, Ee, Em, ES, Ek in MPa and εe, εm, εS, εk in dimensionless form were determined according to the method described in [8]. The value of εN is taken equal to zero (εN=0).
Figure 1 shows the changes in initial values of strain modulus EN in MPa, depending on the actual linear density T in tex (1 tex = 10‒5 N/m), based on experimental data (curve 1). Here, linear density of cotton yarn T corresponds to the actual measured value before the experiment for each yarn spool.

Figure 1: Dependences of initial value of strain modulus EN vs linear density of cotton yarn
As seen from Figure 1, the change in actual initial values EN at different actual values of T (curve 1) has a significant scattering.
The general trend of change in curve 1, Figure 1, is decreased with increased T. However, the very stochastic change in functions T and EN (T) according to curve 1, Figure 1, could not be described analytically, so this curve was averaged over the nominal values of linear densities of cotton yarn. At the same time, close values of nominal linear densities were also combined into one group. As a result, the following six groups of linear densities were obtained.
The first group includes the yarns related to the nominal linear densities of T =14.0; 15.4; 16.5; 18.5 tex. The second group consists of yarns related to T =29.0 tex. The third group includes the yarns related to T =50.0 tex. The fourth group includes the yarns related to T =72.0 tex. The fifth group includes the yarns related to T =100.0 tex and the sixth group consists of yarns with T =160.0 tex. For each group, the values of linear density and the parameters EN, Ee, Em, ES, Ek,, εN, εe, εm, εS and εk were also averaged.
Curve 2, Figure 1, was obtained using the averaged values of T and EN for six groups. As seen from Figure 1 (curve 2), the change in mean values of EN for T groups has already some explainable pattern of variation with increasing linear density of yarn. For small values of T, the initial value of strain modulus EN is the greatest, and then the value of EN decreases with increasing T. At nominal values of T =100.0 and 162.0 tex, a slight increase in value EN was observed. Now, curve 2, Figure 1, can be approximated by an analytic function. To do this, we choose a decreasing power function in the form
 (3)
(3)
Where ENk, TS and , ENk, TS and  are the coefficients of function (3), which must be determined. The ratio T/TS is taken in order to have a dimensionless value in parenthesis in relationship (3). With the value of TS = 50.0 tex, in most cases the values of dependence parameters E(ε) become steady or increasing.
The remaining two parameters of formula (3) ENk and χ1 are determined by the method of least squares on a computer, and they are: ENk =2872.944 MPa and χ1 = ‒0.302174. Here is a dimensionless quantity. Curve 3, Figure 1, is constructed using formula (3).
The change in strain modulus EN with increasing linear density of cotton yarn T, according to curve 3 (dotted curve), Figure 1, occurs monotonically, without any leaps. Thus, with certain transformations and averaging of curve 1 (Figure 1), obtained as a result of processing the results of the experiments, we obtain curve 3, which already indicates a certain pattern of change in the strain modulus EN at different values of linear density of cotton yarn T.
With increasing linear density of cotton yarn T the value of strain modulus EN gradually decreases. This statement, in general, does not contradict the results given in [1-3]. Using formula (3), it is possible to determine the value of strain modulus EN for any value of linear density of the yarn obtained by pneumo-mechanical method of card system spinning.
Figure 2 shows the change in the second parameter E(ε), of the minimum value of strain modulus Ee, in MPa, depending on linear density of cotton yarn.
Here, as in Figure 1, curve 1 – is a variation in actual values of Ee depending on actual values of linear density of the yarn T. Curve 2 – is a variation in averaged values of Ee depending on average values of actual values of T. As seen from Figure 2 (curve 2), the value of Ee with increasing linear density of the yarn sharply decreases to the value of TS = 50,0 tex, while at T>50.0 tex its decrease is not so intensive.

Figure 2: Dependences of the minimum value of strain modulus Ee vs. linear density of cotton yarn.
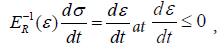
Approximate curve 2 (Figure 2) with power function in the form
 (4)
(4)
The coefficients Eek = 1274.765 ÃÂœPa and χ2 = ‒0.544665 are determined by the method of least squares.
Curve 3, Figure 2, is constructed using formula (4). This curve is already a monotonically decreasing function of Ee , depending on the value of linear density of the yarn T.
Figure 3 shows similar variations in the parameter of Em − the maximum value of strain modulus of cotton yarn versus linear density of the yarn T.

Figure 3: Dependences of the maximum value of strain modulus Em vs linear density of cotton yarn.
Here, curve 1 is a variation in actual values of Em, depending on actual values of linear density. Curve 2 is constructed from average values of Em and T by groups of linear densities of yarn.
Variations in the maximum average value of strain modulus Em, depending on averaged values of linear density of the yarn (curve 2, Figure 3), change in a more complicated way. To describe this curve, a power function is taken in the form
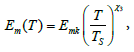 (5)
(5)
Here, the values of coefficients Emk =2705.089 ÃÂœPa and χ3 = ‒0.202455 are determined by the method of least squares. Here, TS =50.0 tex. At linear density from 10 tex to 160 tex, in 10 tex steps, the value of Em is calculated and curve 3 is obtained according to formula (5) (Figure 3).
Curve 3 is actually an approximating curve 2 (Figure 3) and according to formula (5) the value of Em as well as EN and Ee (Figures 1 and 2) decreases monotonically with increasing linear density of yarn T.
Figure 4 shows the variations in the actual (curve 1), averaged (curve 2) and approximating (curve 3) values of strain modulus ES (intermediate between Em and Ek), depending on the values of linear density of cotton yarn T.

Figure 4: Dependences of the intermediate value of strain modulus ES vs linear density of cotton yarn.
Curve 3 is obtained with formula
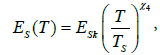 (6)
(6)
where ESk = 2579.042 ÃÂœPa and χ4 = ‒0.141952 both quantities are determined by the method of least squares using the averaged values of ES and T by groups of linear densities.
Figure 5 shows similar changes in the critical strain modulus Ek reached before the breakage of cotton yarn, depending on its linear density. Here, too, curve 1 is plotted by actual values of Ek and T, curve 2 is plotted by averaged values of Ek and T.

Figure 5: Dependences of critical value of strain modulus Ek vs linear density of cotton yarn.
Curve 3 is obtained with formula
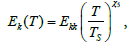 (7)
(7)
The values of coefficients Ekk = 2222.351 ÃÂœPa and χ5 = ‒0.365873 are determined using the least squares method. Here TS=50.0 tex.
The nature of variations in actual, average and approximate curves Ek(T) (curves 1-3, Figure 5) is similar to the changes in EN, Ee, Em and ES depending on the values of linear density of cotton yarn T.
Thus, the change in the parameters of functions of strain modulus E(ε), initial modulus , EN minimum modulus Ee, maximum modulus Em, intermediate modulus ES and critical modulus Ek are determined on the basis of the results of processing experiments on cotton yarn tension to breakage [8].
The nature of the change in functions EN(T), Ee(T), Em(T), ES(T) and Ek(T) according to Figures 1-5 is approximately the same: they generally decrease with increasing linear density of cotton yarn.
Formulas (3)-(7) allow us to determine by calculation the values of EN, Ee, Em, ES and Ek for any values of linear density of yarn T. The obtained values of strain modulus EN, Ee, Em, ES and Ek correspond to a certain average value of these modules for cotton yarns with linear density T of the card system produced by pneumo-mechanical spinning. For other systems and spinning methods, these parameters must be determined from the results of corresponding experiments on yarn tension to breakage.
Determination of Strain Parameters
Strain parameters of the function of modulus change E(ε), are εN, εe, εm, εS and εk Initial value of strain modulus of cotton yarn EN from dependence E(ε), obtained from experimental results, was determined at εN =0.00025, i.e. very close to zero. Therefore, the value of εN in all cases is assumed to be zero, i.e. εN=0. In fact, EN is a strain modulus of non-deformable cotton yarn at εN=0 But the value of EN at εN=0 cannot be determined. Therefore, in the determination of modulus EN, the strain value is taken very close to zero. Consider the change in remaining strain parameters of dependence E(ε), versus linear density of cotton yarn.
Figure 6 shows the dependence of εe,when strain modulus E reaches the value of Ee, on linear density of cotton yarn. Here, curve 1 is plotted according to actual values εe and T, i.e. it shows an actual change in parameter εe from the actual values of linear density of the yarn used in experiments.

Figure 6: Changes in strain εe versus linear density of cotton yarn.
As seen from Figure 6, the change in curve 1 is chaotic and does not yield to any analytical description. Having the average values of εe and T by groups of linear densities of cotton yarn, curve 2 is obtained. From the character of curve 2, it can be stated that with increasing linear density of yarn, the value of εe tends to increase. It is possible to analytically describe curve 2 by a more complicated function. However, for simplicity, it is approximated by a linear function in the form
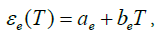 (8)
(8)
where ae=0.000321; be=0.000034 tex‒1, determined by the method of least squares on the basis of dependence (8). Straight line 3 in Figure 6 is constructed using formula (8), setting a value of T from zero to 160 tex, in 10 tex steps. As seen from Figure 6, line 3 is actually the average straight line for curve 2.
Figure 7 shows the changes in strain parameter εm, at which strain modulus of the yarn E reaches its maximum value Em, depending on the values of linear density of cotton yarn T.

Figure 7: Changes in strain value εm vs linear density of cotton yarn
Here, too, curve 1 is an actual change of εm versus actual value of T. Curve 2 is the change in average values of εm and T by groups of linear densities.
Curve 3 in Figure 7 is an approximation of curve 2, just as in the previous case, by a straight line in the form
 (9)
(9)
where am=0.006054; bm=0.000125 tex‒1 – are the coefficients whose values are determined by the method of least squares.
Figure 8 shows the dependencies εS(T) obtained by processing the results of experiments.

Figure 8: Change in strain value εS vs linear density of cotton yarn.
Curve 1 is obtained on the basis of actual values εS with actual values of linear densities.
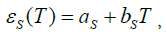
Curve 2 is constructed on the basis of average values εS and T by groups of linear densities. Curve 3 in Figure 8 is an approximation of curve 2, just as in the previous case, by a straight line in the form
 (10)
(10)
Where aS=0.022211; bS=0.000235 tex‒1 – are the coefficients determined using the least squares method.
The change in critical value of strain εk at the moment of cotton yarn breakage versus linear density of the yarn is shown in Figure 9.

Figure 9: Change in strain value vs linear density of cotton yarn.
Here, too, curve 1 describes the change in critical strain εk versus actual linear density of the yarn. As seen from Figure 9, this curve also changes in a complex, stochastic manner.
Curve 2 in Figure 9 is constructed from the average data values of εk and T by groups of linear densities.
Certain regularity is already observed in the character of the change in curve 2 (Figure 9). This curve is also approximated by a linear function in the form
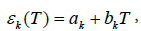 (11)
(11)
where the values of ak and bk are determined by the method of least squares and they are: ak = 0.056204; bk = 0.000453 tex‒1.
As seen from Figure 9, the straight line 3, constructed according to formula (11), describes the curve 2 with satisfactory accuracy. The value of critical strain εk, for cotton yarn with certain linear density is considered constant. For different values of linear density the values of εk are determined using formula (11).
Thus, the specific values of the parameters of functions E(ε)- EN, Ee, Em, ES, Ek,, εN, εe, εm, εS and εk (εN=0), for specific values of linear densities of cotton yarn T, are determined from equations (3) - (11). With known values of these parameters, according to the procedure given [8], the change in strain modulus for cotton yarn with specific linear density T, is approximated versus the values of longitudinal strain ε under yarn tension to breakage.
As was noted above, equations (3) - (11) are valid only for cotton yarn of a carded spinning system produced on a pneumo-mechanical spinning machine from medium-fiber cotton of the 1st grade, of the 1st group of maturity, of the 4th type of fiber [8]. For yarns obtained by other technological methods and from other types of cotton, the values of function parameters E(ε) and equations (3) - (11) should be re-established according to the results of experiments on stretching these yarns to breakage and from the results of their processing.
The physically nonlinear elastic-viscoplastic law (1) [8], describing the process of strain of cotton yarn to breakage, includes functional parameters ES(ε), ED(ε and μ(ε). The function of quasistatic change of cotton yarn strain modulus ES(ε) includes nine parameters EN, Ee, Em, ES, Ek,, εN, εe, εm, εS and εk. The values of these parameters are determined from equations (3) - (11). The function of dynamic strain modulus ED(ε) is determined through the relation ED(ε)=γ ES(ε). As stated in [8], value of γ , for cotton yarn varies from 1.1 to 4. The current value of γ , the function of viscosity parameter μ(ε) and the unloading function ER(ε) were determined from the relations proposed [8]. The unloading functions must be determined from the results of the corresponding experiments.
Thus, all functional parameters of the nonlinear law (1) and (2) become approximately known. This allows us to use the proposed law in applied problems of mechanics of yarns and in evaluating and predicting the strength of cotton yarn.
Conclusion
1. Based on the analysis of processing results of experiments on cotton yarn stretching, functional changes in the parameters of quasistatic modulus of yarn strain ES(ε) are determined versus the values of linear density of cotton yarn.
2. The proposed functional relationships describing the changes in parameters ES(ε) make it possible to determine the values of these parameters EN, Ee, Em, ES, Ek, εN, εe, εm, εS and εk depending on linear density of cotton yarn. This makes it possible to use the proposed nonlinear law of cotton yarn strain in applied problems of mechanics of textile yarns and threads.
3. Based on the proposed methods, it is possible to determine the functional parameters of the proposed nonlinear law for various types of yarns and textile threads and to assess the applicability of the proposed law under tension of these materials; this is a challenge for the future.
Funding
This work was funded by the Fund for Support of Fundamental Research of the Academy of Sciences of the Republic of Uzbekistan (FPFI AS RUz), Grants F.12-12 and F.9-14.
References
- Morton WE, Hearle JWS (2008) Physical properties of textile fibers. (4th Edtn), Woodhead Publishing Limited, UK.
- Shcherbakov VP (2013) Applied and structural mechanics of fibrous materials.
- Ilyushin AA (2004) Izbrannye trudy. Tom 2 (1946-1966) Plastichnost.
- Sultanov KS(1998)A non - linear law of the deformation of soft soils. J. Applied Mathematics and Mechanics 62: 465-472.
- Sultanov KS (2002)The Attenuation of Longitudinal Waves in Non - Linear Viscoelastic Media. J Appl Math Mech 66: 115-122.
- Bakhodirov AA, Ismailova SI, Sultanov KS (2015) Dynamic Deformation of the Contact Layer When there is Shear Interaction Between a Body and the Soil. J Appl Math Mech 79: 587-595.
- Ismailova SI, Sultanov KS (2015) Nonlinear Deformation Laws for Composite Threads in Extension. Mechanics of Solids 50: 578-590.
- Sultanov KS, Ismailova SI (2017) Physical Nonlinear Elastic - Viscoplastic Law of Strain of Cotton Yarn under Tension to Breakage. J Fashion Technology & Textile Engineering S: 3.