Spanish
  Chinese
  Russian
  German
  French
  Japanese
  Portuguese
  Hindi
Hindi Research Article, J Athl Enhanc Vol: 7 Issue: 3
Respiratory and Muscle Oxygenation Responses to Two Constant-Load Exercise Intensities
Oueslati F1,2,3*, Girard O4 and Ahmaidi S1
1Sport Sciences Department, University of Picardie Jules Verne, Amiens, France
2Centre de recherche de l’Institut universitaire de cardiologie et de pneumologie de Québec, Québec, Canada
3Faculty of Sciences, University of Carthage, Bizerte, Tunisia
4Institute of Sport Sciences, University of Lausanne (ISSUL), Lausanne, Switzerland
*Corresponding Author : Ferid Oueslati
Institut universitaire de cardiologie et de pneumologie de Québec, 2725 Ch Ste-Foy, G1V 4G5, Québec, Canada
Tel: (+1) 418-656-8711 #301
E-mail: oueslati.ferid@hotmail.com
Received: May 03, 2018 Accepted: May 30, 2018 Published: June 06, 2018
Citation: Oueslati F, Girard O, Ahmaidi S (2018) Respiratory and Muscle Oxygenation Responses to Two Constant-Load Exercise Intensities. J Athl Enhanc 7:3. doi: 10.4172/2324-9080.1000296
Abstract
Objective: We investigated the respiratory and vastus lateralis oxygenation responses to exhaustive, constant-load cycling at two exercise intensities.
Methods: Eight moderately-trained male randomly cycled to exhaustion at 75% and 85% of maximal work-load (CL75 and CL85, respectively) measured during a maximal incremental test. From continuous recordings of respiratory variables and near-infrared spectroscopy signals of the vastus lateralis muscle, VO2 slow component (SC) and deoxyhemoglobin (HHb) SC were calculated.
Results: At exhaustion, VO2 (+19 ± 25%), VO2 SC (+59 ± 24%) and minute ventilation (+14 ± 14%) were significantly higher during CL85 vs. CL75, whereas oxyhemoglobin (-67 ± 22%) and total hemoglobin (-36 ± 3%) responses were lower (all p<0.05). Additionally, VO2 SC during CL75 and CL85 were strongly correlated (r=0.88, p<0.001). The HHb SC did not differ between CL75 and CL85 (3.10 ± 0.75 vs. 3.44 ± 1.1 A.U, respectively; p=0.60). HHb SC and VO2 SC during CL85 (r=0.94, p<0.001), but not during CL75 (r=-0.08, p=0.90), were correlated. Finally, HHb SC during CL75 and CL85 were unrelated (r=-0.20, p=0.70).
Conclusion: Our results highlight that only the contribution of locomotor muscles to the VO2 SC magnitude is affected by the exercise intensity and not that of ventilation.
Keywords: Exercise; Ventilation; Deoxyhemoglobin; Cycling; VO2 slow component; Oxygen uptake; Muscle oxygenation
Introduction
During constant-load cycling, when the sustained power output remains below the work rate that stimulates the Gas-exchange Threshold (GET), VO2 initially rises exponentially to reach a steadystate condition within 2-3 min after the onset of exercise [1]. Above this exercise intensity, VO2 continues to rise to eventually reach a delayed steady-state above that predicted from lower power outputs or continues to rise until reaching exercise termination [2,3]. This has been termed the VO2 slow component (SC) phenomenon [1].
Major steps in understanding the VO2 SC origin during constantload exercise came from the development of the thermodilution technique, which allows muscle VO2 to be measured invasively while controlling for blood flow [4]. Using this technique, Poole et al. [5] have reported that ~86% of the VO2 relates to the work accomplished by the exercising legs. This result suggests a firm link in cycling between the occurrence of the VO2 SC phenomenon and local oxygenation trends of the active musculature (quadriceps muscles).
Despite decades of research, the VO2 SC underpinning mechanisms are not yet fully elucidated. Candidates include an increased muscle temperature [6], lactate and H+ accumulation [7] and/or recruitment of less efficient type II fibres in respiratory and locomotor muscles [8-10]. More recently, measurement of local oxygenation trends by means of Near-infrared Spectroscopy (NIRS) during constant-load cycling paved the way for the suggestion that Deoxyhemoglobin (HHb) kinetics in leg muscles relate to whole-body VO2 kinetics [11-14]. In support, through the deoxyhemoglobin responses, Marles et al. [14] and Oueslati et al. [15] have reported a significant relationship between an HHb SC of the vastus lateralis muscle and VO2 SC during high intensity constant-load cycling exercise.
Recently, Oueslati et al. [15] showed a significant correlation between the VO2 SC and the decline in maximal inspiratory and expiratory pressure during a constant-load exercise at 85% of maximal aerobic power. These results corroborate those of Cross et al. [16,17] showing that the VO2 SC is strongly related to respiratory muscle work during a constant-load exercise at a work rate roughly equal to 25% and 60% of the difference between the GET and VO2peak. Potential limitations of the aforementioned studies include unique exercise intensity being studied and the fact that exercise was not conduct until exhaustion. As VO2 SC is thought to be closely related to development of muscle fatigue (respiratory and locomotor) [2,18], constant-load cycling to exhaustion would represent a more appropriate exercise model to determine the nature of the relationship between VO2 SC, minute ventilation and oxygenation status (HHb SC) in the vastus lateralis muscle. To date, no direct (i.e., same participants) comparison exists examining the effects of different exercise intensities on the nature of these relationships during exhaustive, constant-load cycling.
Our intention was to investigate the respiratory and vastus lateralis oxygenation responses to constant-load cycling at two exercise intensities above the GET intensity (~60% VO2max). We hypothesized that, the magnitude of VO2 SC, ventilation and vastus lateralis muscle HHb SC would be greater at higher exercise intensities.
Materials and Methods
Participants
Eight young, moderately-trained male cyclists (mean ± SD: age 17 ± 2 years, body weight 65 ± 3 kg, height 1.73 ± 0.07 m) took part in this study. The participants and their parents were provided with the procedures and risks associated with participation in the study. Written informed consent was obtained from all participants (their parents for minors). All participants were non-smokers and free of heart and lung diseases and had normal resting pulmonary function, as assessed by spirometry tests. They declared cycling on average 300 km weekly for the past 4 years. This study was approved by the Ethics Committee of UHC Farhat-Hached Hospital. Participants were instructed not to engage in any physical activity and not to drink or eat any caffeinated meals on testing days.
Procedures
The participants visited the laboratory at three occasions, separated by at least 48 h, and at the same time of the day (± 2 h), while wearing shorts and t-shirts. During the first visit (Day 1) a maximal ramp cycling test was completed for the determination of GET, maximal oxygen uptake (VO2peak) and maximal power-output (Wpeak). During the second and third sessions (Days 2 and 3, respectively, conducted in randomized order) participants cycled at constant-load until exhaustion at exercise intensity corresponding to either 75% or 85% of Wpeak (CL75 and CL85, respectively). All tests were conducted under similar standard environmental conditions (ambient temperature ~22°C and ~40% relative humidity). All cycling was conducted on the same electromagnetically braked cycle ergometer (Excalibur Sport, Lode, The Netherlands), which was adjusted to each individual’s specifications and the feet securely strapped on the pedal.
Maximal ramp cycling test
After 2-min resting period (while seated on the bike) followed by 2- min warm up at 60 W (pedaling rate of 60-70 rpm), work rate increased continuously by 30 W.min-1 (pedaling rate of 90 ± 5 rpm) until participants reached exhaustion. The test was terminated by volitional cessation of exercise or failure to maintain a pedaling rate of at least 60 rpm for 5 s despite strong verbal encouragement.
Constant-load cycling test
After 2-min resting period (while seating on the bike) followed by 2-min warm up at 60 W (pedaling rate of 60-70 rpm), work rate was set to 75% (242 ± 26 W) or 85% (274 ± 29 W) of Wpeak (pedaling rate of 90 ± 5 rpm). Constant-work rate tests were performed until exhaustion using the same criteria as described above. Since our participants were highly familiarized with this type of effort, minimizing the day to day variability, each constant-load test was only performed once [19-22].
Data measurements
Pulmonary responses: Expired gases were collected by a mask enclosing both the mouth and nose and recorded by a breath by breath portable analyzer (Cosmed K4b2, Rome, Italy) to measure VO2, ventilation (VE), carbon dioxide production (VCO2), tidal volume, respiratory rate and partial pressure of end tidal carbon dioxide production (PETCO2). The gas analyzer and the pneumotachograph were calibrated prior to each test following manufacturer’s recommendations using a reference gas mixture (16% O2 and 5% CO2) and a 3 l syringe (Cosmed, Rome, Italy), respectively. During the ramp test, heart rate was continuously measured with a chest strap polar device (RS. 300, Polar Electro, Kempele, Finland).
Near-infrared spectroscopy responses (NIRS): On days 2 and 3, uninterrupted measurements of vastus lateralis muscle oxygenation trends were obtained during constant-load cycling via NIRS (Portamon, Artinis, Medical System, Zetten, The Netherlands). An emitter-detector pair was placed in the same position between visits, on the distal part of the right vastus lateralis (approximately 15 cm above the proximal border of the patella). The probe was fixed with a black, plastic spacer held in place via double-sided tape to reduce the intrusion of extraneous light. Skinfolds were measured at the location of the probe using a Harpenden caliper (Baty International, West Sussex, United kingdom) to ensure that skin fold was lower than 1.5 cm, as recommended to avoid signal alterations [23,24].
Data analysis
Maximal ramp cycling test: Data from the maximal ramp cycling test were averaged into 30-s intervals for further analysis. The GET was determined using the criteria of a disproportionate increase in VCO2 in reference to VO2 [25]; i.e. , a first departure from the linear increase in VE and an increase in VE/VO2 with no concomitant increase in VE/VCO2. Each VCO2/VO2 relationship was printed and analyzed by three experienced exercise physiologists (random-order and blind conditions). Values were retained when at least two of them agreed on GET assessment (8 values were retained). The VO2peak was calculated as the highest averaged VO2 value over 30 s.
Constant-load cycling test: VO2 responses, For the two constantload tests, time to exhaustion (TTE) was determined (in s) and assigned the value 100% for the ease of between-tests comparisons. Breath-by-breath VO2 values were averaged into a sliding interval of 30 s. All respiratory variables were expressed at rest, 20%, 40%, 60%, 80% and 100% of TTE (averaged values over a period of 30 s prior to each time point of interest).
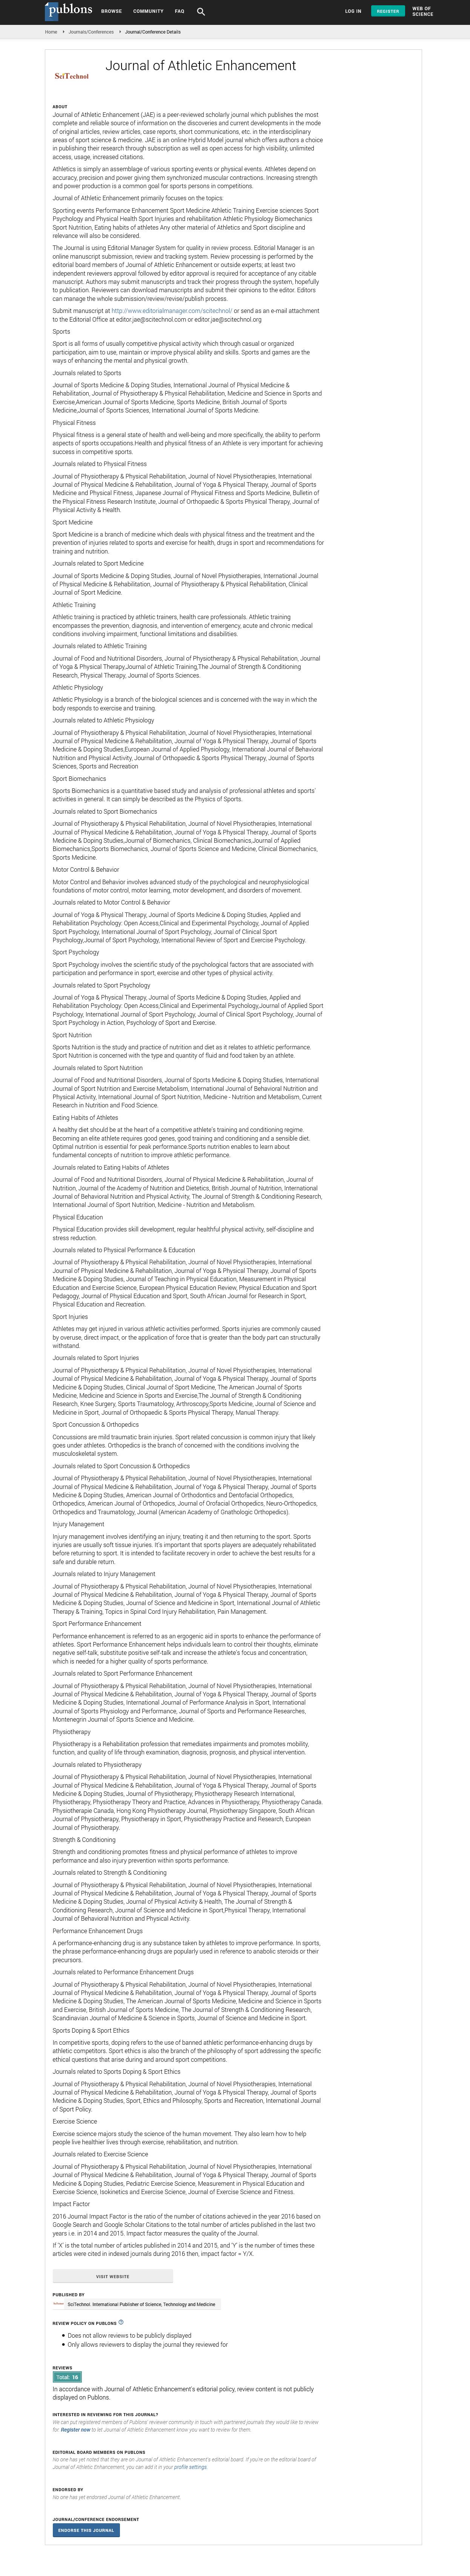
In line with previous studies, data corresponding to the first 20 s after the onset of exercise were excluded from analysis [14,26,27]. A biexponential model was used to characterize changes in VO2 over time during constant-load cycling allowing the VO2 SC amplitude to be quantified (Figure 1):

Figure 1: Typical example of the oxygen uptake kinetics during a constant-load exercise above the gas exchange threshold for a representative participant. A1 and A2 are the asymptotic values for the exponential curves of the phase II and phase III, respectively; and are the time constants defined as the time to reach 63% of the amplitude of A1 and A2, respectively; td1 and td2 are the delays for phase II and phase III.
where (t) is the time; VO2 base is the unloaded cycling baseline value; A1 and A2 are the asymptotic values for the exponential curves of the phase II and phase III, respectively; are the time constants defined as the duration of time to reach 63% of the amplitude of A1 and A2, respectively; td1 and td2 are the delays for phase II and phase III, respectively. U1=0 when t ≤ td1 or U1=1 when t ≥ td1 and U2=0 when t ≤ td2 or U2=1 when t ≥ td2.
The amplitude of the VO2 SC represents the difference in VO2 at the end of phases II and at exhaustion.
Near-infrared spectroscopy
A modified form of the Beer-Lambert Law was used to calculate micromolar changes in tissue deoxyhemoglobin (HHb), oxyhemoglobin (O2Hb) and total hemoglobin (tHb) across time using received optical densities from two continuous wavelengths of NIRS light (760 and 850 nm). The oxygen tissue saturation index (TSI, expressed in %), which reflects the dynamic balance between O2 supply and O2 consumption, was calculated as [HbO2]/([HbO2] + [HHb]) × 100 [28]. NIRS data were acquired at 1 Hz.
NIRS data were averaged into a 30-s sliding interval and normalized to express the magnitude of changes from the resting period (arbitrarily defined as 0 μM) [21].
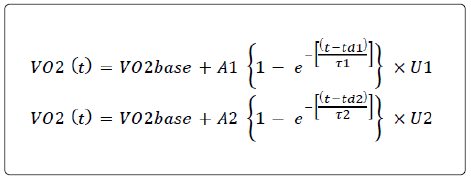
Additionally, the HHb data were fitted from 20 s after the onset of the exercise with a bi-exponential model of the form [14]:
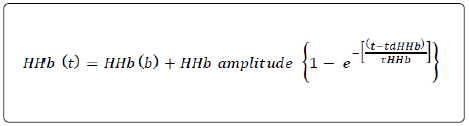
where HHb(b) is the baseline measured at rest, HHb amplitude is the asymptotic amplitude for the exponential curve, is the time constant and td HHb is the time delay. Also, the HHb SC was expressed as the difference between HHb maximum value and HHb amplitude (Figure 2) [14]. Similar to respiratory variables, NIRSrelated parameters (HHb, O2Hb, tHb and TSI) were calculated at rest and at 20%, 40%, 60%, 80% and 100% of TTE (averaged values over 30 s prior each time point of interest). To study the relationship between VE and tHb, the difference in VE (Δ VE) and tHb (ΔtHb) between CL85 and CL75 was assessed.

Figure 2: Typical example of deoxyhemoglobin responses during the constant-load exercise above the gas exchange threshold for a representative participant. HHb amplitude is the asymptotic amplitude for the exponential curve, τHHb is the time constant and td HHb is the time delay.
Finally, to further investigate limiting factors of constant-load cycling, respiratory and NIRS data were also determined during CL75 for an exercise duration corresponding to TTE during CL85 (iso-time CL85).
Statistical analysis
Descriptive statistics (mean, standard devia tion) were calculated for all variables. Data were processed using SigmaPlot (version 11, Systat software, Germany). A non-parametric ANOVA of Friedman was used to compare physiological data. Relationships between different parameters were investigated using the Spearman correlation coefficient. The threshold for statistical significance was set at p<0.05.
Results
Maximal ramp cycling test
The mean VO2peak and Wpeak were 3.64 ± 0.35 4 ml.min-1 and 322 ± 35 W, respectively. The GET was observed at 191 ± 10 W (59 ± 5% of Wpeak) and corresponded to a VO2 of 2.25 ± 0.38 l.min-1 (73 ± 6% of VO2peak). Maximal heart rate and respiratory exchange ratio were 189 ± 5 beats.min-1 and 1.30 ± 0.10, respectively.
Constant-load cycling exercise
Compared to CL75 (567 ± 177 s), TTE was shorter during CL85 (303 ± 87 s) (p<0.05).
Pulmonary responses: The kinetics of the main pulmonary data are given in Figure 3: tidal volume, VE and VO2 but not respiratory rate, were significantly higher during CL85 compared to CL75 (p<0.05). At exhaustion, PETCO2 was higher during CL85 vs. CL75 (38 ± 4 vs. 33 ± 3 mmHg, p<0.05).

Figure 3: (A) Minute ventilation, (B) rate of oxygen uptake, (C) tidal volume and (D) respiratory rate kinetics at rest and during the constant-load exercise at 75% (CL75) and 85% (CL85) of maximal work-load. Values are means±SD. *, p<0.05 different between conditions. $ and # p<0.05 different between two successive time points during CL75 and CL85, respectively.
Whereas baseline VO2 and VO2 of phase II did not differ, VO2 at exhaustion (end phase III) was ~9% higher in CL85 vs. CL75 (Table 1). Greater VO2 SC amplitudes occurred during CL85 (Table 1). Amplitudes of VO2 SC during CL75 and CL85 were positively correlated (r=0.88, p<0.001).
| CL75 | CL85 | |
|---|---|---|
| Baseline V̇O2 (l.min-1) | 0.41 ± 0.21 | 0.46 ± 0.09 |
| V̇O2 of phase II (l.min-1) | 2.94 ± 0.35 | 2.93 ± 0.28 |
| V̇O2 of phase III (l.min-1) | 3.39 ± 0.43 | 3.63 ± 0.33* |
| V̇O2 slow component (l.min-1) | 0.44 ± 0.14 | 0.70 ± 0.22* |
| V̇E of phase II (l.min-1) | 98.7 ± 18.7 | 89.0 ± 17.9 |
| V̇E of phase III (l.min-1) | 123.1 ± 7.1 | 140.8 ± 10.9* |
| V̇E between phases II and III (l.min-1) | 25.6 ± 17.2 | 51.8 ± 18.0* |
| V̇O2; oxygen uptake, V̇E; minute ventilation. |
Table 1: Respiratory responses fitted with a bi-exponential curve during the constant-load cycling at 75% (CL75) and 85% (CL85) of maximal work-load. Values are means ± SD. *, p<0.05, different between conditions.
Near-infrared spectroscopy
Mean values of the NIRS parameters during CL75 and CL85 are shown in Figure 4. Compared to CL75, O2Hb and tHb values were lower (-67 ± 22% and -36 ± 3%, respectively, p<0.05) during CL85, whereas no difference between conditions occurred for HHb and TSI values.

Figure 4: (A) Oxyhemoglobin (O2Hb), (B) deoxyhemoglobin (HHb), (C) total hemoglobin (tHb) and (D) tissue oxygen saturation (TSI) kinetics at rest and during the constant-load exercise at 75% (CL75) and 85% (CL85) of maximal work-load. Values are means ± SD. *, p<0.05 different between conditions. $ and # p<0.05, different between two successive time points during CL75 and CL85, respectively.
The HHb responses fitted with a bi-exponential curve are given in Table 2. No differences for HHb related-parameters were observed between the two conditions. The HHb SC during CL75 and CL85 did not correlate significantly (r=-0.20, p=0.7).
| CL75 | CL85 | |
|---|---|---|
| Baseline HHb (µM) | -0.58 ± 1.55 | -0.08 ± 1.37 |
| HHb of phase II (A.U) | 10.54 ± 3.76 | 10.54 ± 5.09 |
| HHb of phase III (A.U) | 13.81 ± 4.26 | 13.97 ± 4.89 |
| HHb slow component (A.U) | 3.10 ± 0.75 | 3.44 ± 1.10 |
| HHb slow component (%) | 21 ± 5 | 24 ± 12 |
| HHb, deoxyhemoglobin |
Table 2: Deoxyhemoglobin (HHb) responses fitted with a biexponential curve during the constant-load cycling at 75% (CL75) and 85% (CL85) of maximal work-load. Values are means ± SD.
Relationship between pulmonary and local oxygenation responses
The VO2 SC was correlated significantly with the HHb SC during CL85 (r=0.94, p<0.001) but not during CL75 (r=-0.08, p=0.9). No significant correlation occurred between the ΔVE and ΔtHb at exhaustion (r=-0.60, p=0.1).
Isotime comparisons
Compared to data measured at exhaustion during CL85 (100% of TTE), VO2 and VE values were significantly lower (-12 ± 13% and -13 ± 11%; all p<0.05) at isotime CL75, whereas the tHb and O2Hb values were significantly higher (Table 3).
| CL85 at exhaustion | CL75 at isotime CL85 | CL75 at exhaustion | |
|---|---|---|---|
| V̇O2 (l.min-1) | 3.63 ± 0.33* | 3.23 ± 0.20 | 3.12 ± 0.45 |
| V̇E (l.min-1) | 140 ± 10* | 124 ± 13 | 123 ± 7 |
| HHb (A.U) | 14.0 ± 3.9 | 13.4 ± 5.3 | 14.0 ± 4.8 |
| O2Hb (A.U) | -20.2 ± 3.6* | -13.3 ± 3.2 | -13.0 ± 4.3 |
| tHb (A.U) | -5.7 ± 3.5* | 0.1 ± 5.1 | 0.9 ± 4.7 |
| TSI (%) | 63 ± 11 | 60 ± 5 | 60 ± 4 |
Table 3: Respiratory and NIRS data at exhaustion during the constant-load cycling at 75% (CL75 at exhaustion) and 85% of maximal work-load (CL85 at exhaustion) and during CL75 at an exercise duration corresponding to exhaustion during CL85 (CL75 at isotime CL85). Values are means ± SD. *p<0.05, CL85 at exhaustion different from the other two conditions.
Discussion
Our intention was to investigate the effect of exercising at two different intensities (75% vs. 85% of Wpeak) during constant-load cycling to exhaustion on the relationships between vastus lateralis oxygenation, ventilation and VO2 SC. As expected, higher respiratory and metabolic loads occurred for CL85 vs. CL75 when comparisons were made at absolute relative (% of TTE) time points. Our principal original findings were that i) vastus lateralis HHb SC did not differ between conditions, despite larger amplitude of the VO2 SC when exercising at a higher exercise intensity; and ii) HHb SC and VO2 SC were correlated during CL85 but not CL75.
VO2 slow component
The magnitude of VO2 SC amplitude values during CL75 and CL85 (0.44 ± 0.14 and 0.73 ± 0.22 l.min-1, respectively) corroborates previous findings obtained at similar relative exercise intensities (i.e., 0.22 l.min-1 at 75% of Wpeak [29]; 0.65-0.67 l.min-1 at 80% of VO2max [20,30]; 0.88 l.min-1 at 85% of Wpeak). Also in line with previous studies, higher exercise intensity led to greater values for ventilation, VO2 and therefore the amplitude of the VO2 SC [31-33]. An important finding of our study was also that amplitude of VO2 SC during CL75 and CL85 were significantly correlated (r= 0.88, p<0.001). At exercise intensities above GET, the VO2 SC can be traced to common fatigue manifestations associated with an increase in active muscles work: increase in muscle temperature, lactate and hydrogen accumulation, preferential recruitment of type IIa fibers as well as decreased ATPsynthase and/or of mechanical efficiency [8,10,32,33]. Despite the same mechanistic basis the respective contribution of the aforementioned mechanisms, in turn influencing VO2 SC amplitude, likely differs with exercise intensity, but could not be fully ascertained with present methodology.
HHb slow component
In the first time, vastus lateralis muscle oxygenation was recorded by means of NIRS to investigate the effect of exercise intensity on local oxygenation during two different cycling intensities. Our results show that HHb increased exponentially (from the onset to 20% TTE), reflecting an increased extraction of O2 as a consequence of an increase in muscle VO2 muscle [13]. HHb then continued to rise slowly yet progressively (the HHb SC) but similarly in both conditions (75 vs. 85% Wpeak) until exhaustion. Marles et al. [14] observed an amplitude of 14 ± 5 A.U for HHb SC during a constant-load cycling exercise at an intensity corresponding to a power output half-way between the GET and VO2max. Additionally, we report that amplitudes of HHb and VO2 SC during CL85 were correlated (r= 0.94, p<0.05). This observation is in accordance with the literature supporting a locomotor muscle origin of the VO2 SC [5,32,34]. However, the lack of significant difference for the HHb SC between CL75 and CL85 would indicate that the contribution of locomotor muscles in VO2 SC occurrence is likely affected by the exercise intensity. Additionally, the origin of VO2 SC can be localized in the respiratory muscles especially when the exercise intensity is above 85% of VO2max [16,17,20,35]. That said, as respiratory muscles are skeletal muscles, all the aforementioned potential ‘peripheral’ could also play a role in the respiratory hypothesis.
Ventilatory and total hemoglobin responses
In our study, differences in VE between the two constant-load exercise intensities were primarily related to changes in tidal volume (from 60% to 100% of TTE, p<0.05), as the respiratory rate did not differ (p>0.05). It has been reported that CO2 production increases the cerebral oxygenation and activity [36] and in turn raises VE. In support, it can be suggested that the larger increase in tidal volume during CL85 compared to CL75 is closely related to the cerebral stimulation due to the higher PETCO2 (at 80% and 100% of TTE, p<0.05). Future studies measuring brain oxygenation status are needed to verify this assumption. Compared to CL75, we further demonstrated that CL85 was associated with lower tHb values throughout the exercise. It is well documented that VE increase enhances sympathetic vasoconstrictor activity via respiratory muscle metaboreflex and therefore decreases regional blood volume (i.e., tHb) [37]. In our study frame, however, the effect of VE on blood flow distribution cannot be ascertained due to a lack of significant correlation observed between ΔVE and ΔtHb (r=-0.60, p=0.1).
Isotime comparisons
Previous studies have proposed that the exercise-induced increase in VE with exercise intensity could induce respiratory muscle fatigue, influencing exercise tolerance via activation of the metaboreflex [38,39]. Specifically, it has been demonstrated that the decreased blood flow in exercising legs is caused by an increase in ventilatory work [40,41]. With this in mind, we made the interesting observations that VE and VO2 were higher and tHb lower at the end of CL85 compared to the same absolute exercise time during CL75 (after ~300 s of pedaling or 55% of TTE). Pending confirmatory research, it seems plausible that the increase in VE (the difference between the end of CL85 and the same absolute exercise time during CL75) could limit exercise tolerance via a reduction of legs blood flow (i.e., tHb).
Limitations
A limitation of the current study is that the concentration changes in O2Hb and tHb as measured with NIRS only reflect the balance between O2 delivery and O2 extraction and not the actual muscle VO2 that cannot be quantified using the present methodology. Furthermore, blood volume measurement was not performed in respiratory muscles to confirm the occurrence of respiratory muscle metaboreflex activation and blood flow redistribution between respiratory and locomotor muscles [42]. Another limitation was our small sample size. Finally, the reader should be cognizant to the fact that present experiments were conducted with young moderatelytrained cyclists, who notably presented specific cardiopulmonary characteristics (i.e., greater respiratory work at exhaustion) compared to middle-aged cyclists [43,44]. Our results may not be extrapolated to other athletic populations.
Conclusion
In conclusion, sustained 85% of Wpeak compared to 75% Wpeak is associated with higher respiratory responses and larger VO2 SC amplitudes. Unique to this study was that HHb SC amplitudes were similar between the two exercise intensities. Furthermore, HHb SC and VO2 SC were correlated during CL85 but not CL75. Altogether, our results highlight that the contribution of locomotor muscles to the VO2 SC magnitude is affected by the exercise intensity.
Acknowledgments
We thank our cyclists for their enthusiastic participation. We dedicate this paper to the Tunisian Cycling Federation.
Ethical Approval
All procedures performed in studies involving human participants were in accordance with the ethical standards of the institutional and/or national research committee and with the 1964 Helsinki declaration and its later amendments or comparable ethical standards.
Informed Consent
Informed consent was obtained from all individual participants included in the study.
References
- Whipp BJ, Wasserman K (1972) Oxygen uptake kinetics for various intensities of constant-load work. J Appl Physiol 33: 351-356.
- Xu F, Rhodes EC (1999) Oxygen uptake kinetics during exercise. Sports Med Auckl NZ 27: 313-327.
- Jones AM, Vanhatalo A, Burnley M, Morton RH, Poole DC (2010) Critical power: implications for determination of V˙O2max and exercise tolerance. Med Sci Sports Exerc 42: 1876-1890.
- Andersen P, Saltin B (1985) Maximal perfusion of skeletal muscle in man. J Physiol 366: 233-249.
- Poole DC, Schaffartzik W, Knight DR, Derion T, Kennedy B, et al. (1991) Contribution of exercising legs to the slow component of oxygen uptake kinetics in humans. J Appl Physiol 71: 1245-1260.
- MacDougall JD, Reddan WG, Layton CR, Dempsey JA (1974) Effects of metabolic hyperthermia on performance during heavy prolonged exercise. J Appl Physiol 36: 538-544.
- Stringer W, Wasserman K, Casaburi R, Pórszász J, Maehara K, et al. (1994) Lactic acidosis as a facilitator of oxyhemoglobin dissociation during exercise. J Appl Physiol 76: 1462-1467.
- Grassi B, Rossiter HB, Zoladz JA (2015) Skeletal muscle fatigue and decreased efficiency: two sides of the same coin? Exerc Sport Sci Rev 43: 75-83.
- Krustrup P, Söderlund K, Mohr M, Bangsbo J (2004) The slow component of oxygen uptake during intense, sub-maximal exercise in man is associated with additional fibre recruitment. Pflüg Arch Eur J Physiol 447: 855-866.
- Zoladz JA, Grassi B, Majerczak J, Szkutnik Z, Korostyński M, et al. (2014) Mechanisms responsible for the acceleration of pulmonary V̇O2 on-kinetics in humans after prolonged endurance training. Am J Physiol Regul Integr Comp Physiol 307: 1101-1114.
- DeLorey DS, Kowalchuk JM, Paterson DH (2005) Adaptation of pulmonary O2 uptake kinetics and muscle deoxygenation at the onset of heavy-intensity exercise in young and older adults. J Appl Physiol 98: 1697-1704.
- DeLorey DS, Kowalchuk JM, Paterson DH (2004) Effects of prior heavy-intensity exercise on pulmonary O2 uptake and muscle deoxygenation kinetics in young and older adult humans. J Appl Physiol Bethesda Md 1985 97: 998-1005.
- DeLorey DS, Kowalchuk JM, Paterson DH (2003) Relationship between pulmonary O2 uptake kinetics and muscle deoxygenation during moderate-intensity exercise. J Appl Physiol Bethesda Md 1985 95: 113-120.
- Marles A, Perrey S, Legrand R, Blondel N, Delangles A, et al. (2007) Effect of prior heavy exercise on muscle deoxygenation kinetics at the onset of subsequent heavy exercise. Eur J Appl Physiol 99: 677–684.
- Oueslati F, Boone J, Tabka Z, Ahmaidi S (2017) Respiratory and locomotor muscle implications on the VO2 slow component and the VO2 excess in young trained cyclists. Respir Physiol Neurobiol 239: 1-9.
- Cross TJ, Winters C, Sheel AW, Sabapathy S (2014) Respiratory muscle power and the slow component of O2 uptake. Med Sci Sports Exerc 46: 1797-1807.
- Cross TJ, Sabapathy S, Schneider DA, Haseler LJ (2010) Breathing He-O2 attenuates the slow component of O2 uptake kinetics during exercise performed above the respiratory compensation threshold. Exp Physiol 95: 172-183.
- Turner AP, Cathcart AJ, Parker ME, Butterworth C, Wilson J, et al. (2006) Oxygen uptake and muscle desaturation kinetics during intermittent cycling. Med Sci Sports Exerc 38: 492-503.
- Perrey S, Candau R, Millet GY, Borrani F, Rouillon JD (2002) Decrease in oxygen uptake at the end of a high-intensity submaximal running in humans. Int J Sports Med 23: 298-304.
- Carra J, Candau R, Keslacy S, Giolbas F, Borrani F, et al. (2003) Addition of inspiratory resistance increases the amplitude of the slow component of O2 uptake kinetics. J Appl Physiol 94: 2448-2455.
- Keramidas ME, Kounalakis SN, Eiken O, Mekjavic IB (2011) Muscle and cerebral oxygenation during exercise performance after short-term respiratory work. Respir Physiol Neurobiol 175: 247-254.
- Oueslati F, Boone J, Ahmaidi S (2016) Respiratory muscle endurance, oxygen saturation index in vastus lateralis and performance during heavy exercise. Respir Physiol Neurobiol 227: 41-47.
- Leung TS, Wittekind A, Binzoni T, Beneke R, Cooper CE, et al. (2010) Muscle oxygen saturation measured using “cyclic NIR signals” during exercise. Adv Exp Med Biol 662: 183-189.
- McCully KK, Hamaoka T (2000) Near-infrared spectroscopy: what can it tell us about oxygen saturation in skeletal muscle? Exerc Sport Sci Rev 28: 123-127.
- Beaver WL, Wasserman K, Whipp BJ (1986) A new method for detecting anaerobic threshold by gas exchange. J Appl Physiol 60: 2020-2027.
- Whipp BJ, Ward SA, Lamarra N, Davis JA, Wasserman K (1982) Parameters of ventilatory and gas exchange dynamics during exercise. J Appl Physiol 52: 1506-1513.
- Bailey SJ, Romer LM, Kelly J, Wilkerson DP, DiMenna FJ, et al. (2010) Inspiratory muscle training enhances pulmonary O(2) uptake kinetics and high-intensity exercise tolerance in humans. J Appl Physiol 109: 457-468.
- Wolf M, Ferrari M, Quaresima V (2007) Progress of near-infrared spectroscopy and topography for brain and muscle clinical applications. J Biomed Opt 12: 062104.
- Engelen M, Porszasz J, Riley M, Wasserman K, Maehara K, et al. (1996) Effects of hypoxic hypoxia on O2 uptake and heart rate kinetics during heavy exercise. J Appl Physiol 81: 2500-2508.
- Bailey SJ, Vanhatalo A, Wilkerson DP, Dimenna FJ, Jones AM (2009) Optimizing the “priming” effect: influence of prior exercise intensity and recovery duration on O2 uptake kinetics and severe-intensity exercise tolerance. J Appl Physiol 107: 1743-1756.
- Poole DC, Ward SA, Gardner GW, Whipp BJ (1988) Metabolic and respiratory profile of the upper limit for prolonged exercise in man. Ergonomics 31: 1265-1279.
- Jones AM, Grassi B, Christensen PM, Krustrup P, Bangsbo J, et al. (2011) Slow component of VO2 kinetics: mechanistic bases and practical applications. Med Sci Sports Exerc 43: 2046-2062.
- Poole DC, Jones AM (2012) Oxygen uptake kinetics. Compr Physiol 2: 933-996.
- Cannon DT, White AC, Andriano MF, Kolkhorst FW, Rossiter HB (2011) Skeletal muscle fatigue precedes the slow component of oxygen uptake kinetics during exercise in humans. J Physiol 589: 727-739.
- Cross TJ, Morris NR, Haseler LJ, Schneider DA, Sabapathy S (2010) The influence of breathing mechanics on the development of the slow component of O2 uptake. Respir Physiol Neurobiol 173: 125-131.
- Nielsen HB, Boesen M, Secher NH (2001) Near-infrared spectroscopy determined brain and muscle oxygenation during exercise with normal and resistive breathing. Acta Physiol Scand 171: 63-70.
- Dempsey JA, Romer L, Rodman J, Miller J, Smith C (2006) Consequences of exercise-induced respiratory muscle work. Respir Physiol Neurobiol 151: 242-250.
- Romer LM, Polkey MI (2008) Exercise-induced respiratory muscle fatigue: implications for performance. J Appl Physiol 104: 879-888.
- Romer LM, Dempsey JA (2014) Work of Breathing During Exercise: Implications for Performance. In: Aliverti A, Pedotti A (eds) Mech. Breath. Springer Milan pp: 11-24
- Vogiatzis I, Athanasopoulos D, Habazettl H, Kuebler WM, Wagner H, et al. (2009) Intercostal muscle blood flow limitation in athletes during maximal exercise. J Physiol 587: 3665-3677.
- Katayama K, Iwamoto E, Ishida K, Koike T, Saito M (2012) Inspiratory muscle fatigue increases sympathetic vasomotor outflow and blood pressure during submaximal exercise. Am J Physiol Regul Integr Comp Physiol 302: 1167-1175.
- Guenette JA, Vogiatzis I, Zakynthinos S, Athanasopoulos D, Koskolou M, et al. (2008) Human respiratory muscle blood flow measured by near-infrared spectroscopy and indocyanine green. J Appl Physiol 104: 1202-1210.
- Tolep K, Kelsen SG (1993) Effect of aging on respiratory skeletal muscles. Clin Chest Med 14: 363-378.
- Fawkner S, Armstrong N (2003) Oxygen uptake kinetic response to exercise in children. Sports Med Auckl NZ 33: 651-669.