Review Article, J Nucl Ene Sci Power Generat Technol Vol: 11 Issue: 6
A Review Paper on Coal Power Generation
Niladri Sekhar Roy1*, Amit Kumar Sharma2 and Durgesh Wadhwa3
1Department of Physics, Faculty of Science, SGT University, Gurugram, Haryana, Tunsia, India
2Department of Electrical and Electronic Engineering, Teerthanker Mahaveer University, Uttar Pradesh, India
3Department of Electrical and Electronic Engineering, Sanskriti University, Mathura, Uttar Pradesh, India
*Corresponding Author:Niladri Sekhar RoyDepartment of Physics,Faculty of Science, SGT University, Gurugram, Haryana, Tunsia,India; E-mail:niladri_fosc@sgtuniversity.org
Received date: 09 February, 2022, Manuscript No. JNPGT-22-47036; Editor assigned date: 11 February, 2022, PreQC No. JNPGT-22-47036 (PQ); Reviewed date: 25 February, 2022, QC No. JNPGT-22-47036; Revised date: 13 April 2022, Manuscript No. JNPGT-22-47036 (R); Published date: 02 May 2022, DOI: 10.4172/2325-9809.1000290
Citation: Niladri SR, Amit KS, Durgesh W (2022) A Review Paper on Coal Power Generation. J Nucl Ene Sci Power Generat Technol 11:6.
Abstract
A fossil fuel generating facility, sometimes referred to as a manufacturing company, is a kind of steam turbine that generates electricity by burning coal. India intends to significantly reduce its reliance on coal in its energy generating mix as part of a larger effort to increase power output from cleaner sources and reduce emissions. Coal generation is a major source of GHG and hazardous airborne pollutants across the world. The author offer a distinct database of methane, CO2, sulphur dioxide etc, From 7,861 coal-fired power plants and their supply networks. Many countries have the highest total GHG and hazardous chemical emissions (more than 64% per pollutant). The overall supply chain impact is less than 19%, whereas individual pieces and toxins contribute more than 75%. Methane emissions from deep coal mining cancel out the efficient benefits of Chinese coal power plants over India. Due to a scarcity of adequate exhaust gases procedures in India and parts of East and South Eastern Europe, as well as substantial fossil electricity production in China, the illness implications are the worst.
Keywords: Coal; Flue gas; Generation; GHG (Greenhouse Gas); Power
Introduction
CO2, and also airborne particulates (PM2.5) and its meteorological predecessors, are released into the air when coal is burned. CO2 causes climate change, while PM2.5 may induce ischaemic cardiac diseases in adults, obstructive [1] pulmonary sickness (bronchitis in youngsters, respiratory diseases in grownups, and lung inflammatory diseases in youth. Furthermore, acid rain can be caused by airborne SO2 from gasoline sulphur [2]. NOx emissions are harmful and cause global warming and degradation of the land. Finally, coal combustion releases mercury into the atmosphere. Reducing the effects of these pollutants is a worldwide concern, but rising industrialisation, particularly in China and India, risks exacerbating the problem [3].
Coal combustion processes must improve throughout the transition to renewable, friendlier products by focusing on the sources of pollutant consequences. Due to a scarcity of spatial clarity, supply management breadth, and geographically based evaluation of healthcare effects, research models seem to be failed to find the highest efficient plant-level countermeasures. As a consequence, there really is a strong use of a worldwide program that involves business standards and source management aspects to every hydroelectric plant, allowing for the formulation of precise strategic judgment making for the minimization of health and environmental hazards [4].
Literature Review
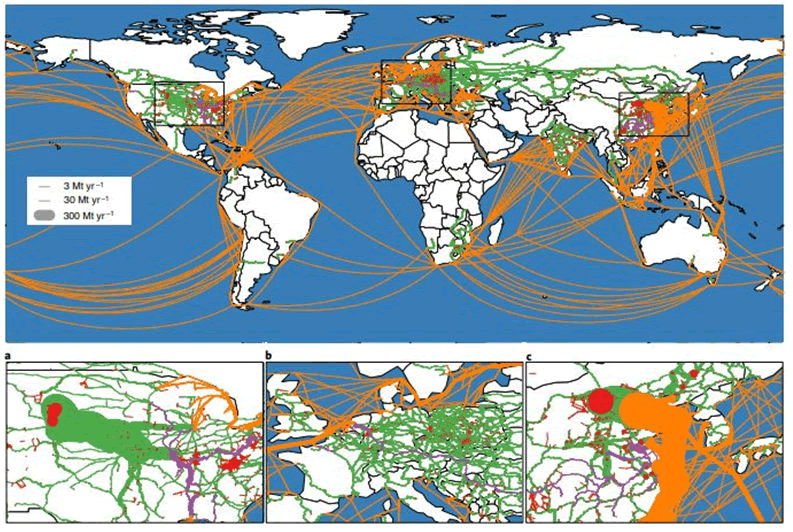
Global emissions and fuel supplyEmissions from fuel power generation are affected by fuel quality and combustion dynamics. As a result, we first use a transport model to relate the coal quality associated with specific coalmines to power plants. Figure 1 shows the modelled coal transport.
Coal is also produced in considerable quantities in different countries. Mining activities contribute considerably to overall GHG emissions and NOx emissions (9%) from coal power production. Uncontained coal fires produce additional emissions, but accurate statistics on these are unavailable and so are not included [5].
The worldwide commerce of coal combustion is primarily responsible for coal transport. In contrast, lignite is of inferior grade and hence rarely traded on a global scale. Because China is the world's greatest user of coal (39 wt %), majority of the transit occurs within China, with 80% via rail, 13% by barge, and 7% by truck. Northern coalmines exporting are the most common modes of Chinese coal transport [6].
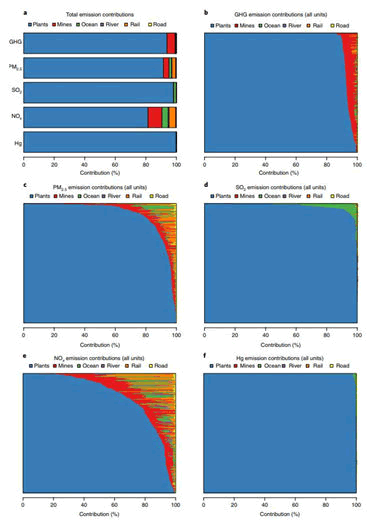
Long-distance travel through medium-distance transit by rail account for the majority of transportation emissions. The ships primarily contribute to total NOx, SO2 and PM2.5 emissions through the burning of fuel oils for operation. Burning is primary source of significant NOx and PM2.5 pollutants from rail transport, which contribute 4.5% and 2.6%. These are only likely to have a small influence on overall outcomes. Coal power stations are the primary source of emissions into the atmosphere of the five key. This is related to fuel components, but also to complicated burning processes and flue gas treatment [7].
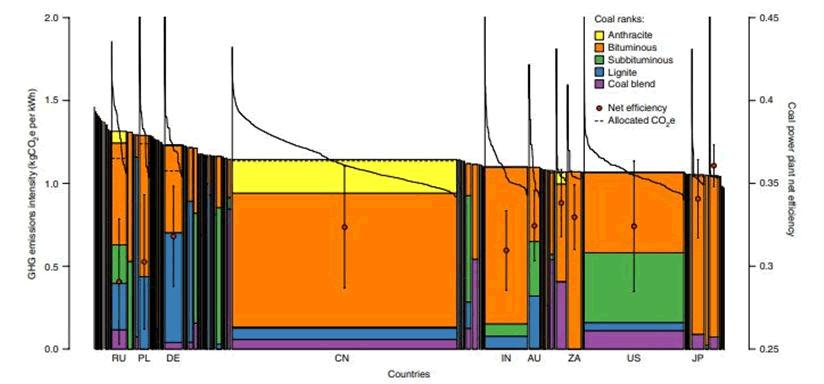
Variability of GHG emissionsThe major variations in GHG emissions per net generation of energy, including transportation and mining. Whereas a gross production weighed confidence interval of 0.06 kg CO2 ekWh1, the average cradle-to-gate pollution concentrations each country were clustered in a narrow range from surrounding century worldwide average of 1.13 kg e of Carbon Dioxide Equivalents (CO2e) discharges kWh1. Owing to the existence of highly effective and also polluted plants in the rest of the economies, century degrees of separation within particular diesel generators are much greater compared all governments, with a worldwide mean of 0.14 kg CO2 ekWh1. Figure 2 shows the fuel power supply [8].
The latter should be prioritised for reducing GHG emissions per kWh of power. Total electric efficiency; explain a portion of the GHG emissions per power generation. As high GHG emission intensity correspond with poor efficiencies in many situations, these are anti-correlated, r=0.89. This efficiency are especially poor for coal burning, which is why nations with higher lignite proportions. Germany and Russia, on the other hand, account for a sizable part of coal-fired integrated heating and electricity generation. Because of the enormous quantity of US coal power generation. Figure 3 shows the GHG discharge from coal power plant.
The total productivity of combustion of coal is proportional to the age of the facility. Because to the stronger average net energy efficiency, older power stations produce 11% of net coal energy and have lower average pollutant sensitivity than fresh systems. Power stations constructed between 1970 and 2000 have similar tangible gross energy efficiency. Since 2000, an emerging innovation in coal power plants has emerged. The construction of massive, extremely efficient extremely and super-duper nuclear fired generating facilities in China and India has resulted in steady reductions in GHG production. Nevertheless, coals that are less effective are still used in many parts of the globe. The properties of coal have a major effect on pollutants. Thus, coal burning produces seven% more Carbon di-oxide per kWh than bituminous coal combustion.
Absolute terms while consumption of other coal grades has more than quadrupled. The type of mining technology used is another influence in GHG emissions. Although raising efficiency and a comparable coal use mix, the absorption edge every kWh of power in Chinese and Indian is reduced, because underground mining emits more methane overall. Therefore, the average Chinese mining emissions are 0.08 kg CO2 ekWh1, compared to 0.02-kg CO2 ekWh1 in India. Efficiency improvements are one such approach, with possible improvements of up to 15% at particular facilities, but at a significant cost [9].
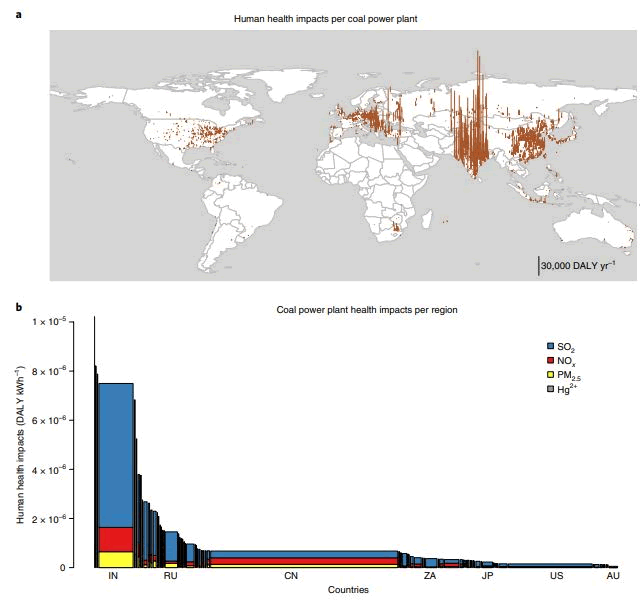
Non-GHG emissions and health impactsIn contrast to the worldwide impacts of GHG emissions, the health consequences of primary emissions are largely reliant on the site of the emission. As a result, one of the dominant criteria determining absolute health impacts is the local population density near the source of emission. SO2 (6.1 MDALY yr1) contributes much more than NOx (1.7 MDALY yr1) and main PM2.5 (1.0 MDALY yr1). At 0.2 MDALY yr1, the human toxicity effects of Hg2+ are projected to be lower than those of particulate matter. It should be highlighted that the effects of Hg2+ are much unknown since through the food chain is prone significant. Indian coal power stations are responsible for the greatest proportion of worldwide coal combustion health effects. One of the primary factors is India's lack of SO2 regulation. Figure 4 shows the impacts of health in airborne emissions from fuel power generation.
Discussion
The author has discussed about the Coal Power Generation. In a subsequent stage, transport routes were established between power plants and mines, and individual coal blends were obtained. Multiple sources, obtained from satellite photos, or approximated, and will be described in further depth in the parts that follow. These also include coal varieties used in steel production that could not be eliminated since a clear differentiation could not be made. Supplementary, the coal rankings were then assigned. Because the specific criteria vary, this categorization is not universally uniform. The US categorization guidelines were utilised for consistency and since the majority of the coal. When US ranking requirements were not observed, the rankings were translated using rank correspondence [10].
Conclusion
The author has concluded about the coal power generation, to evaluate mining greenhouse gases, regional combustion data per kg of coal mined were obtained from convent. For non-lignite coals, it includes data from mines in different countries, moreover a European and an Entire world dataset coat brown coal. This was predicated on the premise that lignite is primarily mined in open pits, where methane emission are significantly lower and have the greatest total GHG emissions as well as hazardous chemical releases (more than 64% per pollutant). The total effect of the supply chain is less than 19%, but individual components and poisons comprise more than 75%. Methane pollutants from deep coal mining wipe out the efficiency advantages of Chinese coal power plants over Indian coal power stations.
References
- MacKay DJ (2013) Solar energy in the context of energy use, energy transportation and energy storage. Philos Trans A Math Phys Eng Sci 371 :20110431. [Crossref][Google Scholar] [Pubmed]
- Zhu Y, Jiang S, Zhao Y, Li H, He G, et al. (2020) Life-cycle-based water footprint assessment of coal-fired power generation in China. J Clean Prod 254: 120098. [Crossref][Google Scholar] [Pubmed]
- Yun M, Yuxin B (2010) Research on the architecture and key technology of Internet of Things (IoT) applied on smart grid. 2010 int conference adv energy eng 69-72. [Crossref][Google Scholar][Pubmed]
- Oberschelp C, Pfister S, Raptis CE, Hellweg S (2019) Global emission hotspots of coal power generation. Nature Sustain 2: 113-121. [Crossref][Google Scholar] [Pubmed]
- Wang J, Wang R, Zhu Y, Li J, et al. (2018) Life cycle assessment and environmental cost accounting of coal-fired power generation in China. Energy Policy 115: 374-384 [Crossref][Google Scholar] [Pubmed]
- Abbasi SA, Harijan K, Memon ZA, Shaikh F, Mirjat NH, et al. (2021) Is Coal Power Generation a Sustainable Solution for Energy Needs of Pakistan: A Delphi-SWOT Paradigm? Int J Energy Econ Policy 11: 308. [Crossref][Google Scholar] [Pubmed]
- Xu Y, Yang K, Zhou J, Zhao G (2020) Coal-biomass co-firing power generation technology: Current status, challenges and policy implications. Sustain 12: 3692 [Crossref][Google Scholar][Pubmed]
- Du X, Jin X, Zucker N, Kennedy R, Urpelainen J, et al. (2020) Transboundary air pollution from coal-fired power generation. J Environ Manage 270: 110862. [Crossref][Google Scholar][Pubmed]
- Clark R, Zucker N, Urpelainen J. The future of coal-fired power generation in Southeast Asia. Renew Sustain Energy Rev 121: 109650. [Crossref][Google Scholar][Pubmed]
- Pang L, Lv P, Duan L, Yang Y (2020) Dynamic characteristics of a solar-aided coal-fired power generation system under Direct Normal Irradiance (DNI) feedforward control. Energy Sci Eng 8: 1271-1284. [Crossref][Google Scholar] [Pubmed]
 Spanish
  Chinese
  Russian
  German
  French
  Japanese
  Portuguese
  Hindi
Hindi 