Spanish
  Chinese
  Russian
  German
  French
  Japanese
  Portuguese
  Hindi
Hindi Research Article, J Nucl Ene Sci Power Generat Technol Vol: 11 Issue: 8
Concentrations of 222Rn, 226Ra, and 238U in Selected Tea and Coffee Samples from Iraqi Markets
Layth Yousif Jebur1, Ali Jaafar Azeez1, Ali Abdulhussein Hameed1 and Ali Abid Abojassim2*
1Department of Radiology Techniques, Islamic University, Najaf, Iraq
2Department of Physics, University of Kufa, Al-Najaf, Iraq
*Corresponding Author: Ali Abid Abojassim
Department of Radiology Techniques,
Islamic University,
Najaf,
Iraq;
E-mail: ali.alhameedawi@uokufa.edu.iq
Received date: 21 May, 2022, Manuscript No. JNPGT-22-64492; Editor assigned date: 24 May, 2022, PreQC No. JNPGT-22-64492 (PQ); Reviewed date: 07 Jun, 2022, QC No. JNPGT-22-64492; Revised date: 20 July, 2022, Manuscript No. JNPGT-22-64492 (R); Published date: 27 July, 2022, DOI: 10.4172/2325-9809.1000305
Citation: Jebur LY, Azeez AJ, Hameed AA, Abojassim AA (2022) Concentrations of 222Rn, 226Ra, and 238U in Selected Tea and Coffee Samples from Iraqi Markets. J Nucl Ene Sci Power Generat Technol 11:8.
Abstract
In the present research, natural radionuclides (222Rn, 226Ra, and 238U) concentrations were estimated in tea and coffee samples from different Iraqi markets. The measurements are done using LR-115 type 2 detectors. The Annual Average Internal Doses (AAIED), of these radionuclides, has also been calculated. The results show that the average of 222Rn, 226Ra and 238U concentrations in tea samples were 170 ± 28.62 Bq/m3, 0.639 ± 0.12 Bq/kg and 0.79 ± 0.15 ppm, and in coffee samples they were 215.27 ± 36.7 Bq/m3, 0.816 ± 0.12 Bq/kg) and 1.00 ± 0.15 ppm, respectively. The average values of total AAIED due to ingestion of 222Rn, 226Ra, and 238U in tea and coffee samples have been found to be 0.0194 ± 0.003 mSv/y and 0.0089±0.004 mSv/y respectively. According to T-test, it has been found that there is a confirmed non-significant probability (P>0.05) for radionuclide concentrations and a significant (p<0.05) for AAIED between coffee and tea samples statistically. All results of radionuclide concentrations, as well as AAIED, for tea and coffee samples were found to be below the recommended safety limits for the public consumption. The final conclusions are that the tea and coffee samples available in Iraqi markets are free of health risks.
Keywords: Radionuclide; LR-115 type 2; Tea; Coffee; Iraqi markets
Introduction
Natural radiation is considered to be the major and the largest contributor to the collective radiation dose received by the population of the world. Relatively, continuous exposure to radiation for a long time at certain location can lead to radiation hazards. Subsequently, it will affect the health of human beings [1]. Clearly, since the evolution of the creation, the earth is naturally radioactive. In fact, uranium is commonly found in very small amounts in rocks, soil, water, plants, typically provides low levels of natural background radiation present in the environment. Uranium is not absorbed through the skin, and alpha particles that are released by uranium cannot pass through the skin. Therefore, the uranium that exists outside the human body causing less harm than it would be if it were inhaled or ingested [2]. Radium is a radionuclide produced by the decay of uranium and thorium in the environment. It occurs at low levels in all rock, soil, water, plants, and animals nearly. However, geologic processes can from spots of concentrations of naturally radioactive elements, especially uranium and radium [3]. Naturally, Radionuclides that are present in water and air can move up to the food chain. For instance, plants obviously have the ability to absorb radionuclides from water in the same way they absorb other minerals. The rocks and soil diffuse these kinds of gases and they also exist in readily commensurable concentrations in the atmosphere. After spreading over in the air they are inhaled by the human beings during the process of decay products. Similarly, when plants and animals take up the above-mentioned gassy decay products, such products will eventually be transferred to most foodstuffs leading to measurable amounts of natural radioactivity. The ordinary cereals and foods contain high radioactivity, but the situation seems quite different regarding milk products, fruit and vegetables; they contain a low content of radioactivity. World Health Organization defined coffee and tea ‘‘nonnutritive dietary component’’ so it is not considered a food even though containing certain nutrients, as well as numerous compounds of various type. It is the most widely popular non-alcoholic beverages [4]. Tea and coffee may contain radionuclides in concentrations that are produced by nuclear series, such as uranium-238 series and thorium-232, in addition to the isotope potassium-40. Knowing of radioactivity levels in human diet is of particular concern for the estimation of possible radiological hazards to human health. Studies on the radionuclide concentrations in tea and coffee are available in the literature [5-7]. The Overall aim of this study is to measure the natural radionuclide (222Rn, 226Ra, and 238U) concentrations in tea and coffee samples that are collected from different Iraq markets using LR-115 type II detector. The AAIED values have been estimated (due to ingestion of radon-222, radium-226, and uranium-238) in all samples under study.
Materials and Methods
Collection and preparation samples
In the present study, 20 samples of tea and coffee (10 tea and 10 coffee) were collected from different Iraq markets, as shown in Table 1 After the collection, samples were transferred to nuclear laboratory for the measurements. There are many steps in the preparation of each sample for the purpose of doing measurement. First step: Grinding the sample using a mill after drying in an oven (100°C) for two hours. Second step: To sieve the samples by a 200 sieve (0.063 mm). Third step: To weight 10 gm of the dried sample and place it in a plastic cup and stored it for 30 days to obtain radiation equilibrium [8].
| No. | Type Sample | Sample Name | Original | Data Product |
|---|---|---|---|---|
| 1 | Tea | Lipton green tea | England | 2020 |
| 2 | Lipton yellow | England | 2020 | |
| 3 | Dilmah | Sri Lanka | 2020 | |
| 4 | Oscar | England | 2020 | |
| 5 | Shubar ceylon black tea | England | 2020 | |
| 6 | AHMAD TEA | England | 2020 | |
| 7 | Mohammad finest ceylon tea | Sri Lanka | 2020 | |
| 8 | ALWazah green tea | Sri Lanka | 2020 | |
| 9 | AHMAD green tea | England | 2020 | |
| 10 | Shubar green tea | Egypt | 2020 | |
| 11 | Coffee | Coffee boon | UAE | 2020 |
| 12 | 5 Stare | Egypt | 2020 | |
| 13 | Coffee stare | Egypt | 2020 | |
| 14 | Brazilian class | Turkey | 2020 | |
| 15 | Mahmood coffee | Iran | 2020 | |
| 16 | Coffee powder | India | 2020 | |
| 17 | MAs cafe | Brazil | 2020 | |
| 18 | Coffee golden | Jordan | 2020 | |
| 19 | Coffee princes | Lebanon | 2020 | |
| 20 | Najjar coffee | Lebanon | 2020 |
Table 1: List of tea and coffee samples in the present study.
Measurement of the samples
In the present study, solid-state nuclear track detectors by the “Can technique” were used (type LR-115 type 2). It has a thickness of 12 μm detector with dimensions of (1 × 1) cm2 manufactured by Pathe, France. One month later, for secular equilibrium to occur, each detector was put in the upper part of a container (radius 2.75 cm and length 7 cm). A piece of the cut LR–115 type 2 detector was placed at the bottom of each cylinder cover, while the samples were placed at the bottom of the cylinder and then sealed at room temperature for 90 days (the exposure time) [9]. At the end of exposure time, the LR-115 type 2 detectors were etched with sodium hydroxide (NaOH) solution, of 2.5 normality, at 60°C temperature for 1.5 hour using water path. Next, they were washed using distilled water. The track density on LR-115 type 2 was counted through the use of an optical microscope of magnification 10 × 40. To evaluate the background correction, the background was subtracted from registered alpha track density.
Calculations
For the purpose of calculating 222Rn concentration levels in tea and coffee samples, the radon concentrations in the air of test tube Ca were determined by measuring the tracks density (ρ) on the detector as well as time exposure (T) according to the following relation [10]:
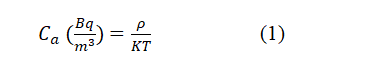
Where k is the calibration factor (0.285 Track.cm-2/Bq.m-3 day) which it is measured using stander of 226Ra source (radon source) with activity 3.6 KBq.
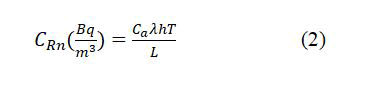
222Rn concentration in sample (CRn) was calculated according to radon decay constant (λ), depth of sample in tube (L=1 cm), distance between sample to detector (h=6 cm), as the following equation [11]:
While, Radium-226 concentrations (CRa) of the tea and coffee samples can be calculated using the formula [12]:
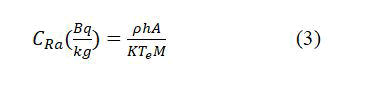
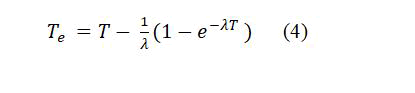
where, A and M are the surface area of cylindrical cup and mass of the sample respectively. But, T_e is the effective exposure time which is related to the actual exposure time t and decay constant λ for 222Rn with the relation [13].
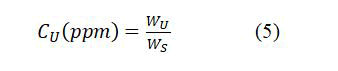
To calculate the uranium-238 concentration of samples (CU), it can be done using the property of scalar equilibrium between radon and uranium radionuclide as well as uranium weight in the sample (WU) and the sample weight (WS), as in the following formula:
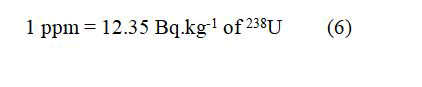
For the environmental radioactivity measurement, the amount of Uranium is normally expressed in Becquerel (Bq) per mass unit.
The International Atomic Energy Agency (IAEA) gives the following conversion factors from concentration unit to activity unit in Bq.kg-1:
The annual average internal dose AAIED by an ingestion of radionuclides from tea and coffee due to 222Rn, 226Ra, and 238U activity in Bq/kg has been calculated according to the equation:
where, C is specific activity for 222Rn, 226Ra, and 238U, I is the rate of consumption from tea and coffee intake for an individual within a year (kg/y) which was equal 1.5 kg/y for tea [14], and 7.5 kg/y for coffee [15], and CF is conversion factor that equal 3.5, 280, and 45 nSv/Bq for radon-222, radium-226 and uranium-238 [16].
Results and Discussion
Table 2 presents the results of radon-222, radium-226 and uranium-238 concentrations in tea and coffee samples. From Table 2, the range of radon concentration in the airspace of the tube (Ca) and within the sample (CRn) in tea samples were varied from 55.56 Bq/m3 in sample T6 to 347.22 Bq/m3 in sample T10 with an average value of 170 ± 28.62 Bq/m3 and from 151.17 Bq/m3 to 944.79 Bq/m3 with an average value of 462.57 ± 77.87 Bq/m3, respectively. While in coffee samples the results of Ca and CRn were ranged from 90.28 Bq/ m3 in sample C10 to 486.11 Bq/m3 with an average value of 215.27 ± 36.7 Bq/m3 and from 245.65 Bq/m3 to 1322.71 Bq/m3 with an average value of 585.77 ± 100.0 Bq/m3, respectively. Also, from the same Table 2, the values of CRa (unit Bq/kg) and CU (unit ppm) for tea samples were ranged from 0.753 in sample T1 to 1.464 in sample T10 with an average value of 0.639 ± 0.12, respectively. While for coffee samples, the range of CRa (unit Bq/kg) and CU (unit ppm) were ranged from 0.373 in sample C9 to 1.757 in sample C4 with an average value of 0.816 ± 0.12 and from 0.462 to 2.172 with an average value of 1.00 ± 0.15, respectively. Figure 2 shows the compering of the average value of radon-222, radium-226 and uranium-238 concentrations. From Figure 2, it is found that, the average value of radionuclide concentrations in coffee samples are higher than that of tea samples. But T-test confirmed the presence of non-significant radionuclide concentrations between coffee and tea samples statistically (P>0.05). The variation in the radon gas concentrations can be attributed to the variation in amount of absorption of radionuclides by plant that produces tea or coffee from the atmosphere, the soil, and the fertilizer which is used during planting process. However, the results of radon concentrations in airspace of the tube (Ca) for all tea and coffee samples were within the accepted limit of the action level, which is 200–600 Bq/m3 [17]. Upon comparing the resulted values of radium-226 and uranium-238 for tea and coffee in all samples of the present study within the study samples, are much lower than in the accepted value by UNSCEAR. Also, it has been found that the alpha emitters due to radon in the samples of the present study were lower than those due to radium. This is attributed to the fact that radon half life (3.82 d) is less than radium (1600 y), as well as the uranium contribution in the emission of alpha particles is insignificant. The variation in concentrations is probably attributed to the difference in natural presence of uranium in most plants (Figure 1).
| No. | Sample code | 222Rn in air space (Bq/m3) | 222Rn within the sample (Bq/m3) | 226Ra (Bq/kg) | 238U (ppm) |
|---|---|---|---|---|---|
| 1 | T1 | 208.33 | 566.88 | 0.753 | 0.931 |
| 2 | T2 | 69.44 | 188.96 | 0.195 | 0.241 |
| 3 | T3 | 104.17 | 283.44 | 0.376 | 0.465 |
| 4 | T4 | 125 | 340.13 | 0.452 | 0.559 |
| 5 | T5 | 138.89 | 377.92 | 0.586 | 0.724 |
| 6 | T6 | 55.56 | 151.17 | 0.156 | 0.193 |
| 7 | T7 | 130.56 | 355.24 | 0.472 | 0.583 |
| 8 | T8 | 243.06 | 661.35 | 0.769 | 0.95 |
| 9 | T9 | 277.78 | 755.83 | 1.171 | 1.448 |
| 10 | T10 | 347.22 | 944.79 | 1.464 | 1.81 |
| Average ± S.E | 170 ± 28.62 | 462.57 ± 77.87 | 0.639 ± 0.12 | 0.79 ± 0.15 | |
| 11 | C1 | 277.78 | 755.83 | 1.004 | 1.241 |
| 12 | C2 | 347.22 | 944.79 | 1.255 | 1.552 |
| 13 | C3 | 201.39 | 547.98 | 0.728 | 0.9 |
| 14 | C4 | 486.11 | 1322.71 | 1.757 | 2.172 |
| 15 | C5 | 138.89 | 377.92 | 0.703 | 0.869 |
| 16 | C6 | 173.61 | 472.4 | 0.732 | 0.905 |
| 17 | C7 | 187.5 | 510.19 | 0.678 | 0.838 |
| 18 | C8 | 131.94 | 359.02 | 0.477 | 0.59 |
| 19 | C9 | 118.06 | 321.23 | 0.373 | 0.462 |
| 20 | C10 | 90.28 | 245.65 | 0.457 | 0.565 |
| Average ± S.E | 215.27 ± 36.7 | 585.77 ± 100.0 | 0.816 ± 0.12 | 1.00 ± 0.15 | |
Table 2: Results of 222Rn, 226Ra, and 238U concentrations in tea and coffee samples in the present study.

Figure 1: compering the average values of three radionuclide in the present study.

Figure 2: Compering the average values of total AAIED in the present study.
The results of Annual Average Internal Dose (AAIED) by the ingestion of radionuclides 222Rn, 226Ra, and 238U were shown in Table 3. It was found that, the average values of AAIED in unit μSv/y due to 222Rn, 226Ra, and 238U in tea samples were 0.851 ± 0.16, 5.37 ± 1.04, and 13.18 ± 2.6, respectively. While the average values of AAIED in unit μSv/y due to 222Rn, 226Ra, and 238U in coffee samples were 1.09 ± 0.17, 6.86 ± 1.06, and 1.02 ± 0.16, respectively. Also, from Table 3, the results of the total of AAIED in tea and coffee samples varied from 0.0047 mSv/y in sample T6 to 0.0444 mSv/y in sample T10 with an average value of 0.0194 ± 0.003 mSv/y and from 0.0041 mSv/y in sample C9 to 0.0193 mSv/ y in sample C4 with an average value of 0.0089 ± 0.004 mSv/y, respectively. Figure 2 shows the comparison of the average value of total AAIED. From Figure 2, it was found that, the average value of total AAIED in tea samples is higher than in coffee samples and the result is significant statistically (p<0.05) according to T-test. This is attributed to the fact that the rate of consumption of tea is far more than coffee. However, the results of total rates of AAIED in tea and coffee for all samples in the present work were lower than the action level of 0.29 mSv/y recommended by UNSCEAR with regard to the ingestion exposure that occurred by natural sources. Therefore, the values of total AAIED are very little. So, it may be decided that no health risks of tea and coffee samples in the current work.
| No. | Sample code | AAIED (µSv/y) | Total of AAIED (mSv/y) | ||
|---|---|---|---|---|---|
| 222Rn | 226Ra | 238U | |||
| 1 | T1 | 1 | 6.33 | 15.53 | 0.0229 |
| 2 | T2 | 0.26 | 1.64 | 4.02 | 0.0059 |
| 3 | T3 | 0.5 | 3.16 | 7.76 | 0.0114 |
| 4 | T4 | 0.6 | 3.8 | 9.32 | 0.0137 |
| 5 | T5 | 0.78 | 4.92 | 12.07 | 0.0178 |
| 6 | T6 | 0.21 | 1.31 | 3.21 | 0.0047 |
| 7 | T7 | 0.63 | 3.96 | 9.72 | 0.0143 |
| 8 | T8 | 1.02 | 6.46 | 15.85 | 0.0233 |
| 9 | T9 | 1.56 | 9.84 | 24.14 | 0.0355 |
| 10 | T10 | 1.95 | 12.3 | 30.19 | 0.0444 |
| Average ± S.E | 0.851 ± 0.16 | 5.37 ± 1.04 | 13.18 ± 2.6 | 0.0194 ± 0.003 | |
| 11 | C1 | 1.33 | 8.43 | 1.26 | 0.011 |
| 12 | C2 | 1.67 | 10.54 | 1.57 | 0.0138 |
| 13 | C3 | 0.97 | 6.12 | 0.91 | 0.008 |
| 14 | C4 | 2.34 | 14.76 | 2.2 | 0.0193 |
| 15 | C5 | 0.93 | 5.91 | 0.88 | 0.0077 |
| 16 | C6 | 0.97 | 6.15 | 0.92 | 0.008 |
| 17 | C7 | 0.9 | 5.7 | 0.85 | 0.0074 |
| 18 | C8 | 0.63 | 4.01 | 0.6 | 0.0052 |
| 19 | C9 | 0.5 | 3.13 | 0.47 | 0.0041 |
| 20 | C10 | 0.61 | 3.84 | 0.57 | 0.005 |
| Average ± S.E | 1.09 ± 0.17 | 6.86 ± 1.06 | 1.02 ± 0.16 | 0.0089 ± 0.004 | |
Table 3: Results of AED due to 222Rn, 226Ra, and 238U concentrations in tea and coffee samples in the present study.
Conclusion
The results three of natural radionuclide (222Rn, 226Ra, and 238U) in 10 tea samples and 10 coffee samples that are collected from Iraq markets were found to be much smaller than the world average level. Also, it is found the total annual internal effective doses from radon, radium, and uranium due to the ingestion of all samples in the present study are lower than the action levels recommended by UNSCEAR. Upon comparing the results of natural radionuclide for tea and coffee samples, it was confirmed a non-significant relationship, while according to AAIED were significant between these types of samples. However, it can be concluded that the radon concentration in the samples under study was low and not significantly hazardous from a health point of view.
References
- World Health Organization & Global Environment Monitoring System (1992) Urban air pollution in megacities of the world. Blackwell publishers, Oxford, UK, p.230.
- L'Annunziata MF (2016) Radioactivity: introduction and history, from the quantum to quarks. Camebridge University, Cambridge, USA.
- L'Annunziata MF (2012) Handbook of radioactivity analysis. Academic Press, Netherlands, USA, p.1-148.
- World Health Organization (2000) WHO global principles for the containment of antimicrobial resistance in animals intended for food: report of a WHO consultation with the participation of the Food and Agriculture Organization of the United Nations and the Office International des Epizooties, Geneva, Switzerland 5-9 June 2000.
- Al–Sawaf HA, Jassim AK, Al-Mashhadani HY (2009) Radon and Radium Determination in Coffee Using CR-39 Nuclear Track Detector. Rafidain J Sci 20:105-108.
- Roselli C, Desideri D, Rongoni A, Saetta D, Feduzi L (2013) Radioactivity in coffee. J Radio anal Nucl Chem 295:1813-1818.
- Aktar MN, Das SK, Yeasmin S, Siraz MM, Rahman AM (2018) Measurement of Radioactivity And Assessment of Radiological Hazard of Tea Samples Collected From Local Market In Bangladesh. J Bangladesh Acad Sci 42:171-176.
- Hashim AK, Mezher HA, Kadhim SH, Abojasim AA (2021) Annual Average Internal Dose Based on Alpha Emitters in Milk Sample. J Phys Conf Ser 1829:012027.
- Hady HN, Abojassim AA, Mohammed ZB (2016) Study of radon levels in fruits samples using LR-115 type II detector. J Environ Sci Technol 9:446-451.
- Abojassim AA (2021) Radiological Risk Assessment of Radon Gas in Bricks Samples in Iraq. J Nucl Eng Radiat Sci 7:032001.
- Abojassim AA, Lawi DJ (2018) Alpha particles emissions in some samples of medical drugs (capsule) derived from medical plants in Iraq. Plant Arch 18:1137-1143.
- Abojassim AA, Al-kufI FA, Mohsen AA (2017) Determination of effective radium content and uranium concentrations for the soap and the detergent powder samples in Iraq. Curr Pediatr Res 21:485-489.
- Ibrahim AA, Hashim AK, Abid A (2021) Determination of alpha activity in soil samples of agricultural college of kerbala university, Iraq. Ann Agri Bio Res 26:125-131.
- Absar N, Abedin J, Rahman MM, Miah M, Hossain M (2021) Radionuclides Transfer from Soil to Tea Leaves and Estimation of Committed Effective Dose to the Bangladesh Populace. Life 11:282.
[Googlescholar] [Crossref] [Indexed]
- Abbas AA, Ibrahim AMK, Kadhim MJ (2016) Measurement of radionuclides in imported Coffee Consumed in Basra southern of Iraq and estimation of its annual effective dose. Baghdad Sci J 13:376-380.
- National Research Council (US) Committee on Risk Assessment of Exposure to Radon in Drinking Water (1999) Risk Assessment of Radon in Drinking Water. Washington (DC): National Academies Press (US), p.296.
- International Commission on Radiological Protection (1993) Protection against radon-222 at home and at work. Ann ICRP 23:1-45.