Research Article, J Forensic Toxicol Pharmacol Vol: 12 Issue: 1
Cyanide Determination in Postmortem Blood Samples Using Headspace-Ion Mobility Spectrometry (HS-IMS)
Ali Moaddeli1*, Mehran Fereidooni1, Marzieh Nabipour1, Razieh Parchami2 and Mahmoud Tabrizchi2
1Legal Medicine Research Center, Legal Medicine Organization, Tehran, Iran
2Department of Chemistry, Isfahan University of Technology, Isfahan, Iran
*Corresponding Author: Ali Moaddeli
Legal Medicine Research Center, Legal Medicine Organization, Tehran, Iran
E-mail: ali_moad85@yahoo.com
Received date: 27 February, 2023, Manuscript No. JFTP-23-89591;
Editor assigned date: 01 March, 2023, PreQC No. JFTP-23-89591(PQ);
Reviewed date: 15 March, 2023, QCNo JFTP-23-89591;
Revised date: 22 March 2023, Manuscript No. JFTP-23-89591(R);
Published date: 31 March 2023 DOI: 10.4172/JFTP.1000139.
Citation: Moaddeli A, Fereidooni M, Nabipour M, Parchami R, Tabrizchi M (2023) Cyanide Determination in Postmortem Blood Samples Using Headspace- Ion Mobility Spectrometry (HS-IMS). J Forensic Toxicol Pharmacol 12:1.
Abstract
Interest in facile and sensitive methods for cyanide detection is related to the extreme cyanide toxicity and its importance in forensic toxicology. In this research a novel application of Ion Mobility Spectrometry (IMS) was demonstrated for rapid determination of cyanide poisoning in postmortem toxicology. In addition, a simple method for the sample preparation was applied based on the analyte (cyanide anion) transfer as HCN to the headspace and direct injection to IMS. The method showed a linear dynamic range of 50-2000 μg L-1 with R2 > 0.99, a high sensitivity (LOD of 20.4 μg L-1 and LOQ of 68.1 μg L-1). Good repeatability (intra- and interassays CV<15%) and excellent extraction recovery (82%-94%) were obtained. After validation, the method was applied in the analysis of postmortem human blood samples in forensic cases. In all samples, the cyanide was promptly quantified.
Keywords: Ion Mobility Spectrometry (IMS); Cyanide monitoring; Cyanide poisoning; Postmortem toxicology.
Introduction
Determination of cyanide and its metabolites in the biological fluids is highly necessary for forensic, clinical, military, research, and veterinary purposes [1]. Cyanide exists in the form of Hydrogen Cyanide (HCN) and its metal salts, such as KCN and NaCN that are widely used in industrial processes [2]. Natural sources of cyanide are cyanogenic glycosides found in the seeds of various plants such as peaches, apricots and plums [3]. Although the primary natural source of cyanide poisoning is from plants, other natural sources include volcanoes, bacteria, and fungi [4].
Both forms of cyanide (HCN and CN-) are widely used in the chemical industry to produce polymers, fabrication of synthetic fibers, electrolysis, extraction of minerals, electroplating, chemical synthesis, plastics processing, paint manufacturing, gold and silver extraction, tanning, metallurgy and pest control [5]. The approximate global
industrial need for cyanide is 1.1 million tons per year [4,6]. Cyanide poisoning affects the humans and animals respiratory, cardiovascular and central nervous systems [7]. On the other hand, cyanide is used in sodium nitroprusside as a hypotensive agent [8]. The reference values for cyanide in the blood are less than 0.05 mg/L [9]. It is also commonly found in smoke from cigarettes or fires and in some food items [10]. Because of its toxicity, HCN has been used as a chemical warfare agent.
Cyanide exposure can occur through inhalation, ingestion and absorption through the skin [11]. Hydrogen Cyanide (HCN) is an extremely poisonous chemical with a human LD50 of only 150-173 ppm via inhalation for a 30 min exposure [11]. Approximately 100 mg HCN or 300 mg potassium cyanide rapidly cause human death [9]. Low amounts of cyanide in long-term exposure can also affect the central nervous actions [12]. Fatal or severe cyanide poisoning is relatively rare and mostly involves suicidal ingestion. In severe suicidal cases there may be a rapid loss of consciousness, respiratory failure and convulsions that lead to cardiorespiratory arrest and death. In postmortem cases after suicidal ingestion of cyanide salts, elevated levels of cyanide occur in blood samples taken from the heart or other central sites [9]. Due to the high toxicity of cyanide and low residual cyanide levels in biological postmortem samples, a sensitive instrumental method is required for detection of cyanide and metabolites in clinical and forensic toxicology.
In addition, the requirement of the detection sensitivity depends on the sources of biological fluids. For instance, cyanide ion concentration in blood is in micro molar range, while it is in nano molar in urine due to the fast metabolic processes that convert cyanide mainly to thiocyanate (∼80%) and other species [2]. Spectrophotometry, fluorescence, chemiluminescence, electrochemistry, gas chromatography, Liquid Chromatography (LC), Flow Injection Analysis (FIA) and Capillary Electrophoresis (CE), are of common approaches used to determine the cyanide in biological samples [4]. Factors that are most effective in selecting an analytical method includes; analysis time, sample preparation, method sensitivity, availability of equipment and cost.
IMS is basically a gas-phase ion separation technique [13,14]. It is a simple, sensitive, and fast analytical technique for the detection of trace level of volatile organic compounds. In IMS, molecules of interest are vaporized, ionized and then separated while traveling in a weak electric field under atmospheric pressure [14]. This technique provides means to resolve gas phase ions on the basis of their shape and mass-to-charge ratios, thus providing significant potential for separation and quantification of species [15]. IMS uses atmospheric pressure chemical ionization. It has two positive and negative modes of operation. In the negative mode, species with high electron affinity are the most stable final product ions. Among them, cyanide with 3.86 eV electron affinity even higher than any halogen atom, easily generates the CN- anion. Hence, cyanide is expected to be sensitively detected by IMS in the negative mode [16].
This work introduces a new application of Ion Mobility Spectrometry (IMS) for quantification of cyanide in biological samples. The aim of present work is to develop a fast and accurate method for determination of cyanide ion in the biological samples using IMS. In this study, a simple and rapid method based on direct transfer of headspace vapor into the IMS injection port was also used.
Materials and Methods
Standards and reagents
The chemicals used in the experiment: potassium cyanide (KCN; 95.5%), was purchased from Sigma-Aldrich (Saint Louis, MO, USA),. orthophosphoric acid (85%), potassium hydroxide pellet, L-ascorbic acid. and water were purchased from Merck Millipore Company. Blank blood sample was obtained from healthy nonsmoking adults and stored at temperature below -20 °C used in the validation of the analytical method
Preparation of standards and reagents
Concentrated phosphoric acid (85%, w/v) is diluted 1.7-fold with distilled water (50%, w/v, preservable at room temperature). A 1.76 g aliquot of L-ascorbic acid is dissolved in deionized water to prepare 10 mL solution of 1 M (preservable in refrigerator for 4 weeks). Stock standard solution of Potassium Cyanide (KCN) with concentration of 1000 μg mL-1 was prepared 1 M KOH solution in deionized water that was then used for preparation of the standard solutions of 0.01-10 μg mL-1 using serial dilution. Spiked samples were prepared by addition of appropriate amount of the working standard solution of KCN to the blank blood sample obtained from healthy nonsmoking adults.
Sample preparation
0.5 mL volume of whole blood sample plus 0.03 mL of 1 M ascorbic acid solution and 0.27 mL distilled water were placed in a 10 mL glass crimp vial (23 mm × 46 mm) and capped air tightly using PTFE/silicone septum. Then, 0.2 mL volume of 50% phosphoric acid solution was drawn into a glass syringe and injected into the vial and heated at 50°C for 30 min for headspace extraction of HCN. The vial was maintained at room temperature for 5 min. Then 2.5 mL volume of the headspace vapor was drawn into a clean tuberculin glass syringe attached with a 25 G × 1.5″ needle and injected into IMS.
Instrumentation
In these experiments an IMS instrument with a corona discharge ionization source was used for determination and quantification of cyanide. The IMS instrument used in this study was manufactured by TOF Tech Pars Corporation. The IMS cell was constructed of 16 16 aluminum rings (9 mm) separated by 1 mm Teflon gaskets to make a total length of 16 cm installed in an oven and a needle for producing the corona. A detailed description of the instrument and its corona discharge ionization source can be found in study Tabrizchi [17]. Table 1 presents the optimized experimental conditions for obtaining the ion mobility spectra of cyanide.
Table 1: Optimum instrumental conditions for the detection of cyanide.
GC-NPD analyses were carried out by 6850 GC system equipped with nitrogen–phosphorous detector and headspace auto sampler (Agilent technologies, 7694 E, USA). Chromatographic separation was achieved on porous polymer-type fused silica wide-bore capillary column (RT-Q-BOND, 30 m × 0.53 mm i.d., film thickness 0.2 μm, RESTEK) using nitrogen as carrier gas at 2 mL min-1 in a constant flow rate mode. Injections were made in split mode 1:5. The injector port and detector temperatures were 200 Ì? C and 300 Ì? C, respectively. The oven temperature was maintained at 80 Ì? C during total run time of 6 min.
Validation of analytical method
The method was validated in accordance with the FDA and EMA center for drug evaluation and research guidelines for bio analytical method validation [18,19]. Method validation involved determination of the linearity over the calibration range, the sensitivity (Limit of Detection, (LOD) and Limits of Quantification, (LOQ)), the accuracy, the precision (CV% values), the recovery and the matrix effects.
Results and Discussion
Ion mobility spectra
Cyanide measurement was performed in negative mode of Corona Discharge (CD) ionization source of ion mobility spectrometer [20]. Figure 1 shows the ion mobility spectra correspond to the background, blank and standard samples at different concentration levels of cyanide. The peaks observed in the background and blank spectra are due to a complex mixture of the reactant ions such as NOx-, CO3 -, OH- and O2-, which are produced in the negative corona discharge. In the ion mobility spectra of the standard solutions, a new signal at drift time 4.12 ms is observed that corresponds to the cyanide ion. HCN is converted to CN- ion following the chemical reactions inside the ionization region. As is clear, the cyanide peak is well separated from the baseline peaks and its intensity increases with increasing the concentration level.
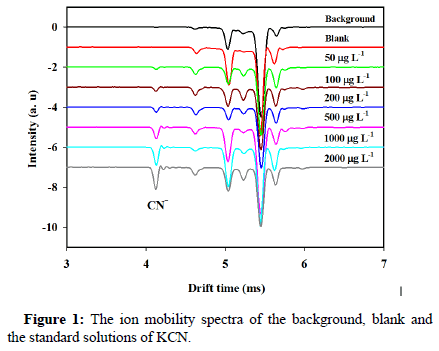
Figure 1: The ion mobility spectra of the background, blank and the standard solutions of KCN.
Quantitative analysis
To study the suitability of HS-IMS for quantification of cyanide, the figures of merit including Linear Dynamic Range (LDR), Limit of Detection (LOD), Limit of Quantification (LOQ), repeatability (in term of RSD%) and relative recovery were determined under the optimal conditions as mentioned in Table 2. The calibration curve was constructed using the accumulation of peak area obtained with the introduction of the standard potassium cyanide (KCN) solutions in the concentration range from 20 to 10000 μg L-1. The calibration curve was linear in the range of 50 to 2000 μg L-1 with a coefficient regression of 0.9927 at seven levels (Figure 2).
aFlow injection chemiluminescence
bCapillary electrophoresis
cGas chromatography–electron capture detector
dGas chromatography–mass spectrometry
eHeadspace–ion mobility spectrometry
Figure 2: Calibration curve for cyanide analysis.
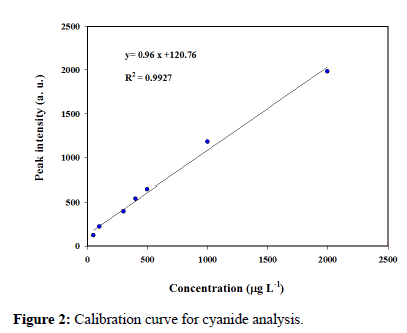
Figure 2: Calibration curve for cyanide analysis.
In order to determine the sensitivity of the proposed method, the limit of detection and the limit of quantification was calculated 20.4 and 68.1 μg L-1 based on the signal to noise ratio of 3 and 10, respectively. The Relative Standard Deviation of determination (RSD %) at 100 μg L-1 was obtained to be 2.97% with five replicate analyses.
To investigate the sample matrix effect, recovery was determined by spiking 100 and 250 μg L-1 of potassium cyanide standard solution in the whole blood sample. Relative recovery verified in the range of 82%–94%, as shown in Table 2.
Real sample analysis
To evaluate the applicability of the present method, the analysis of real sample was performed under optimal conditions. In this line, normal blood sample and a postmortem blood sample, taken from a suicide case that was provided by the legal medicine, was directly analyzed using IMS. The HS-IMS spectra for the real samples are presented in Figure 3. Comparison of the background and the normal blood spectra shows a clean extraction that was achieved by the headspace method. The normal blood spectrum is similar to that of the background with no additional peaks. Also, it does not show any sign of cyanide peak. However, proves that spiking cyanide to the normal blood sample makes the CN-peak to clearly appear in the ion mobility spectrum, without any interference from the sample matrix. The spectra of the postmortem blood sample also shows a peak correspond to cyanide, that confirms cyanide poisoning.
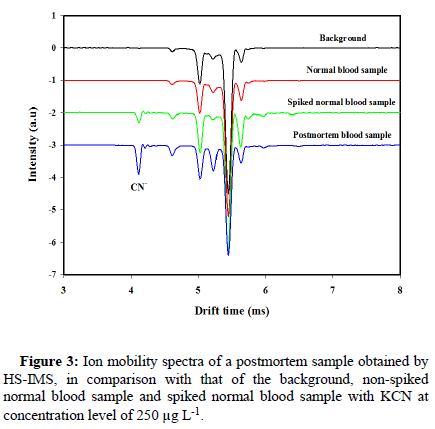
Figure 3: Ion mobility spectra of a postmortem sample obtained by HS-IMS, in comparison with that of the background, non-spiked normal blood sample and spiked normal blood sample with KCN at concentration level of 250 μg L-1.
Validation methodology
The cyanide concentration of the postmortem sample, measured by the HS-IMS method was 11.80 mg L-1. To validate the IMS method, the cyanide concentration was also determined in the same real sample with HS-GC-NPD as a standard method. The cyanide content of the sample was 12.08 mg L-1, for HS-GC-NPD methods. A good agreement between the results from IMS and that obtained from HSGC- NPD technique was achieved. The relative difference between the IMS and GC-NPD results is about 9%. This agreement confirms the potential applicability of our method in clinical and forensic toxicology.
Case report
A 27 year old single, educated and healthy sportsman without any psychological and emotional problem, found death on his bed with some foamy discharge around his mouth. According to the unknown cause and manner of death, law enforcement officials requested assistance from Shiraz forensic medicine department. Medico-legal investigations revealed that he is a young man with height 175 cm and weight of 83 kg with Body Mass Index (BMI) equal to 27.1, without any evidence of trauma on body and advanced medical and congenital disease. Internal examination by autopsy was negative for detection of cause of death except there was foamy discharge from oral cavity and dark fluid material in stomach.
Pathologic investigation was negative. Toxicological analysis was performed to further investigation on blood, urine, gastric content and liver. No drug and suspicious materials was found in the postmortem samples but GC-NPD analysis on gastric content show considerable amount of HCN. Accordingly, IMS analysis was also performed for determination and quantitation of HCN level in blood and measured to be 11.80 mg L-1. Lethal level for whole blood cyanide is considered to be >3 mg L-1. The cyanide level in this case was within the toxic range.
Conclusion
This work presents a new application of IMS for the fast cyanide monitoring in biological samples. The optimal conditions corresponding to the highest sensitivity for cyanide allowed selective determination of this ion from the complicated matrixes. Another important advantage of using IMS for detection of cyanide is not need to tedious sample preparation such as derivatization. Portability, easy operation and low cost analysis are superior features of proposed technique over traditional approaches. The method was validated for the whole blood sample. The detection limit of this technique (20 μg L-1) is well below the lethal dose of cyanide in blood (3 mg L-1). Hence, it can be expanded for routine analysis in clinical laboratories.
References
- Steven IB, Ilona P, Gennady EP, Gary AR, Brian AL (2006) Spectrophotometric analysis of the cyanide metabolite 2-Aminothiazoline-4-Carboxylic Acid (ATCA). Toxicol Mech Methods 16: 339-345.
- Zhang QN, Maddukuri N, Gong M (2015) A direct and rapid method to determine cyanide in urine by capillary electrophoresis. J Chromatogr A 1414: 158-162.
- Ewa J, Sylwia N, Jacek N, Żaneta P (2017) Determination of cyanide in urine and saliva samples by ion chromatography with pulsed amperometric detection. Monatsh Chem 148: 1645-1649.
- Logue BA, Hinkens DM, Baskin SI, Rockwood GA (2010) The analysis of cyanide and its breakdown products in biological samples. Crit Rev Anal Chem 40: 122-147.
- Randviir EP, Banks CE (2015) The latest developments in quantifying cyanide and hydrogen cyanide. TrAC Trends Anal Chem 64: 75-85.
- Randy J, Robert PO, Raj KB, Sari BM, Matthew B, et al. (2014) Development of a fluorescence-based sensor for rapid diagnosis of cyanide exposure. Anal Chem 86: 1845-1852.
- Rahul K, Amrita G, Ajeet S, Prachi G, Ashwani M, et al. (2016) Selective detection of cyanide in water and biological samples by an off-the-shelf compound. Acs Sensors 1: 1265-1271.
- Veniero G, Sebastiano A, Eleonora C, Lucia D, Chiara P, et al. (2007) Blood cyanide determination in two cases of fatal intoxication: Comparison between headspace gas chromatography and a spectrophotometric method. J Forensic Sci 52: 1401-1404.
- Moffat Anthony C, Osselton M David, Widdop B, Watts Jo (2011) Clarke's analysis of drugs and poisons. (4th edn) Pharmaceutical press London.
- Raj Bhandari K, Robert Oda P, Stephanie Youso L, Ilona P, Vikhyat Bebarta S, et al. (2012) Simultaneous determination of cyanide and thiocyanate in plasma by chemical ionization gas chromatography mass-spectrometry (CI-GC-MS). Anal Bioanal Chem 404: 2287-2294.
- Subrata B, Zhiling Z, Wenhui Z, Fredrick O, Gary AR, et al. (2019) Analysis of potential cyanide antidote, dimethyl trisulfide, in whole blood by dynamic headspace gas chromatography–mass spectroscopy. J Chromatogr 1591: 71-78.
- Mohammad A, Javad H, Jamshid LM (2014) Determination of cyanide using a chemiluminescence system composed of permanganate, rhodamine B, and gold nanoparticles. Microchimica Acta 181: 1851-1856.
- Tabrizchi M, Khezri E (2008) The effect of ion molecule reactions on peaks in ion mobility spectrometry. Int J Ion Mobil Spectr 11: 19-25.
- Eiceman GA (1991) Advances in ion mobility spectrometry: 1980–1990. Crit Rev Analyt Chem 22: 471-490.
- Colin Creaser S, John Griffiths R, Claire Bramwell J, Sadaf N, Carol AH, et al. (2004) Ion mobility spectrometry: A review. Part 1. Structural analysis by mobility measurement. Analyst 129: 984-994.
- Stephen Bradforth E, Eun Ha K, Don Arnold W, Daniel Neumark M (1993) Photoelectron spectroscopy of CN−, NCO−, and NCS−. J Chem Phys 98: 800-810.
- Tabrizchi M, Khayamian T, Taj N (2000) Design and optimization of corona discharge ionization source for ion mobility spectrometry. Rev Sci Instrum 71: 2321-2328.
- Administration USFD (2018) Bio-analytical method validation guidance for industry. US Food and Drug Administration.
- Tabrizchi M, Abedi A (2002) A novel electron source for negative ion mobility spectrometry. Int J Mass Spectrom 218: 75-85.
- Jiagen L, Zhujun Z, Jindong L, Lirong L (2005) A micro-chemiluminescence determination of cyanide in whole blood. Forensic Science Int 148: 15-19.
- Svetlana J, Birute P, Audrius P (2006) Headspace singleâ?drop microextraction with inâ?drop derivatization and capillary electrophoretic determination for free cyanide analysis. Electrophoresis 27: 4538-4544.
- Felby S (2009) Determination of cyanide in blood by reaction head-space gas chromatography. Forensic Sci Med Pathol 5: 39-43.
- Giampietro F, Flavio Z, Donata F, Santo Davide F (2006) An improved method for cyanide determination in blood using solidâ?phase microextraction and gas chromatography/mass spectrometry. Rapid Commun Mass Spectrom 20: 2932-2938.
- Ruangkanchanasetr S, Wananukul V, Suwanjutha S (1999) Cyanide poisoning, 2 cases report and treatment review. J Med Assoc Thai 82: S162-S167.
 Spanish
  Chinese
  Russian
  German
  French
  Japanese
  Portuguese
  Hindi
Hindi 