Review Article, J Nucl Ene Sci Power Generat Technol Vol: 11 Issue: 4
Design and Financial Analysis of Solar Rooftop PV System in Toronto using RETScreen Software
Rishi Sikka1*, Sandeep Singh2 and Prashant3
1Department of Physics, Sanskriti University, Mathura, Uttar Pradesh, India
2Department of Computer Science and Engineering, Shree Guru Gobind Singh Tricentary University, Haryana, India
33Department of Electrical and Electronic Engineering, Teerthanker Mahaveer University, Bagadpur, Uttar Pradesh, India
*Corresponding Author: Rishi Sikka, Department of Physics, Sanskriti University, Mathura, Uttar Pradesh, India, E-mail:rishisikka.ec@sanskriti.edu.in
Received date:03 November, 2021, Manuscript No. JNPGT-21-46557;
Editor assigned date: 05 November, 2021, PreQC No. JNPGT-21-46557 (PQ);
Reviewed date: 19 November, 2021, QC No. JNPGT-21-46557;
Revised date: 03 January 2022, Manuscript No. JNPGT-21-46557 (R);
Published date: 23 March 2022, DOI: 10.4172/2325-9809.1000267
Citation: Rishi S, Sandeep S, Prashant (2022) Design and Financial Analysis of Solar Rooftop PV System in Toronto using RETScreen Software. J Nucl Ene Sci Power Generat Technol 11:4.
Abstract
Globally, the depletion of fossil fuels has necessitated an alternate way of energy sources to meet the existing electricity requirement. This paper evaluates the feasibility of a solar grid connected rooftop photovoltaic system supplying electricity to a commercial user in the city of Toronto, Canada. The system comprises 266 photovoltaic modules, each having a rating of 300 Wp and 4 inverters having a rating of 20 kW. The simulation of the design of the system is conducted using RET Screen software. RET Screen is used to validate the technoeconomic and environmental sustainability of the proposed solar photovoltaic system. The results show the performance and financial analysis. The result encourages the use of photovoltaic systems to electrify the remote areas of the United States.
Keywords: Financial analysis, Grid-connected photovoltaic system, Solar energy, RET screen software
Introduction
The conventional sources of energy are natural gas, coal, and nuclear energy of which electricity due to coal is higher than the others. In Canada, about 10% of electricity is generated using coal but the conversion efficiency is low, and also during this conversion process, pollutants are released to the atmosphere which is hazardous to the environment. Since coal is a finite quantity so in the future it will come to extinction. By considering all these facts, an alternate source of energy can be used. Renewable energy is the solution to these problems. Canada utilizes 60% hydropower energy and 7% other renewable energy sources to produce electricity. In recent years, grid-connected solar PV systems have grown and reached 2 GW of installed capacity by the end of 2019. Throughout Canada, an average solar radiation of 1-3 kWh per m2 is received [1].
Photovoltaic modules or panels consist of semiconductors that absorb sunlight as a source of energy to be converted directly to generate electricity. If ac loads are used means the system requires an inverter to convert the dc into ac. Photovoltaic systems are classified into two systems; grid-connected systems and standalone systems. Grid-connected systems generate electricity directly to the utility grid and its performance is dependent on the local climate, orientation, and inclination of the photovoltaic array and inverter performance. Grid-connected systems generate clean electricity with insignificant transmission and distribution losses. Standalone systems are independent of the utility grid and the electricity generated is directly connected to the load. An energy storage system is required if the photovoltaic array is not directly connected to the load.
The energy storage system is a battery that stores the excess power produced by the photovoltaic modules and is a backup supply to the load if the photovoltaic system supply is insufficient. The standalone system is usually used in homes for electrification purposes [2]. There are a wide variety of tools that can be used for the design and performance analysis of both a grid-connected system and a standalone system. RET Screen simulation tool is designed to be operated by architects, engineers and researchers. It includes in-depth contextual help, which explains in detail the procedure and the models used and offers an ergonomic approach with guidance in the development of a project. RET Screen allows you to import weather data from ten different sources as well as personal data. The financial analysis of a system can be done using this software.
Literature Review
Analyses the design and performance evaluation of a 2 kW grid connected solar PV rooftop using PVsyst. The system is designed for a residential type consumer load located at Bhubaneswar, Odisha. The total load of the residency is calculated and a 2 kW system is designed. The economic analysis on the system is done and the financial savings over the system life-time is Rs. 3, 93,300 as well as the carbon-dioxide emissions is only 57 tons which is equivalent to the planting and cultivating of 91 teak trees. PVsyst is used to determine the power production, loss factors, efficiency and the performance ratio of the system. The expansion of the use of solar photovoltaic systems provides green energy and also evolution of the society [3]. Team of experts discusses the design and performance evaluation of a 1 kW grid connected solar PV rooftop using PVsyst. The system is designed for a commercial type consumer load located at Hamirpur, Himachal Pradesh. The global solar radiation data is determined so that more accurate results are produced. Using PVsyst, the total energy generated by the system is determined as well as the losses occurring in the system. The performance ratio over a whole year is also calculated which indicates that the system is a feasible option for the location. The use of solar photovoltaic system is a viable option to supplement the increasing energy demand.
Team of experts presents the design, simulation and economic evaluation of a 90 kW grid connected solar PV rooftop using PVsyst. The system is designed for the National Institute of Technology (NIT), Rourkela, Odisha. Using PVsyst, they select the proper rating of PV panels, inverter, tilting angle of PV panels, solar azimuth selection, and loss calculation and performance evaluation. It is also used to monitor the power generation from the system. The economic evaluation is calculated over a period of 30 years and the cost savings are Rs.1,10,03,463 and the estimated carbon dioxide emission is 2199.3 tons. It is found to be a feasible solution for power supply in that location which would help to reduce energy cost [4]. Team of experts explains the performance evaluation of a 100 kWp grid-connected photovoltaic system using PVsyst. The feasibility of the photovoltaic system for supplying the electric load of an education institution. The 100 kWp photovoltaic system generates 165.38 MWh/year of which 161.6 MWh/year is injected to the grid. The performance ratio of the system is 80%, the useful energy is 4.42 kWh/kWp/day and the losses throughout the year are also computed. The planned photovoltaic provides operational benefits and can be carried out using different photovoltaic modules with appropriate installation methods to improve the performance [5].
Team of experts analyses the unused and abundant solar energy available in Nigeria and how to attract solar investors to invest in clean energy technology. This would help reduce global warming caused by burning of wood and also enhance the sustainable development of the region. RETScreen software is used to support the techno-economic and environmental sustainability of installing a grid-connected solar photovoltaic system in the region. Meteorological data was collected from the National Aeronautics and Space Administration (NASA) database. The annual solar radiation of the site was 5.96 kWh/m2/day and the result obtained was energy exported to the grid was 11385 MWh and the system had a capacity factor of 21.7%. The payback period was 13.6 years and the GHG emission reduction was 5642.5 ton of CO2 which is equal to 501.5 ha of forests absorbing carbon [6]. In this paper, the procedure used to design an 80 kW grid connected solar photovoltaic rooftop system located in Toronto, Canada is described. RET Screen is used to analyse the feasibility and the performance of the system. The performance of the system is monitored over a period of a year and generates the total energy the system can produce in this period. The present also presents different parameters such as performance, technical specifications of the photovoltaic modules and the inverter as well as the GHG emission reduction. The economic analysis of the power plant is also calculated using the RET Screen software.
Design
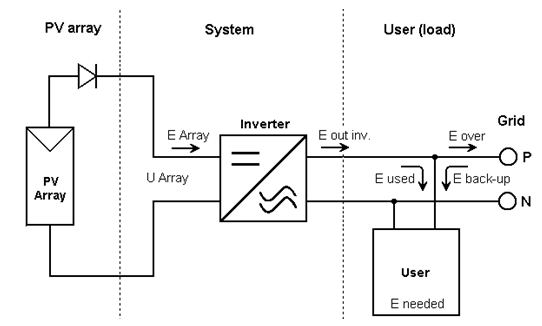
A grid connected solar PV rooftop system consists of various components which include solar PV panels, inverter, net metering, utility grid, a set of connection cables and connected loads. The connection is shown in Figure 1.
Geographical location of the site
Toronto is a city in Canada located at latitude 43.6532°N and longitude 79.3832°W. Over a year, the temperature of the site varies from -5°C to 25°C. The altitude of the location is 10 m. This is the ideal environment for a solar PV system to get the expected output [7].
Site meteorological data
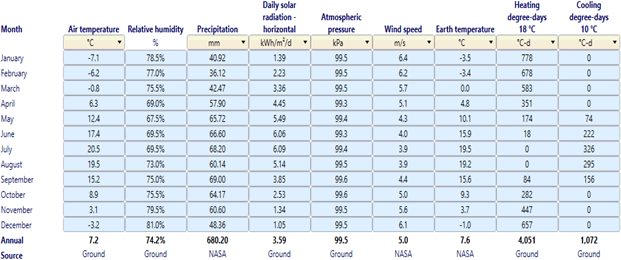
Meteorological or environmental data collection of the site is necessary to predict the performance of a photovoltaic system. The monthly solar radiation with the panels facing south. During the summer months, it is clear from the table that the solar energy incident on the site is high, where it ranges between 1-6 kWh/m2/day. Figure 2 shows the monthly average global horizontal radiation, monthly average relative humidity, monthly average atmospheric pressure, ambient temperature and monthly precipitation obtained from NASA.
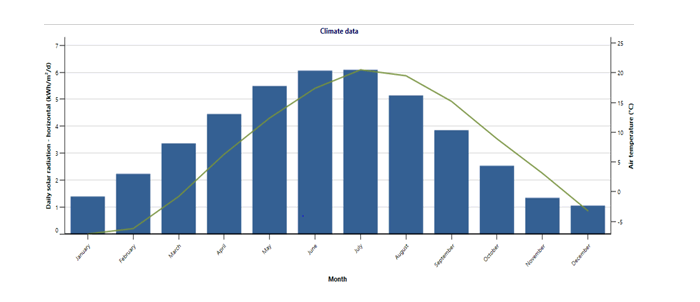
The photovoltaic modules are south facing and have a tilt angle of 20°. The graphical representation of the monthly global horizontal solar radiation and the monthly air temperature is shown in figure 3 [8].
Selection of photovoltaic module
Tata power solar system poly-silicon photovoltaic modules are selected for the power plant and have a rating of 300 Wp and 12 V. The technical specifications of the module at standard test conditions (Solar irradiance=1000 W/m2, Temperature of the cell=25°C, Air mass 1.5) are given in Table 1. The number of modules that can be used for a rooftop area of 8611 ft 2 is 266 (Table 1).
| Sl. No. | Parameter | Units | Values |
|---|---|---|---|
| 1 | Maximum power (Pmax) | W | 300 |
| 2 | Max. power voltage (Vpm) | V | 36.6 |
| 3 | Max. power current (Ipm) | A | 8.2 |
| 4 | Open circuit voltage (Voc) | V | 44.8 |
| 5 | Short circuit current (Isc) | A | 8.71 |
| 6 | Module efficiency (ŋ%) | % | 15.4 |
| 7 | Operating temperature range | °C | -40 to +85 |
Table 1: Technical specification of 300 Wp photovoltaic module.
For the best and efficient electricity generation, the photovoltaic modules are arranged as shown in Figure 4. The arrangement has 7 photovoltaic arrays and each array comprises 19 modules in series and 2 strings of 19 modules in parallel.
Selection of inverter
For the sizing of 80 kWp system in Toronto, we have considered ABB Inverter of 20 kWp. The number of inverters required for the system is 4. The specifications of the inverter used are shown in Table 2.
| Sl. No. | Parameter | Units | Values |
|---|---|---|---|
| DC Rating | |||
| 1 | Maximum Input Power DC | W | 20750 |
| 2 | Max. input voltage | V | 1000 |
| 3 | Max. input current | A | 50 |
| 4 | Max. input short circuit current | A | 30 |
| AC Rating | |||
| 1 | Start-up DC input voltage | V | 430 |
| 2 | Operating voltage range | V | 200-950 |
| 3 | Output power factor | 0.995 | |
| 4 | Max. output power | W | 22000 |
| 5 | Max. output current | A | 33 |
| 6 | Efficiency | % | 98.2 |
Table 2: Technical specification of 20 kW inverter.
Discussion
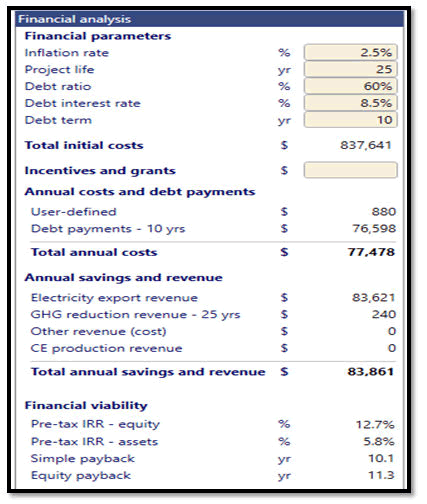
The proposed system is an 80 kW photovoltaic system and produces 97.5 MW/year. This shows that the design system has a good performance with varying parameters. The total cost of the system is $ 717,363. The installation cost and other miscellaneous costs is $ 120,278. The operation and maintenance cost of the system is $880/year. The total cost of the system is $ 837,641 the electricity sold to the grid is $ 83,621 The RET Screen energy model is shown in figure 4 [9].
Economic analysis
Typical financial figures for the analysis are provided by the utility: inflation of 2.5%, fuel cost escalation of 5.0%, debt ratio of 60%, debt interest rate of 8.5%, discount rate of 9%, and a debt term of 10 years. The utility does not pay income tax. Feasibility study, development and engineering costs are expected to be about 10% of the total project costs. The system is expected to last for 25 years. We assume that the PV system will be displacing a natural gas power plant. For GHG calculation the utility assumes that the value of avoided CO2 emissions will be around $25 per ton of CO2 equivalent. The financial analysis on the system is shown in figure 5 [10].
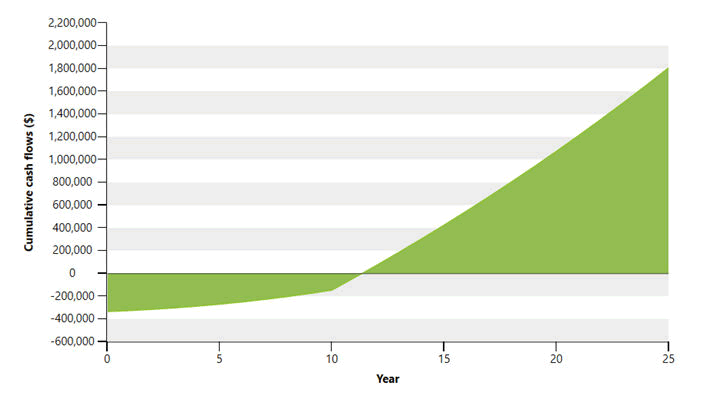
The total cost is calculated to be $77,478 and the total annual savings and revenue $83,861. The net cash flow from initial investment, operation and financing. The total of the three equals to the net cash flow for the period. A positive cumulative cash flow indicates the power plant is generating more cash than the mount spent. The initial years of the cumulative cash flow is negative which indicates the amount spent on the system is more than the amount being generated by the system. It takes nearly 12 years of project operation to start receiving pay back and the cumulative cash flows become positive. The graphical representation of the cumulative cash flow is shown in Figure 6.
In the future, due to the rapid depletion rate of fossil fuels, the cost of electricity would increase and therefore photovoltaic energy generation would be one of the solutions in household electrification. Moreover, photovoltaic systems generate cleaner energy as compared to the conventional utility grid.
Conclusion
Solar energy is considered the most propitious energy source due to their high reliability and safety. They are also an economic alternative to conventional energy. In this paper, a detailed methodology to design and simulate an 80 kW grid-connected photovoltaic rooftop system using RETScreen software. The results show that the maximum solar irradiation was achieved at a tilt angle of 20° with a value of 1005.89 W/m2. Furthermore, the photovoltaic system comprises 266 solar panels of 300 Wp and 4 inverters of 20 kW. A study in Toronto, Canada using a grid connected solar photovoltaic rooftop system is carried out. The paper presents the design and the performance analysis of the grid connected solar photovoltaic rooftop system. The result shows that a commercial user in Toronto using a grid connected solar photovoltaic rooftop system is beneficial and the performance of the system is up to the mark. The system is meeting the load demand of the household throughout the year and also produces excess energy which can be used by the user in the future. The development of photovoltaic systems implies that the capital cost of the systems decreases and their efficiency increases. Moreover, photovoltaic systems produce cleaner energy than conventional systems.
References
- Yadav P, Kumar N, Chandel SS (2015) Simulation and performance analysis of a 1kWp photovoltaic system using PVsyst. In 2015 International Conference on Computation of Power, Energy, Information and Communication, India. [Crossref][Google Scholar][Indexing At]
- Kandasamy CP, Prabu P, Niruba K (2013) Solar potential assessment using PVSYST software. In 2013 International Conference on Green Computing, Communication and Conservation of Energy, India. [Crossref][Google Scholar][Indexing At]
- Rout KC, Kulkarni PS (2020) Design and performance evaluation of proposed 2 kW solar PV rooftop on grid system in Odisha using PVsyst. In 2020 IEEE International Students' Conference on Electrical, Electronics and Computer Science, India. [Crossref][Google Scholar][Indexing At]
- Khandelwal A, Shrivastava V (2017) Viability of grid-connected solar PV system for a village of Rajasthan. In 2017 International Conference on Information, Communication, Instrumentation and Control, India. [Crossref][Google Scholar][Indexing At]
- Kumar NM, Kumar MR, Rejoice PR, Mathew M (2017) Performance analysis of 100 kWp grid connected Si-poly photovoltaic system using PVsyst simulation tool. Energy Procedia 117: 180-189. [Crossref][Google Scholar][Indexing At]
- Owolabi AB, Nsafon BE, Roh JW, Suh D, Huh JS, et al. (2019) Validating the techno-economic and environmental sustainability of solar PV technology in Nigeria using RETScreen Experts to assess its viability. Sustain Energy Technol Assess 36: 100542. [Crossref][Google Scholar][Indexing At]
- Karki P, Adhikary B, Sherpa K (2012) Comparative study of grid-tied photovoltaic (PV) system in Kathmandu and Berlin using PVsyst. Third Int Sustain Energy Technol 196-199. [Crossref][Google Scholar][Indexing At]
- Soualmia A, Chenni R (2016) Modeling and simulation of 15MW grid-connected photovoltaic system using PVsyst software. In 2016 International Renewable and Sustainable Energy Conference, Morocco. [Crossref][Google Scholar][Indexing At]
- Mansur TMNT, Baharudin NH, Ali R (2018) Design and performance analysis of solar PV DC power system for disaster relief centre using PVsyst. J Phys Conf Ser 1019: 012029. [Crossref][Google Scholar][Indexing At]
- Mirzahosseini AH, Taheri T (2012) Environmental, technical and financial feasibility study of solar power plants by RETScreen, according to the targeting of energy subsidies in Iran. Renew Sustain Energy Rev 16: 2806-2811. [Crossref][Google Scholar][Indexing At]
 Spanish
  Chinese
  Russian
  German
  French
  Japanese
  Portuguese
  Hindi
Hindi 