Short Communication, J Clin Nutr Metab Vol: 3 Issue: 1
Effects of Biotin Deficiency on the Urinary Excretion of B-Group Vitamins in Mice
Ai Tsuji1,2* and Katsumi Shibata1,3
1Department of Nutrition, School of Human Cultures, The University of Shiga Prefecture, Hikone, Shiga 522-8533, Japan
2Department of Food Science and Nutrition, Faculty of Human Life and Environment, Nara Woman’s University, Nara, 630-8506, Japan
3Department of Clinical Nutrition and Dietetics, Faculty of Clinical Nutrition and Dietetics Konan Women’s University, Kobe, Hyougo 658-0001, Japan
*Corresponding Author : Ai Tsuji
Department of Food Science and Nutrition, Faculty of Human Life and Environment, Nara Woman’s University, Nara, 630- 8506, Japan
Tel: +81-742-20-3460
Fax: +81-742-20-3460
E-mail: atsuji@cc.nara-wu.ac.jp
Received: July 18, 2018 Accepted: February 11, 2019 Published: February 15, 2019
Citation: Tsuji A, Shibata K (2019) Effects of Biotin Deficiency on the Urinary Excretion of B-Group Vitamins in Mice. J Clin Nutr Metab 3:1.
Abstract
Introduction: The eight kinds of B-group vitamins are involved with numerous metabolisms in harmony. Therefore, deprivation of one vitamin is likely to affect the pharmacokinetics and requirements of the other vitamins. Biotin has important roles, such as fatty acid synthesis, branched-chain amino acid catabolism, odd-chain fatty acid catabolism, and gluconeogenesis. We previously revealed that the urinary excretion rates of B-group vitamins decline when demand in the body increases. In the present study, we investigated the effects of biotin deficiency on the urinary excretion rates ((urinary excretion amount/intake amount) × 100) of other B-group vitamins.
Methods: ICR female mice were fed a 30% egg white diet with or without biotin. After feeding for 21 days, 24h urine samples were collected, and B-group vitamins were measured.
Results and conclusion: The urinary excretion rate of vitamin B1 was markedly lower in the biotin-deficient mice than in the control mice. These results suggest that biotin deficiency increased the requirement of vitamin B1 but did not affect the other six B-group vitamins.
Keywords: Biotin; Deficiency; Vitamin B1; Urine; Mice
Abbreviations
PIC: 4-Pyridoxic Acid; MNA: N1- Methylnicotinamide; 2-Py: N1-Methyl-2-Pyridone-5-Carboxamide; 4-Py: N1-Methyl-4-Pyridone-3-Carboxamide; Nam: Nicotinamide; ThDP: Thiamin Diphosphate; PC: Pyruvate Carboxylase; ACC: Acetyl-CoA Carboxylase; PCC: Propionyl-CoA Carboxylase; MCC: β-Methylcrotonyl-CoA Carboxylase; PDH: Pyruvate Dehydrogenase
Introduction
B-group vitamins function as coenzymes and gene expression regulation factors [1,2] in biogenics. Therefore, the intake of water-soluble vitamins affects by disease [3,4], metabolism, and requirements for nutrition [5-8].
We have started to investigate the effect of one vitamin deficiency on other vitamin requirements and metabolism. Biotin is a watersoluble vitamin classified among the B-group of vitamins. Biotin serves as a coenzyme for carboxylases. These carboxylases have important roles in gluconeogenesis, fatty acid synthesis, and branched-chain amino acid catabolism. It is difficult to cause biotin deficiency in people with a general dietary habit because biotin is abundant in various foods [9,10]. However, biotin deficiency has been reported in a substantial number of patients with chronic alcoholism [11-13], patients receiving long-term therapy with anticonvulsant agents [14- 16], individuals born with errors in biotin metabolism [17], and infants who are taking special infant formulas in Japan (for example, amino acid formulas) [18]. It has been reported that biotin deficiency affects folacin metabolism [19-21]. Puddu et al. [22] reported that the urinary excretion of vitamin B12 was not affected in rats fed a biotin-deficient diet for 60 days. To our knowledge, however, there are no other reports on the effect of a biotin-deficient diet on other B-group vitamins.
In the present study, we investigated how B-group vitamins are affected by biotin-deficient status.
Materials and Methods
Chemicals
Egg white solids and sucrose were purchased from Wako Pure Chemical Industries, Ltd. (Osaka, Japan). Corn oil was obtained from Ajinomoto (Tokyo, Japan). A mineral mixture (AIN-93-G-MX) [23], biotin-free vitamin mixture (AIN-93) [23], dextrin, and cellulose were obtained from Oriental Yeast Co., Ltd. (Tokyo, Japan). Thiamin hydrochloride (vitamin B1), thiamin diphosphate (ThDP), riboflavin (vitamin B2), nicotinamide, calcium pantothenate, pteroylglutamic acid (folic acid, used as folacin), cyanocobalamin (vitamin B12), and biotin were purchased from Wako Pure Chemical Industries, Ltd. 4-Pyridoxic acid (4-PIC, a catabolite of vitamin B6) manufactured by ICN Pharmaceuticals (Costa Mesa, CA, USA) was obtained from Wako Pure Chemical Industries. N1-Methylnicotinamide (MNA) (a catabolite of nicotinamide) chloride was from Tokyo Chemical Industry (Tokyo, Japan). N1-Methyl-2-pyridone-5-carboxamide (2- Py, a catabolite of nicotinamide) [24] and N1-methyl-4-pyridone- 3-carboxamide (4-Py, a catabolite of nicotinamide) [25] were synthesized as described. All other chemicals were of the highest purity available from commercial sources.
Mice and diets
Deficiency experiment: Female ICR mice (3 weeks old) were obtained from Charles River Laboratories (Tokyo, Japan), immediately divided into two groups (control group, n=6; biotin-deficient group, n=5), and housed in metabolic cages (LC-0335; CLEA Japan, Tokyo, Japan). The control mice were fed a 30% egg white diet as the control diet and the biotin-deficient mice were fed the biotin-deficient diet (Table 1) for 21 days. The 24 h urine samples were collected from 09:00-09:00 during the last days in amber bottles containing 1 mL of 1 mol/L HCL and were stored at-20°C until needed.
| Control diet (g/kg diet) |
Biotin-deficient diet (g/kg diet) | |
|---|---|---|
| Egg white solids | 300 | 300 |
| Gelatinized cornstarch | 309.3 | 309.3 |
| Sucrose | 154.2 | 154.2 |
| Corn oil | 80 | 80 |
| Dextrin | 50 | 50 |
| Cellulose | 50 | 50 |
| Choline bitartrate | 2.5 | 2.5 |
| Mineral mixture (AIN-93-G-MX)* | 42 | 42 |
| Biotin-free vitamin mixture (AIN-93)* | 12 | 12 |
| Biotin | 0.004 | - |
Table 1: Diet compositions [23].
Animals were allowed free access to food and water, and body weight was measured every two days. Food intake of mice was measured daily. Temperature was maintained at approximately 20°C with 60% humidity and a 12 h light/dark cycle (lights on at 6:00 and off at 18:00). The care and treatment of the experimental animals conformed to the guidelines for the ethical treatment of laboratory animals set by the University of Shiga Prefecture (Shiga, Japan) (Approval No. 26-3).
Measurement of B-group vitamins in urine
Vitamin B1, vitamin B2, vitamin B12, pantothenic acid, folacin, and biotin: Preparation and measurement of the extracts of vitamin B1, vitamin B2, vitamin B12, pantothenic acid, folacin, and biotin from urine were done as previously described [6]. Vitamin B1 was measured as thiamin and vitamin B2 was measured as riboflavin.
Vitamin B6: Vitamin B6 is excreted in urine as 4-PIC. The 4-PIC in urine was measured by high performance liquid chromatography (HPLC) using a previously described method [6].
Nicotinamide and its metabolites: Nicotinamide (Nam) [26], MNA [27], 2-Py [26], 4-Py [26], and Nam N-oxide [26] were described previously.
Calculation of urinary excretion rate of vitamins
Urinary excretion percentage of each vitamin was calculation by the following formula:
Urinary excretion of rate (%)=urinary excretion of each vitamin (nmol/d)/each vitamin intake (nmol/d) × 100.
Each vitamin intake was calculated by food intake on day 21 and each vitamin’s content in the vitamin mixture. Vitamin B2 is contained in egg white solids [28]. So, we calculated the urinary excretion percentage of vitamin B2 considering vitamin B2 coming from the egg white solids as 3.25 μmol riboflavin/100 g egg white solids [28].
Liver
Female ICR mice (3 weeks old) were obtained from Charles River Laboratories (Tokyo, Japan) and immediately divided into two groups (control group, n=5; biotin-deficient group, n=5) and housed in plastic cages (5/cage). The control mice were fed the 30% egg white diet as the control diet and the biotin-deficient mice were fed the biotin-deficient diet for 21 days (Table 1). On day 22, the mice were sacrificed and their livers were removed.
Measurement of biotin in liver: Frozen liver samples, approximately 0.5 g, were thawed, minced, and then added to 2 volumes of 2.25 mol/L H2SO4 and homogenized with a Teflon-glass homogenizer. The suspension was autoclaved at 121°C for 1 h to convert the bound form of biotin to the free form of biotin. After being cooled, the suspension was centrifuged at 10,000 × g for 10 min at 4°C, and supernatant was used for measuring biotin in the microbioassay method [6].
Measurement of vitamin B1 in liver
Liver contains conjugated forms of vitamin B1 such as the free form of vitamin B1 and ThDP. We measured the free form of thiamin and ThDP in the liver by HPLC as follows [29] with slight modification.
Frozen liver samples, approximately 0.5 g, were thawed, minced, and then added to 10 volumes of 5% trichloroacetic acid and homogenized with a Teflon-glass homogenizer. The acidified homogenate was centrifuged at 10,000 × g for 10 min at 4°C. The supernatant tissues (200 µL) were added to 40 µL of 1% cyanogen bromide and 80 µL of 5% NaOH. After 10 min at room temperature, 80 μL of 1.5 mol/L HCl was added for neutralization. The resulting supernatant was passed through a 0.45-µm Hydrophilic Durapore™ filter (PVDF; Millipore, Bedford, MA, USA). The filtrate (20 µL) was directly injected into an HPLC system to measure the level of thiochrome (thiamin-derived fluorescent compound) and thiochrome-diphosphate (ThDP-derived fluorescent compound). A Tosoh ODS-100S (15 × 3.2 mm, I.D., average particle size: 5 µm) column was used as a pre-column and a Tosoh ODS-100S (250 × 4.6 mm, I.D., average particle size: 5 µm) column was used as an analytical column. Thiochrome in samples was separated using the following mobile phase: 0.05 mol/L KH2PO4-K2HPO4 buffer (pH 7.0) containing 3% acetonitrile. Thiochrome-diphosphate in samples was separated by using following mobile phase: 0.05 mol/L KH2PO4-K2HPO4 buffer (pH 7.0) containing 1.5% acetonitrile. Flow speed was set at 1.0 mL/min. Fluorescence intensities were measured with an excitation wavelength of 375 nm and emission wavelength of 430 nm.
Statistical analyses
All data are indicated as average ± SE. The change in urinary excretion of vitamin B1 was analyzed by two-way ANOVA. Other data were analyzed by Student’s t-test. P<0.05 was considered significant. All statistical analyses were conducted using GraphPad Prism version 5.0 (GraphPad Software, Inc., San Diego, CA, USA).
Results
Effects of biotin deficiency on body weight and food intake
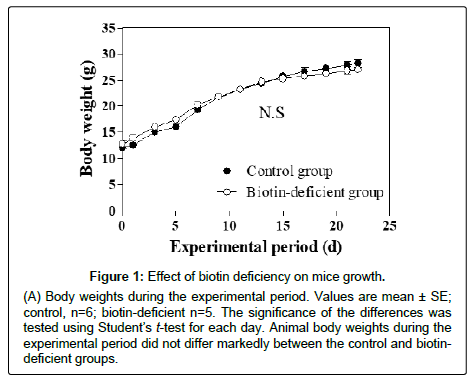
Changes in animal body weight (Figure 1) and food intake (Table 2) on the last day of the experiment did not differ markedly between the control and biotin-deficient groups. Liver weights in the biotin-deficient group were not affected by feeding on the biotin-deficient diet (Table 2).
| Control diet | Biotin-deficient diet | |
|---|---|---|
| Final body weight (g) | 28.5 ± 1.2 | 27.5 ± 0.5 |
| Food intake during the experiment (g/21 d) | 4.0 ± 0.4 | 3.9 ± 0.2 |
| Values are mean ± SE; control, n=6; biotin-deficient group, n=5. ***P<0.001; the significance of the differences was tested using Student’s t-test | ||
Table 2: Effect of biotin-free diet on body weight, food intake, and liver weight in mice.
Effect of biotin deficiency on the urinary excretion of B-group vitamins
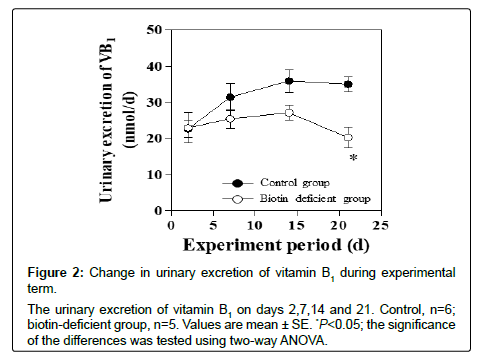
Table 3 shows the effects of biotin deficiency on the urinary excretion amounts of vitamin B1, vitamin B2 and biotin. Figure 2 shows the changes in urinary excretion amounts of vitamin B1 during the experiment.
Urinary excretion of vitamin B1 was 42% lower in the biotin-deficient group than in the control group on day 21 (Table 3).
| Control group | Biotin-deficient group | |
|---|---|---|
| Vitamin B1 (nmol/d) | 35.0 ± 2.1 | 20.2 ± 2.9** |
| Vitamin B2 (nmol/d) | 117 ± 3 | 105 ± 3* |
| 4-PIC, a catabolite of vitamin B6 (nmol/d) | 11.5 ± 2.6 | 19.8 ± 6.1 |
| Vitamin B12 (pmol/d) | 2.9 ± 0.4 | 3.0 ± 0.3 |
| Sum of Nam and its catabolites (μmol/d) | 2.29 ± 0.22 | 2.15 ± 0.39 |
| Pantothenic acid (nmol/d) | 310 ± 49 | 247 ± 54 |
| Folacin (nmol/d) | 5.2 ± 0.6 | 4.0 ± 1.0 |
| Biotin (nmol/d) | 14.5 ± 2.7 | 0.05 ± 0.01*** |
| Values are mean ± SE; control, n=6; biotin-deficient group, n=5. *P<0.05, **P<0.01, ***P<0.001; the significance of the differences was tested using Student’s t-test | ||
Table 3: Urinary excretion amounts of B-group vitamins on day 21 in mice.
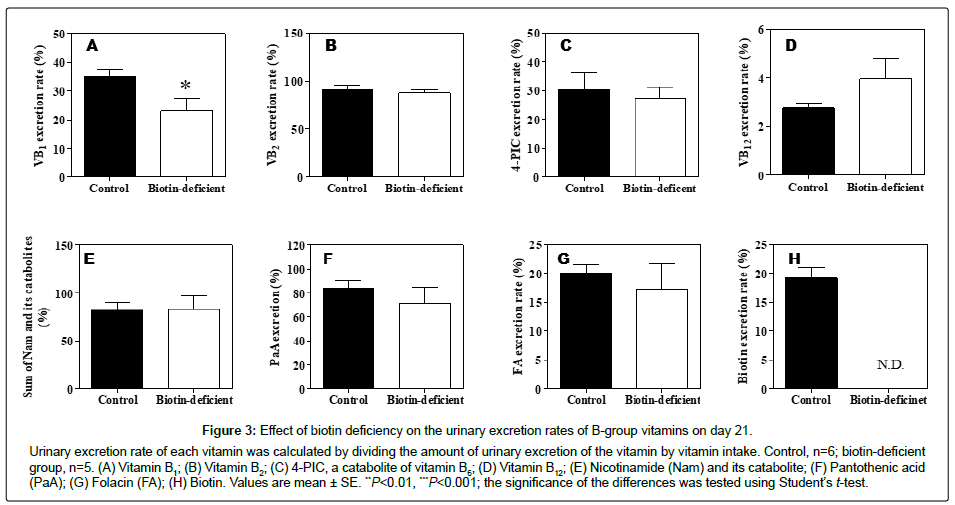
Figure 3 shows the urinary excretion rates of B-group vitamins when the animals were in biotin-deficient status. The urinary excretion rate of vitamin B1 was 32% lower in the biotin-deficient group than in the control group on day 21 (Figure 3A).
Urinary excretion of vitamin B2 was 11% lower in the biotin-deficient group than in the control group on day 21 (Table 3); however, the urinary excretion percentage of vitamin B2 did not differ between the control and biotin-deficient groups (Figure 3B).
The urinary excretion amounts of 4-PIC (a catabolite of vitamin B6), vitamin B12, sum of Nam and its catabolites such as MNA, 2-Py, and 4-Py, pantothenic acid, and folacin were not affected nor were the urinary excretion percentages affected (Table 3, Figure 3C-3G).
Vitamin B1 content in liver
The concentration of the free form of thiamin was lower in the biotin-deficient group than in the control group (Figure 4A). ThDP, which is the coenzyme form of vitamin B1, did not differ between the control mice and biotin-deficient mice (Figure 4B).
Discussion
Eight kinds of B-group vitamins are involved in numerous metabolisms in harmony. Therefore, deprivation of one vitamin from the eight is likely to affect the pharmacokinetics and requirements of the other vitamins. Biotin has important roles, such as fatty acid synthesis, branched-chain amino acid catabolism, odd-chain fatty acid catabolism, and gluconeogenesis. We previously reported that the urinary excretion rates of B-group vitamins declined when demand in the body increased [30,31]. This study investigated the effects of biotin deficiency on the urinary excretion rates of other B-group vitamins.
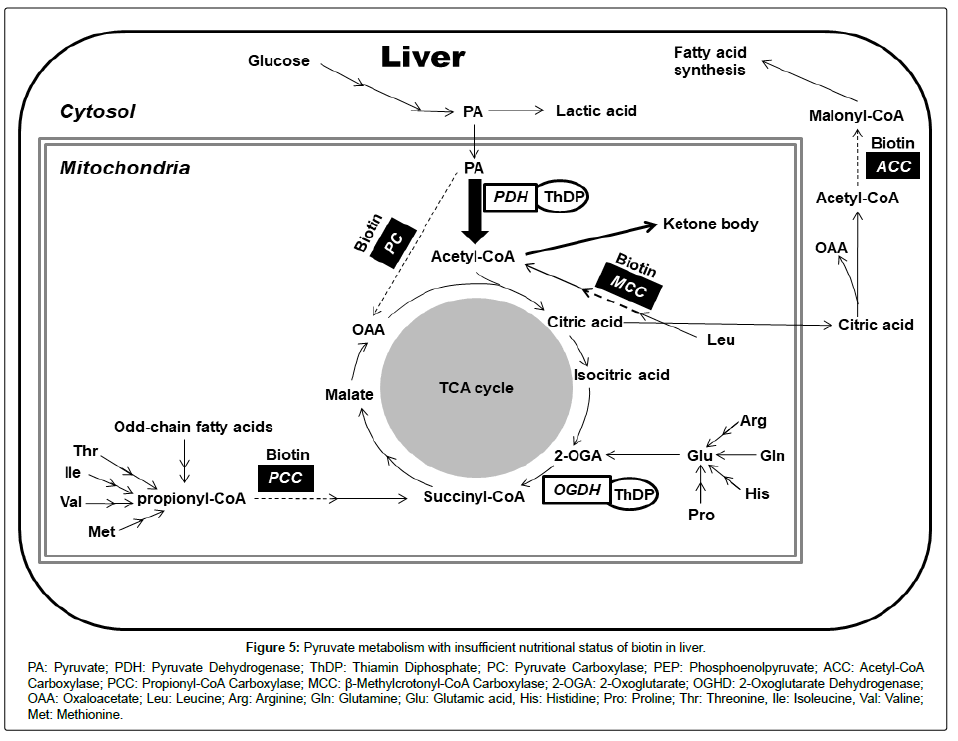
We demonstrated that feeding the biotin-deficient diet for 21 days markedly decreased the urinary excretion rate of vitamin B1 in ICR mice. The concentration of the free form of vitamin B1 in the liver was lower in the biotin-deficient mice than in the control mice. Nevertheless, the concentration of ThDP, a coenzyme of vitamin B1, was not different between the biotin-deficient and control mice. Generally, the free form of thiamin in the body reflects the amount of surplus of vitamin B1 [31,32]. The urinary excretion amounts of vitamin B6, vitamin B12, pantothenic acid, folacin, and niacin were not affected by the biotin deficiency. These results suggest that biotin deficiency increased the vitamin B1 requirement. A prolonged biotin-deficient status will induce vitamin B1 deficiency and ketosis (Figure 5).
Biotin is coenzyme of four kinds of carboxylases: pyruvate carboxylase (PC), acetyl-CoA carboxylase (ACC), propionyl-CoA carboxylase (PCC), and β-methylcrotonyl-CoA carboxylase (MCC). These four carboxylase activities decrease in biotin-deficient animals [33]. As a result, gluconeogenesis, fatty acid synthesis, branched-chain amino acid catabolism and odd-chain fatty acid catabolism are disordered in biotin-deficient animals (Figure 5). For reactions involving vitamin B1, many kinds of 2-oxo acids dehydrogenases and transketolase are well known. The metabolism of pyruvate is the sole reaction that concerns both biotin and vitamin B1. PC is an enzyme that metabolizes pyruvate to oxaloacetate and is a key enzyme in gluconeogenesis, as well as being an important anaplerotic reaction for maintenance of an adequate supply of oxaloacetate for citrate cycle activity. In biotin-deficient animals, PC activity decreases in the liver and pyruvate accumulates [34,35]. The accumulated pyruvate should be metabolized to oxaloacetate, acetyl CoA, or lactate. In biotin-deficient animals, the PC reaction is decreased, so that much more pyruvate is metabolized to acetyl-CoA or lactate. Pyruvate dehydrogenase (PDH) is the enzyme that can metabolize pyruvate to acetyl CoA. PDH needs vitamin B2, niacin, and pantothenic acid as well as vitamin B1 as coenzymes. But, the urinary excretion amounts of vitamin B2, pantothenic acid, and niacin were not affected by biotin deficiency. The present study suggests that the pyruvate decarboxylase reaction, which needs ThDP as a coenzyme, is the rate-limiting step in whole PDH reaction. Thus, the demand of vitamin B1 as cocarboxylase must increase in a biotin-deficient state. The excess acetyl-CoA is converted to ketone bodies.
Although vitamins B2, pantothenic acid, niacin are associated with whole PDH reaction, urinary excretion percentage of these vitamins did not change in the biotin deficient group in our study. Vitamin B1 is a vitamin that is more easier to deficiency than other vitamins because vitamin B1 pool is small [30,36-39]. Accumulations of vitamin B2, pantothenic acid and niacin in liver are 3 to 50 times higher than vitamin B1 [30,40]. Therefore we considered that the impact of biotin deficiency did not appear markedly for the nutrient of vitamin B2, pantothenic acid and niacin. It has been reported that urinary excretion of folic acid was decreased in the biotin deficient rats were fed the biotin free diet for approximately 60 days [19-21]. In our study, FA level on urine did not affected by the biotin deficiency. We fed the biotin deficient diet to mice for 21 days. We considered that urinary folic acid level did not decrease in the biotin deficient group because the experiment term was short. In actuality, the urinary excretion percentage of folic acid was decreased in mice fed biotin deficit diet for 35 days (control group: 21.6 ± 1.6%, biotin deficient group: 12.2 ± 3.3%, p<0.05).
Conclusion
Biotin deficiency has been reported in a substantial number of patients with chronic alcoholism [11-13], patients on long-term parenteral nutrition, patients receiving long-term therapy with anticonvulsant agents [14-16], individuals born with errors in biotin metabolism [17], and infants who are taking special infant formulas in Japan (for example amino acid formulas [18]. These people might have a vitamin B1 deficiency. PDH activity is markedly lower in the vitamin B1 deficient animal [36], so pyruvate accumulates in the body. Therefore, vitamin B1 deficiency might be hidden by biotin deficiency, and biotin deficiency might be exacerbated by vitamin B1 deficiency.
Authors’ Disclosure
The authors have no conflicts of interest to declare.
Acknowledgments
This study was part of the project “Nutritional studies on B-group vitamins” (Principal investigator: Katsumi Shibata), which was supported by the Public Utility Foundation for the Vitamin and Biofactor Society. This work was conducted at the Department of Nutrition, School of Human Cultures, University of Shiga Prefecture.
Authors’ Contributions
AI and KS designed the study. AI and KS drafted the manuscript. AI performed the experiments. All authors read and approved the final manuscript.
References
- Pacheco AD, Solórzano VRS, Del RAL (2002) Biotin in metabolism and its relationship to human disease. Arch Med Res 33: 439-447.
- Oka T (2001) Modulation of gene expression by vitamin B6. Nutr Res Rev 14: 257-266.
- Thornalley PJ, Babaei JR, Al AH, Rabbani N, Antonysunil A, et al. (2007) High prevalence of low plasma thiamine concentration in diabetes linked to a marker of vascular disease. Diabetologia 50: 2164-2170.
- Miyake K, Akimoto T, Kusakabe M, Sato W, Yamada A, et al. (2013) Water-soluble vitamin deficiencies in complicated peptic ulcer patients soon after ulcer onset in Japan. J Nutr Sci Vitaminol 59: 503-508.
- Shibata K, Inomoto K, Nakata C, Fukuwatari T (2013) Pantothenic acid deficiency may increase the urinary excretion of 2-oxo acids and nicotinamide catabolites in rats. J Nutr Sci Vitaminol 59: 509-515.
- Shibata K, Hirose J, Fukuwatari T (2014) Relationship Between urinary concentrations of nine water-soluble vitamins and their vitamin intakes in japanese adult males. Nutr Metab Insights 7: 61-75.
- Shibata K, Kobayashi R, and Fukuwatari T (2015) Vitamin B1 deficiency inhibits the inceased conversion of tryptophan to nicotinamide in severe food-restricted rats. Biosci Biotechnol Biochem 79: 103-108.
- Shibata K, Shimizu A, Fukuwatari T (2013) Vitamin B1 Deficiency does not affect the liver concentrations of the other seven kinds of B-group vitamins in rats. Nutr Metab Insights 6: 1-10.
- Taniguchi A, Takechi A, Fukushima A, Watanabe T (2008) Biotin content of typical foods in Japan. J Jpn Soc Nutr Food Sci 61: 27-37.
- Ministry of Education, Culture, Sports, Science and Technology, Japan. (2010) Standard Tables of Food Composition in Japan 2010.
- Fennelly J, Frank O, Baker H, Leevy CM (1964) Peripheral Neuropathy of the Alcoholic: I, Aetiological Role of Aneurin and Other B-complex Vitamins. Br Med J 2: 1290-1292.
- Bonjour JP (1980) Vitamins and alcoholism. V. Riboflavin, VI. Niacin, VII. Pantothenic acid and VIII. Biotin. Int J Vitam Nutr Res 50: 425-440.
- Subramanya SB, Subramanian VS, Kumar JS, Hoiness R, Said HM (2011) Inhibition of intestinal biotin absorption by chronic alcohol feeding: Cellular and molecular mechanisms. Am J Physiol Gastrointest Liver Physiol 300: G494-G501
- Krause KH, Kochen W, Berlit P, Bonjour JP (1984) Excretion of organic acids associated with biotin deficiency in chronic anticonvulsant therapy. Int J Vitam Nutr Res 54: 217-222.
- Krause KH, Bonjour JP, Berlit P, Kochen W (1985) Biotin status of epileptics. Ann N Y Acad Sci 447: 297-313.
- Rathman SC, Eisenschenk S, McMahon RJ (2002) The abundance and function of biotin-dependent enzymes are reduced in rats chronically administered carbamazepine. J Nutr 132: 3405-3410
- Zempleni J, Hassan YI, Wijeratne SS (2008) Biotin and biotinidase deficiency. Expert Rev Endocrinol Metab 3: 715-724.
- Fujimoto W, Inaoki M, Fukui T, Inoue Y, Kuhara T (2005) Biotin deficiency in an infant fed with amino acid formula. J Dermatol 32: 256-261.
- Pasquali P, Landi L, Marchetti M (1968) Interrelationships between folic acid and biotin: Effect of biotin on the biosynthesis of folate coenzymes. Biochim Biophys Acta 165: 561-563.
- Marchetti M, Pasquali P, Landi L (1966) Studies on relationships between biotin and folic acid. Int Z Vitaminforsch 36: 302-307.
- Nair CP, Noronha JM (1974) Studies on the metabolic interrelationship between biotin and folic acid in rats. J Nutr Sci Vitaminol 20: 243-247.
- Puddu P, Marchetti M (1965) The effect of vitamin B12 and biotin on the metabolism of vitamin B12 in biotin-deficient rats. Biochem J 96: 24-27.
- Reeves PG (1997) Components of the AIN-93 diets as improvements in the AIN-76A diet. J Nutr 127: 838S-841S.
- Pullman ME, Colowick SP (1954) Preparation of 2- and 6-pyridones of N1-methylnicotinamide. J Biol Chem 206: 121-127.
- Shibata K, Kawada T, Iwai K (1998) Simultaneous micro-determination of nicotinamide and its major metabolites, N1-methyl-2-pyridone-5-carboxamide and N1-methyl-4-pyridone-3-carboxamide, by high-performance liquid chromatography. J Chromatogr 424: 23-28.
- Maeta A, Sano M, Fukuwatari T, Shibata K (2014) Simultaneous measurement of nicotinamide and its catabolites, nicotinamide N-oxide, N1- methyl-2-pyridone-5-carboxamide, and N1-methyl-4-pyridone-3-carboxamide, in mice urine. Biosci Biotechnol Biochem 78: 1306-1309.
- Shibata K (1987) Ultramicro-determination of N1-methylnicotinamide in urine by high performance liquid chromatography. Vitamins 61: 599-604.
- Gliszczyńska-Swigło A, Koziołowa A (2000) Chromatographic determination of riboflavin and its derivatives in food. J Chromatogr A 881: 285-297.
- Iwata H, Matsuda T, Tonomura H (1988) Improved high-performance liquid chromatographic determination of thiamine and its phosphate esters in animal tissues. J Chromatogr 26: 317-323.
- Shibata K, Sugita C, Sano M, Fukuwatari T (2013) Urinary excretions of B-group vitamins reflect the nutritional status of B-group vitamins in rats. JNutr Sci 2: e12.
- Shibata K, Fukuwatari T (2013) The body vitamin B1 levels of rats fed a diet containing a minimum requirement of vitamin B1 is reduced by exercise. J Nutr Sci Vitaminol 59: 87-92.
- Shibata K, Fukuwatari T (2013) Values for evaluating the nutritional status of water-soluble vitamins in humans. JIOMICS 3: 51-59.
- Suchy SF, Wolf B (1986) Effect of biotin deficiency and supplementation on lipid metabolism in rats: Cholesterol and lipoproteins. Am J Clin Nutr 43: 831-838.
- Hernández VA, Ochoa RE, Ibarra GI, Ortega CD, Salvador AA, et al. (2012) Temporal development of genetic and metabolic effects of biotin deprivation. A search for the optimum time to study a vitamin deficiency. Mol Genet Metab 107: 345-351.
- Deodhar AD, Mistry SP (1969) Restoration of gluconeogenesis in biotin-deficient rats. Arch Biochem Biophys 131: 507-512.
- Tsuji A, Nakamura T, Shibata K (2017) Effects of mild and severe vitamin B1 deficiencies on the meiotic maturation of mice oocytes. Nutr Metab Insights 10: 1-9.
- Adams DH (1955) Liver catalase in the riboflavin-deficient mouse. Biochem J 60: 568-572.
- Fukuwatari T, Yoshida E, Takahashi K, Shibata K (2010) Effect of fasting on the urinary excretion of water-soluble vitamins in humans and rats. J Nutr Sci Vitaminol 56: 19-26.
- Imai E, Sano M, Fukuwatari T, Shibata K (2013) Changes in B-group vitamin status in adenine-induced chronic renal failure rats. Biosci Biotechnol Biochem 77: 1108-1110.
- Trebukhina RV, Ostrovsky YM, Petushok VG, Velichko MG, Tumanov VN (1981) Effect of thiamine deprivation on thiamine metabolism in mice. J Nutr 111: 505-513.
 Spanish
  Chinese
  Russian
  German
  French
  Japanese
  Portuguese
  Hindi
Hindi 