Spanish
  Chinese
  Russian
  German
  French
  Japanese
  Portuguese
  Hindi
Hindi Research Article, J Immunol Tech Infect Dis Vol: 7 Issue: 1
Mathematical Model of Zoonotic Influenza Subtype A (H7N9) Spread in Human Population
Sinha DN*
Department of Mathematics, Temple University, Philadelphia, USA/Strayer University, Online Division, USA
*Corresponding Author : Durgesh Nandini Sinha
Department of Mathematics, Temple University, Philadelphia, USA/ Strayer University, Online Division, USA
Tel: 1+ 309-533-1851
E-mail: durgesh.sinha4@gmail.com
Received: February 20, 2018 Accepted: March 01, 2018 Published: March 05, 2018
Citation: Sinha DN (2018) Mathematical Model of Zoonotic Influenza Subtype A (H7N9) Spread in Human Population. J Immunol Tech Infect Dis 7:1. doi: 10.4172/2329-9541.1000158
Abstract
This paper deals with the dynamics of human infection by zoonotic influenza of type H7N9 both in birds and in humans. A mutation to the virus can increase the infectiousness of zoonotic influenza and its risk to become pandemic influenza. We have formulated a mathematical model of avian influenza’s effect on the human and bird population. A basic reproduction number for both the human and bird population has been computed, 0 h R and 0 1 b R > respectively, therefore we have proved that the model is locally and globally asymptotically stable for disease –free equilibrium points when basic reproduction number for both population is <1. Also proven is the endemic equilibrium point, which is globally asymptotically stable in the bird population when 0 1 b R > . Extensive numerical simulations and sensitivity analysis are carried out for various parameters of the model. The effects of Vaccination, Sequestration and Recovery are critically analyzed and divide into their respective classes.
Keywords: Epidemic model; Zoonotic influenza; Subtype a H7N9; Stability; Human Population; Bird population
Introduction
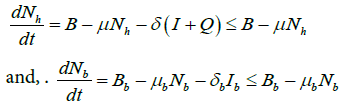
Millions of people impacted by seasonal flu every year. The first massive outbreak of pandemic influenza occurred in 1918, and 1957, and 20 million humans died [1]. The first outbreak of avian influenza subtype A (H7N9) was reported in Eastern China, in 2013 [2]. In 2013, human infections with the LPAI A (H7N9) virus were reported in China. Since then, the virus has spread in the poultry population across the country and resulted in several hundred human cases and many human deaths one imported case is reported in Canada, and one imported case in South Colombia [2]. The total number of cases reported from 2013 to August, 2017 is 1258 of which 460 died [3]. Aquatic birds are the primary natural reservoir for most subtypes of influenza A viruses. Most cause asymptomatic or mild infection in birds, where the range of symptoms depends on the virus properties. Viruses that cause severe disease in birds and result in high death rates are called highly pathogenic avian influenza (HPAI). Viruses that cause outbreaks in poultry but are not generally associated with severe disease are called low pathogenic avian influenza (LPAI). For human infections with the A (H7N9) virus, incubation period ranges from 1 to 10 days, with an average of 5 days [3]. In many patients infected by A (H5) or A (H7N9) avian influenza viruses, the disease has an aggressive clinical course. Common initial symptoms are high fever (greater than or equal to 38°C) and cough. Signs and symptoms of lower respiratory tract involvement including dyspnea or difficulty breathing have been reported. Upper respiratory tract symptoms such as sore throat or coryza are less common. Other symptoms such as diarrhea, vomiting, abdominal pain, bleeding from the nose or gums, and chest pain have also been reported in the clinical course of some patients. Complications of infection include hypoxemia, multiple organ dysfunction, and secondary bacterial and fungal infections. The case fatality rate for A (H5) and A (H7N9) subtype virus infections among humans is much higher than that of seasonal influenza infections [3].
The majority of human cases of A (H5N1) and A (H7N9) infection have been associated with direct or indirect contact with infected live or dead poultry. Controlling the disease in the animal source is critical to decrease risk to humans. Although H7N9 has potential to evolve in a global threat, right now it has one severe limitation that restricts its potential to spread: The virus doesn’t transmit easily between people. About 90 percent of people catch the virus by handling poultry. But person-to-person transmission is possible. During 2017, there were 14 clusters of cases in which a person passed the disease to at least one other person [4].
As H7N9 has got high priority of public health problem in China, and most possibility of serious threat of spreading out to neighboring country or pandemic due to globalization of world market. The effects of different intervention, strategies, such as quarantine and vaccination, need to be investigated for the pandemic awareness plans that maximize practically, simplification and correctness. In this paper, in order to study the dynamics of human infection by avian influenza (H7N9). We have present the Susceptible Exposed Infected Quarantine Recovered and Vaccinated (SEIQRV) model for human population, and Susceptible Exposed and Infected (SIR) for bird population. There are few epidemic models on Zoonotic Influenza Subtype A (H7N9) has been formulated in last 4 years. Zhifei Liu et al. has developed SIR model for both human and poultry to evaluate the screening and culling of infected poultry on the evolution of the H7N9 epidemic [5].
The paper is organized as follows: Introduction is given in Section 1, the basic assumptions and parameters of the model is discussed (Figures 1, 1a and 1b), and the epidemic model is developed in Section 2, Section 3 establishes the stability of the system developed, numerical simulations is given in Section 4, and finally conclusion in Section 5.

Figure 1: Schematic flow of avian influenza.

Figure 1a: The graph shows the changes in values between Recovered Class of Humans versus Infected Class of Humans.

Figure 1b: We have varied both infectivity rate from 1% to 90% in human population from exposed class to infected class, and infectivity rate from 57% to 99% in bird population from exposed class to infectivity class to see dynamics of infected-recovered phase plane. The trajectory shows as the infectivity rate increases in both population, more human population moving to infected class, and it shows diseases free equilibrium.
Model parameters and its formulation
We divide the human population into six classes SEIQRV (Susceptible-Exposed-Infected-Quarantined-Recovered-Vaccinated) and the bird population into three classes SbEbIb (Susceptible- Exposed-Infected).
Schematic flow of this model is shown in Figure 2 and the state variables and associated parameters of this model are given in Table 1.
| S(t): Susceptible humans in time t | E(t): Exposed humans in time t |
| I(t): Infectious humans in time t | Q(t): Quarantined humans in time t |
| R(t): Recovered humans in time t | V(t): Vaccinated humans in time t |
| Sb(t): Susceptible birds in time t | Eb(t): Exposed birds in time t |
| Ib(t): Infectious birds in time t | Nh(t): Total human population in time t |
| Nb(t): Total bird population in time t | B: Birth rate of humans |
| Bb: Birth rate of birds | β: Infectivity of avian and mutant influenza from human-to-human |
| βb: Infectivity of avian influenza from bird-to-bird | βbh: Infectivity of avian influenza from bird-to-human |
| η: Rate of transmission from exposed to infected humans | γ: Rate of transmission from infected to quarantined humans |
| α: Rate of transmission from quarantined to recovered humans | σ: Rate of transmission from susceptible to vaccinated humans |
| ρ: Rate of transmission from vaccinated to susceptible humans | ξ: Rate of transmission from infected to recovered humans |
| ε: Rate of transmission from recovered to susceptible humans | χ: Rate of transmission from exposed to infected birds |
| μ: Natural death rate of humans | δ: Death rate of humans due to avian influenza |
| μb: Natural death rate of birds | δb: Death rate of birds due to avian influenza |
Table 1: The state variables and associated parameters.

Figure 2: a and b: It shows the Schematic flow model of Susceptible-Exposed-Infected-Quarantined-Recovered-Vaccinated and the bird population into three classes SbEbIb (Susceptible-Exposed-Infected).
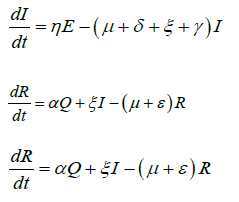
Model equations for human’s population
Based on the flow of transmission of avian influenza in human population as depicted in Figure 2, we have the following system of equations:
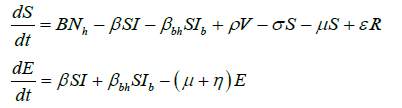
 (2)
(2)

Similarly, for the flow of transmission of avian influenza in birds population, we have the system of equations as:
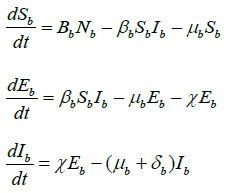 (2)
(2)
 (3)
(3)
Stability of the model
In this section, we find the basic reproduction number and stability of the model. We prove that our model is locally and globally stable for both disease-free-equilibrium and endemic equilibrium points.
Since all our model parameters are positive or non-negative, it is important to show that all state variables remain positive or nonnegative for all positive initial conditions for t ≥0 . From our model equation, we have
The closed set
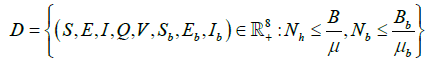 (4)
(4)
is a feasible region of the model?
Theorem 1 states that the closed set D is bounded and positive invariant.
Proof: Since 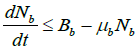
so Nb is bounded above by. ![]()
Hence 
Whenever  .
.
On simplification, we have
As ![]()
and so 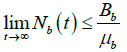 .
.
The other case is similar. Thus, D is bounded and positively invariant in ![]() .
.
Basic reproduction number
For any epidemic model, the basic reproduction number is the average number of secondary infectious cases produced by a single infection in total susceptible population.
The basic reproduction number is calculated by R0=ρ(FV-1), where ρ is spectral radius of the matrix FV-1 and F & V are the matrices of new infection terms and the remaining transmission terms respectively [6,7].
For the systems (1) and (2), the matrices F and V are as follows:
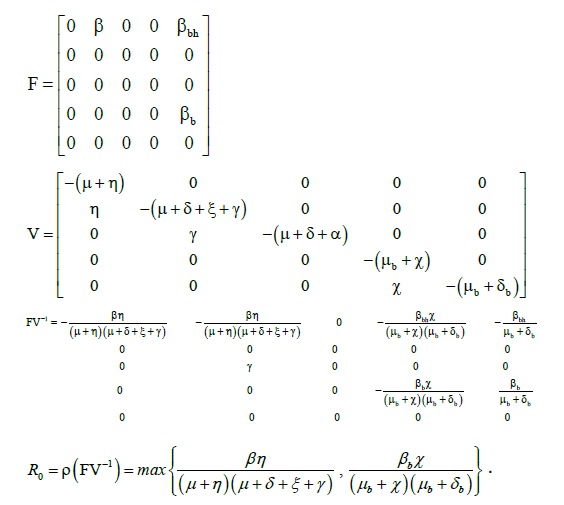
The basic reproduction number for human population ![]() and bird population
and bird population ![]() are given by
are given by
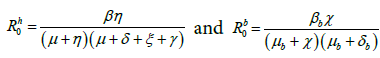 respectively.
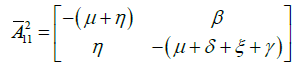
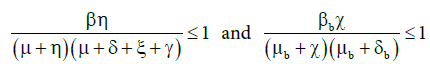
Theorem 2 states that he systems (1) and (2) are locally asymptotically stable for disease-free equilibrium, when ![]() and
and
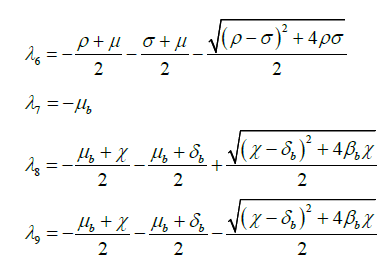
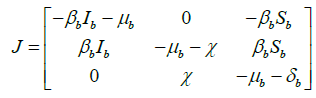
Proof: Jacobian matrix of the system (1) and (2) is as follows:
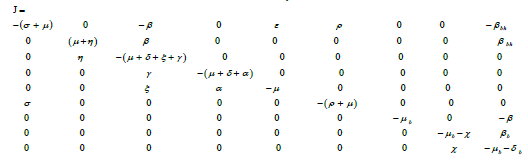
The eigenvalues of Jacobian matrix J are as follows:
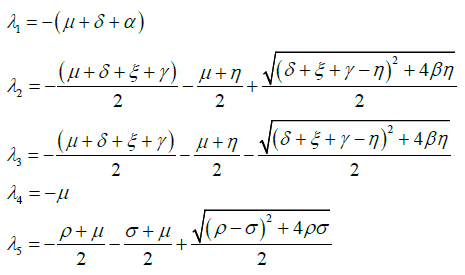
Eigenvalues λ1,λ3,λ4,λ6,λ7,λ9 have negative real value and on simplifying λ5, we get λ5= -μ.
We can easily verify that the eigenvalue λ2 < 0, when![]() and λ8 < 0, when
and λ8 < 0, when ![]()
Hence all eigenvalues of Jacobian matrix J are negative when ![]() and
and ![]() .
.
This proves that the system of SEIQRV for human population and the system of SEI for bird population are locally asymptotically stable when ![]() and
and ![]() .
.
Global stability of disease-free equilibrium
We show the global stability of the model using the method given by Kamgang and Sallet [8]. In this method, to show global stability, the model has to satisfy the five hypotheses, which has been summarized briefly in Appendix Theorem 3 states that the system (1) and (2) are globally stable for disease-free equilibrium when ![]() and
and ![]() .
.
Proof: We have shown above that ![]() is bounded and positively invariant in
is bounded and positively invariant in ![]() , where the hypotheses A1 and A2 are satisfied.
, where the hypotheses A1 and A2 are satisfied.
In our model, X1 = (S,V,Q,R,Sb) and X2 = (E,I,Sb,Ib) The matrix A2(x) is given by
As required by hypothesis A3, for any ![]() the matrix is irreducible.
the matrix is irreducible.
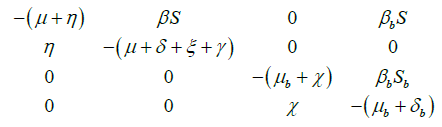
Now, for hypothesis A4, there is a maximum and uniquely realized in ![]() if S=1 and Sb=1 at DFE. This maximum matrix is J2, the block of the Jacobian at DFE, corresponding to the matrix A2(x) is given by
if S=1 and Sb=1 at DFE. This maximum matrix is J2, the block of the Jacobian at DFE, corresponding to the matrix A2(x) is given by
For the hypothesis A4 the diagonal block matrix ![]() and
and ![]() are bounded by the matrices
are bounded by the matrices
 and
and 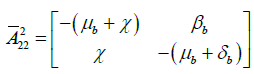 , which are maximum. This maximum is realized at each point of manifolds
 ![]() and
and ![]() . This implies that these points belong to the manifold with equations E = I = Eb = Ib = 0. Thus, the hypothesis A4 is satisfied.
. This implies that these points belong to the manifold with equations E = I = Eb = Ib = 0. Thus, the hypothesis A4 is satisfied.
Now for the hypothesis A5, the condition ![]() and
and ![]() can be expressed as:
can be expressed as:
 . Thus, the hypothesis A5 is equivalent to
 ![]() and
and![]() .
.
This proves that the model is globally stable for disease-free equilibrium when ![]() and
and![]() .
.
Endemic equilibrium
We assume the endemic equilibrium points of system (2) are ![]()
Using equation (3), we have for endemic equilibrium point,  .
.
On simplification, we get
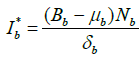 .
.
Now, applying  and putting the above value of
 ![]() , we get
, we get
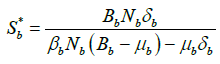 .
.
Similarly, applying  and putting the above value of
 ![]() , we get
, we get
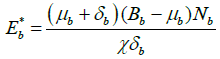 .
.
So, the endemic equilibrium points of system (2) are as follows:
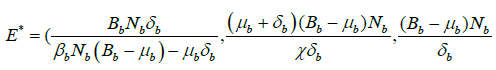 .
.
Theorem 4 states that the unique endemic equilibrium point E* is globally asymptotically stable if ![]() .
.
Proof: We will prove the global stability of endemic equilibrium E* using geometric approach [9,10], which has been attached briefly in Appendix 2. The sufficient conditions for the global stability are shown in the hypothesis (H1) and (H2) with the Bendixson criteria given in Theorem (Appendix 2).
For the general solution ![]() of system (2), the Jacobian matrix is
of system (2), the Jacobian matrix is
 .
.
The matrix J[2], the second additive compound matrix of the jacobian for n=3, is defined as
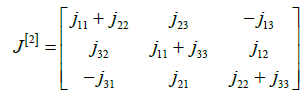 .
.
So, its second additive compound matrix J[2] is
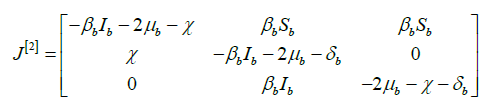
Let the function P = P (Sb,Eb,Ib) be defined as
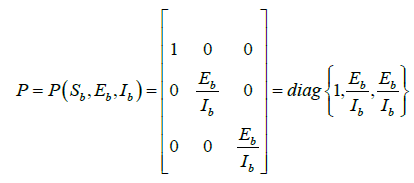
Then, 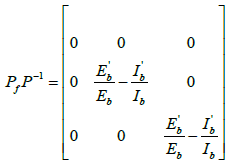 , where Pf is the matrix obtained by replacing each elements of P by its derivative in the direction of f.
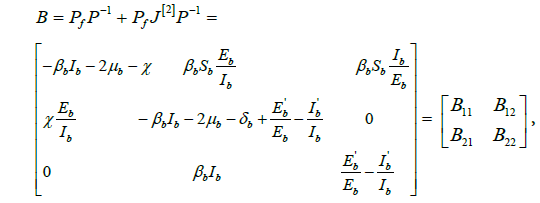
where 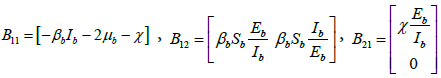 and
and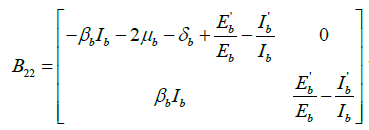 .
.
Now, for a vector (u, v, w) in R3, we select a norm as ![]() and denote L the Lozinskii measure for this norm. So,
and denote L the Lozinskii measure for this norm. So, ![]() , where k1 and k2 are defined as follows:
, where k1 and k2 are defined as follows:
![]() , where B12 and
, where B12 and ![]() are matrix norms with respect to the vector norm L1 and L1 denotes the Lozinskii measure with respect to the vector norm L1. So, We have
are matrix norms with respect to the vector norm L1 and L1 denotes the Lozinskii measure with respect to the vector norm L1. So, We have
![]() , (by putting
, (by putting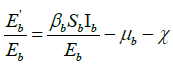 from model equation of exposed class in bird population (2).
This implies that 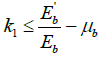 .
.
Similarly, 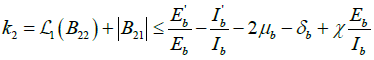 .
.
Putting 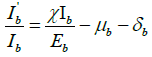 from model equation of infected class in bird population (2), we have,
 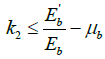 .
.
Hence, 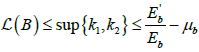 and so,
 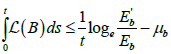 .
.
So, ![]() , and hence the Bendixson criteria is also satisfied, which thus proves the global stability of the endemic equilibrium.
, and hence the Bendixson criteria is also satisfied, which thus proves the global stability of the endemic equilibrium.
Numerical simulations and effect of parametric values
In this section, using Runge-kutta-Fehlberg method of order 4 and 5, we numerically simulate our system (1) and (2) with real parametric values as given in (Table 2) and also establish the stability of models by taking different examples. MATLAB is used to simulate the systems.
| Parameter | Value |
| β_bh | 0.2 |
| β_b | 0.4 |
| β | 0.12 |
| B | 0.03, 12.2/1000(China) |
| Bb | .5 |
| η | 0.5 |
| γ | 0.5 |
| α | 0.6 |
| ξ | 0.5 |
| μ | 0.008, 7.44/(1000) (China) |
| σ | 0.1 |
| δ | 0.37 |
| ε | 0.05 |
| ρ | 0.08 |
| μb | 1/100 |
| χ | 0.6 |
| δb | 0.5 |
Table 2: Parametric values for systems (1) and (2) [11,12,13,14].
Example1: Consider the different rate of transmission of human from exposed class to infected class (η) from 0.01 to 0.95, rate of transmission of bird from exposed class to infected class (χ) from 0.57 to 0.99, and the parametric value given in the (Table 2) to stabilize the case the three situations shown in (Figure 1a, 1b, 1c) [11-14].
Figure 1a has basic reproduction number R0h=0.0857 <1 for η=0.5, and R0b=0.770 to 0.776 <1 for χ=0.57 to χ=0.96 respectively. To show the global stability of diseases free equilibrium point in both human and bird class, when ![]() and
and ![]() , in infected-recovered phase plane, we consider the global dynamics of the trajectory towards the diseases free equilibrium point. From (Figure 2a) we observe that the nature of trajectory tends to diseases-free equilibrium point from any initial point for constant infectivity rate 50% in human population from exposed class to infected class, and range of infectivity rate in bird population from exposed class to infected class range from 57% to 96%, which shows the global stability of diseases -free equilibrium point when basic reproduction number is less than 1.
, in infected-recovered phase plane, we consider the global dynamics of the trajectory towards the diseases free equilibrium point. From (Figure 2a) we observe that the nature of trajectory tends to diseases-free equilibrium point from any initial point for constant infectivity rate 50% in human population from exposed class to infected class, and range of infectivity rate in bird population from exposed class to infected class range from 57% to 96%, which shows the global stability of diseases -free equilibrium point when basic reproduction number is less than 1.
Example 3: Consider the infected-quarantined phase plane of human population to compare the both simulated and country-wise world population of human classes when ![]() and η=.01 to 0.95 and γ=.45 to .95.
and η=.01 to 0.95 and γ=.45 to .95.
In Figure 3a, we have plotted the infected and quarantined class for different values of eta, from =0.01 to η=0.95 and γ=0.5. In this case, the basic reproduction number R0h=0.05nd R0h=0.19 for η=0.01 and η=0.95 respectively.

Figure 3a: We have plotted the infected and quarantined class for different values of eta, from =0.01 to η=0.95 and γ=0.5. In this case, the basic reproduction number R0h=0.05nd R0h=0.19 for η=0.01 and η=0.95 respectively.
In (Figure 3b) we have plotted the infected and quarantined class for different parameter values of γ, from γ=0.45 to γ=0.95 and η=0.5. In this case, the basic reproduction number is R0h=0.086 for all the above values of γ.

Figure 3b: We have plotted the infected and quarantined class for different parameter values of γ, from γ=0.45 to γ=0.95 and η=0.5. In this case, the basic reproduction number is R0h=0.086 for all the above values of γ.
The nature of trajectory shows in (Figure 3a) that if infectivity rate will increase in human population the number of population will increase in infected class as well as at the constant rate 50% of quarantine population of infected class exhibits the longer period of time of recovery than if we increase the quarantine population from 45% to 95% of infected population. So, more quarantine will end up with faster recovery.
In Figure 3c Infected and quarantine phase population has simulated for birth rate B=0.00672 to 0.04512, and death rate=0.00153 to 0.01749 to see the trajectories nature of country wide population. For convenience both birth rate and death rate has been used in increasing order and the birth rate and death rate of China has been used to compare the nature of trajectories. Even there are several hidden factors needs to investigate and it varied county to country based on climax, immunity, Socioeconomics condition, and geography of reasons that are very sensitive in transmission of viruses in human population. But overall the nature of trajectory exhibits the increase in quarantine population will have faster recovery.

Figure 3c: The graph between the Quarantine Class of Humans and the Infected Class of Humans has been shown.
Example 4: Here we have considered the sensitivity analysis of vaccination class and infected class of human population with various values of vaccination parameters and its comparison between country wide simulated vaccination class and infected class of human population with constant vaccination parameter and varying birth rate and death rate.
In Figure 4a, the nature of trajectory indicate that increase the vaccination parameter σ from 10% to 99%, the infection rate decreases which is very true and its play a vital role in faster recovery.

Figure 4a: The nature of trajectory indicate that increase the vaccination parameter σ from 10% to 99%, the infection rate decreases which is very true and its play a vital role in faster recovery.
In Figure 4b, we have used constant rate of vaccination parameter σ=10% and varied the birth rate and death rate in increasing order. We found that the country which has smaller birth rate as well as smaller death rate have faster recovery than country which has higher birth rate and higher death rate. So, the socioeconomic condition, immunity, climax, and several other hidden factors plays vital role in recovery from infected class too.

Figure 4b: We have used constant rate of vaccination parameter σ = 10% and varied the birth rate and death rate in increasing order. We found that the country which has smaller birth rate as well as smaller death rate have faster recovery than country which has higher birth rate and higher death rate. So, the socioeconomic condition, immunity, climax, and several other hidden factors plays vital role in recovery from infected class too.
Example 5: We have studied the sensitivity analysis of recovered human with quarantine human and infected human for China population in Figure 5a and 5b, and varied birth rate and death rate for different country human population in Figure 5c and 5d.

Figure 5: a and b: Indicates the increase in population of quarantined humans, the recovered population of human also increases. c and d: Clearly indicates that quarantining population in infectious population is strong remedial action, but birth rate and death rate with hidden factors also impact the recovery class of human population.
It is very clear from (Figure 5a and 5b that as we increase the population of quarantined humans, the recovered population of human also increases. From (Figure 5c and 5d) it clearly indicates that quarantining population in infectious population is strong remedial action, but birth rate and death rate with hidden factors also impact the recovery class of human population.
Example 6: We have considered the sensitivity analysis of vaccination parameter varied from 10% to 95% in Figure 6a, varied infectivity rate η=1% to 90% from exposed class of human to infected class of human in Figure 6b, and varied birth rate, and varied death rate in increasing order for different country human population as well as for China in Figure 6c. We found that in each case the recovery time is approx. 40 to 45 days.

Figure 6: a: Shows the σ varied from 10% to 95%. b: Shows the infectivity rate η = 1% to 90% from exposed class of human to infected class of human. c: Varied birth rate, and varied death rate in increasing order for different country human population as well as for China.
Conclusion
We have developed Susceptible-Exposed-Infected-Quarantined- Recovered-Vaccination (SEIQRV) epidemic model for human population and Susceptible-Exposed-Infected (Sb Eb Ib) epidemic model is developed for bird population. The basic reproduction number for both epidemic model are computed, which are ![]() and
and  For human and bird population respectively. We proved that the model is locally and globally asymptotically stable for disease-free equilibrium point when
 ![]() and
and ![]() . We also prove that the unique endemic equilibrium point is globally asymptotically stable in bird population, when
. We also prove that the unique endemic equilibrium point is globally asymptotically stable in bird population, when ![]() . From the results, it is evident that quarantine and vaccination play a vital role for early recovery of the disease. The more we quarantine the infectious population, more is the recovery. This model stablishes the true recovery time that is 40 to 45 days, that is clinically proved [15]. This model is stabilized for the world population country wise with real parametric values, due to its potential threat of becoming pandemic.
. From the results, it is evident that quarantine and vaccination play a vital role for early recovery of the disease. The more we quarantine the infectious population, more is the recovery. This model stablishes the true recovery time that is 40 to 45 days, that is clinically proved [15]. This model is stabilized for the world population country wise with real parametric values, due to its potential threat of becoming pandemic.
Our aim is to study the spread of avian influenza subtype A (H7N9) due to its potential threat of becoming pandemic, to gain a better understanding of transmission mechanism. Our model yields satisfactory results as evidenced by the simulations and may be used for the prediction of future situations of epidemic in country wise. We utilize real data at these various scales and our model allows one to generalize our predictions and make better suggestions for the control of this epidemic. Our next research will be based on consideration of hidden factors by geographical reason that impacts the immunity, birth rate, and death rate.
References
- Stuart-Harris C (1979) Epidemiology of influenza in man, Br. Med Bull 35: 3-8.
- https://health.mil/Reference-Center/Reports/2017/08/02/H7N9-Aug-2-2017
- http://www.who.int/influenza/human_animal_interface/en/
- http://www.npr.org/sections/goatsandsoda/2017/09/07/549069924/deadly-bird-flu-in-china-evolves-spreads-to-new-regions
- Zhifei L, Chi-Tai F (2015) A Modeling study of human infections with avian influenza A H7N9 virus in mainland China 26
- Mahato B, Mishra BK, Jayswal A (2015) Mathematical model of malaria for co-infection of plasmodium vivax and plasmodium falciparum in india. Br. Microbiol Res J 5: 285-299
- Mahato B, Mishra BK, Jayswal A (2014) A mathematical model on acquired immunodeficiency syndrome, J. Egyptian Math. Soc 22: 544-549.
- Kamgang JC, Sallet G (2008) Computation of threshold conditions for epidemiological models and global stability of the disease-free equilibrium, Math Biosci 213: 1-12.
- Li MY, Muldowney JS (1996) A geometric approach to global-stability problem, SIMS J Math Anal 27: 1070-83
- Haldar K, Mishra BK (2014) A mathematical model for a distributed attack on targeted resources in computer network. Commun Nonlinear Sci Numer Siulat 19: 3149-3160.
- Iwami S, Takeuchi Y, Liu X (2007) Avian-human influenza epidemic model, Math. Biosci 207: 1-25.
- Bowman AB, Van den GP, Driessche, Wu J, Zhu HA (2005) Mathematical model for assessing control strategies against West Nile virus, Bull Math Biol 67: 1107-1133.
- Bowman C, Gumel AB, Van den DP, Wu J, Zhu HA (2005) Mathematical model for assessing control strategies against West Nile virus, Bull Math Biol 67: 1107-1133.
- Chong NS, Tchuenche JM, Smith RJ (2014) A mathematical model of avian influenza with half-saturated incidence, Theory Biosci 133: 23-38.
- Guo L, Zhang X, Ren L, Yu X, Chen L, et al. (2014) Human Antibody Responses to Avian Influenza A(H7N9) Virus, Emerging Infectious Diseases 20: 192-200.