Research Article, J Fashion Technol Textile Eng S Vol: 0 Issue: 3
New Experimental Device for Measuring the Inter-Fiber Transversal Friction
Shanwan A, Gassara HE, Barbier G and Sinoimeri A*
University of Haute Alsace, LPMT laboratory, EA4365, 11 Rue Alfred Werner, 68093 Mulhouse, France
*Corresponding Author : Artan Sinoimeri
University of Haute-Alsace, LPMT laboratory, EA4365, 11 Rue Alfred Werner, 68093 Mulhouse, France
Tel: +33(0)389336414, +33(0)389336339
E-mail: artan.sinoimeri@uha.fr
Received: September 20, 2017 Accepted: October 12, 2017 Published: October 16, 2017
Citation: Shanwan A, Gassara HE, Barbier G, Sinoimeri A (2017) New Experimental Device for Measuring the Inter-Fiber Transversal Friction. J Fashion Technol Textile Eng S3:004. doi:10.4172/2329-9568.S3-004
Abstract
The mechanical behavior of fibrous structures depends on the inter-fiber friction. In the scientific literature, many researchers have studied this kind of friction, however all of them focused on the interfiber friction in only two directions: longitudinal-to-longitudinal (l-l) and longitudinal-to-transversal (l-t). Hence, there are no studies, up to now, focusing on transversal-to-transversal (t-t) direction. For this reason, an experimental device was developed to evaluate the transversal inter-fiber friction. The obtained results would allow characterizing and modelling this type of friction.
Keywords: Fiber; Yarns; Composite materials
Introduction
In some of composite manufacturing processes, such as Resin Transfer Molding (RTM), fibrous reinforcements are subjected to a preforming before the stage of resin injection. During preforming, many defects could appear and can highly affect the mechanical resistance of the final composite materials. Current studies [1] show that the appearance of preforming defects is due to several reasons, where the most influential one is the friction occurring inside the fibrous structures during their preforming. Thus, the friction is induced by the fabric deformation, which leads to a sliding between the different fibrous components: layers, yarns and fibers. Hence, the study and the measurement of friction seem very crucial to evaluate the fibrous structure behavior.
Indeed, the friction phenomenon can be evaluated according to three levels: macroscopic (inter-ply reinforcement), mesoscopic (friction between yarns) and microscopic (friction between fibers). In the microscopic level, friction can further be classified into three cases, based on the friction direction: longitudinal-to-longitudinal (Figure 1a), longitudinal-to-transversal (Figure 1b) and transversalto- transversal (Figures 1c,d).
Actually, friction at macroscopic and mesoscopique scales has been wildly studied [1,2]. However, we presently focus on the friction at the microscopic scale. This type of friction, called inter-fiber or fiberto- fiber friction, has been reported by numerous studies [3-6], but all of them focused on longitudinal-to-longitudinal or longitudinal-totransversal friction (Figure 1a,1b).
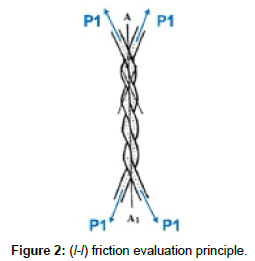
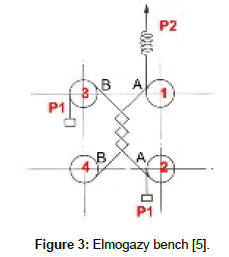
As reported in abovementioned studies [6,7], the evaluation of longitudinal-to-longitudinal friction depends basically on the principle shown in Figure 2. In this principle, two twisted fibers are subjected to the same pre-tensile force (P1) at each end. Then, a tensile force (P2>P1) is applied continuously and progressively at one of the four fiber ends. While P2 is inferior to the sum of P1 and the inter-fiber static friction force, the helical contact surface between fibers stays immovable in the same configuration. When P2 becomes superior to the up-mentioned sum, sliding occurs between the two fibers. By means of experimental recorded values, at the moment of sliding, as well as other experimental parameters, it is possible to calculate the friction coefficient. Several researchers used this principle in different experimental benches in order to evaluate the longitudinal-to-longitudinal friction. Mogazy et al. [5] has developed a test bench shown in Figure 3, therein the two twisted fibers A and B are mounted via four pulleys. When the experiment started, the pulley 4 is fixed, while the three others are left free in rotation. A force P2 is then applied progressively until sliding occurs. Hence, the longitudinal-to-longitudinal static friction coefficient is calculated by means of the following equation:
Figure 3: Elmogazy bench [5].
μ=((P_2-P_1 )*l)/(2(P_2+P_1 )*π^2 n^2 r)
where l and r, are the length and the radius of the helical contact, n is the number of fiber helical coils.
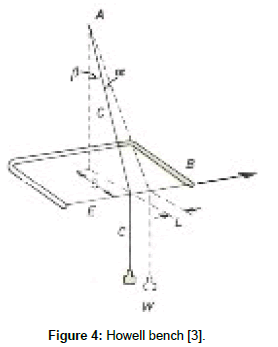
When we come across the longitudinal-to-transversal friction case, we find that it has been also studied by several researchers. Howell et al. [3] carried-out an experimental test bench to evaluate this kind of friction between two fibers, as shown in Figure 4. In this experiment, when the cadre B, which clamps the fiber E, is moved horizontally in the raw direction, the fiber C which is already fixed to a point A rubs on the fiber E in the opposite direction. Depending on the experimental parameters: the distance L, the angles α and β, the distance S, and the counterweight W, it is possible to calculate the longitudinal-to-transversal friction coefficient by the following equation.
Figure 4: Howell bench [3].
μ=(W g sinα)/(W g sinβ)=sinα/sinβ=L/S
Concerning the two last cases, presented in Figure 1c and 1d, there is no research, to the best of the authors’ knowledge, which studied this type of friction [8]. Therefore, it would be very interesting to find a new method for measuring the transversal inter-fiber friction. Hence, this paper presents a new experimental device to evaluate this type of friction.
Transversal-to-transversal Friction Measuring Idea
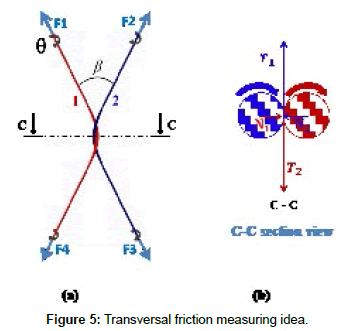
To study the transversal-to-transversal friction, a sliding movement has to been generated between two fibers, according to the directions shown in Figure 1 (cases c and d). Since it is practically very difficult to achieve this movement, it has been replaced by another induced movement, allowing a transversal sliding, as exposed in Figures 5a and 5b. Depending on this configuration, we designed and carried-out our experimental bench in order to evaluate the transversal-to-transversal inter-fiber friction. According to this idea, two fibers, subjected to equal extensional forces: F1, F2, F3 and F4, are clamped from their ends and crisscrossed together with an angle β and then they are twisted to a defined angle, 180° in Figure 5. By this way, normal forces, N1 and N2, are induced at the contact zone. Then, the two fibers are simultaneously and progressively subjected to a torsional movement with an angle θ at each of their ends, according to the black arrows directions (Figure 5). During this rotational movement, two types of torque are induced: the elastic torque, which is due to the rotational movement and which is transmitted to the interfiber contact zone, and the resistive torque, which is due to inter-fiber tangential friction forces T1 and T2. When the elastic torque becomes more important than the resistive torque, a sliding between the two crisscrossed fibers takes place. Thanks to a new mathematical model under development, it is possible to evaluate and characterize the transversal inter-fiber friction through the two parameters recorded at the moment of sliding: the torsional angle θ and the tensile forces F induced at each fiber end.
Conception and Carrying out of the Machine
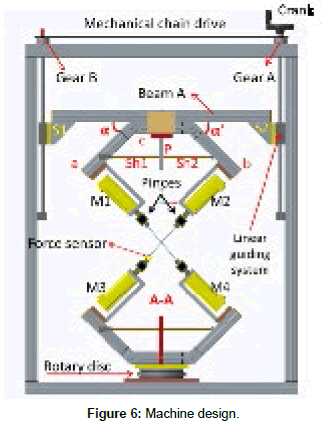
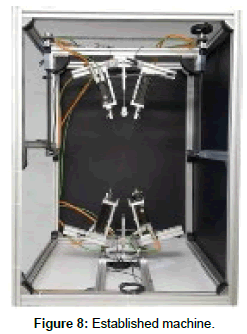
In order to achieve the measuring idea explained in section 2, an experimental machine was designed and constructed as shown in Figure 6. It includes two main parts, upper and lower. The upper one has two servo-motors M1 and M2 (brushless), fixed to two profiles a and b, which are symmetrically articulated with a third profile c. Both profiles a and b can rotate around their articulation points at equal angles α and α'. Their symmetrical movement are guaranteed by two threaded shafts (Sh1 and Sh2) fixed to a plate P. When the shafts are rotated, clockwise or anticlockwise, this in turn leads to increasing or decreasing the angles α and α'. Subsequently, this allows changing the angle β. The set of three profiles; a, b and c, is fixed on a beam A, which is attached to two similar and linear guiding systems by means of two squares (S1 and S2). Through this assembly, the two guiding systems can be synchronously moved upwards or downwards thanks to the two gears A and B, the mechanical chain and the crank. Furthermore, the upper part has two identical fiber clamps that are specifically designed and developed for this machine.
On the other hand, the lower part is similar to the upper one and fixed to a rotated disk. This part has also two clamps, having the same geometrical dimensions as their homologues of the upper part. Regarding the tensile forces (F1, F2, F3, F4), it is assumed that they will be identical if the machine symmetry is guaranteed. For this reason, only one tensile force sensor was used to measure one of these forces.
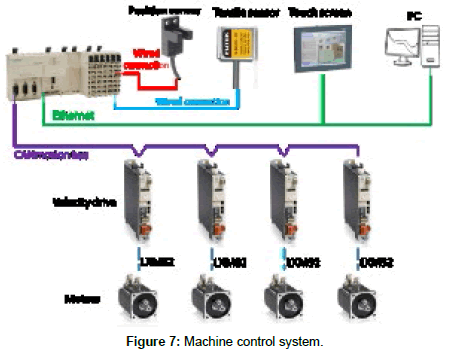
From electrical and automatic point of view, the bench has four similar servo-motors allowing fibers to rotate at different velocities. Each motor has its own variable speed drive in order to adjust the required rotational velocity. Motors rotations are synchronized by means of an automation circuit (Figure 7), depending on a motion controller LMC, so that, each motor starts the rotation at the same moment and the same velocity of the other ones. The synchronization program was accomplished by a specific software ‘’SoMachine’’, associated to the controller LMC. In addition to this synchronization task, the controller ensures the communication with the different elements of the machine, such as: PC, the touch-screen (Human Machine Interface) and the different sensors used in measuring and adjusting the tests process.
Two types of sensors were used in the machine: the first one is the tensile sensor, which measure the traction forces from 0 to 5N and the other one is position sensors used to adjust the starting position of each motors. The automatization principle of the experimental machine is presented in Figure 7.
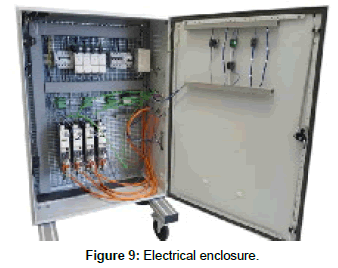
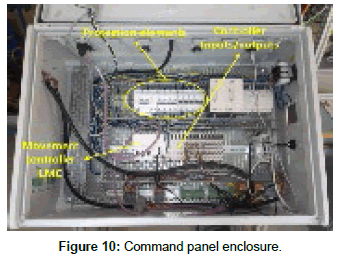
The automatization scheme shown in Figure 8 was achieved through electrical and control panel enclosures (Figures 9 and 10). The electrical enclosure includes principally the four speed drives, electrical and human protections equipment (circuit breakers, differential breaker, thermal and magnetic fuse, kill switch, etc...). On the other side, the main task of control panel is to pilot the machine.
The design, programming and automatization of the current machine enable to have a flexible experimental bench, allowing to carry out tests at different values of experimental parameters such as: fibers lengths (up to 430 mm), tensile force F induced on fibers (up to 5N) and the crisscrossed fibers angle β (35° à 50°).
Tests Procedure and Results
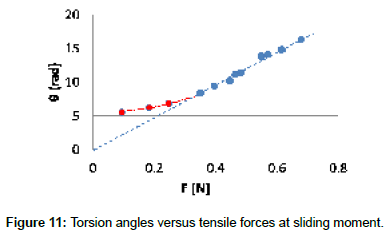
Before carrying out the tests, the machine configuration shall be adjusted at predefined geometrical parameters including both angle β and the distance between the upper and lower part of the machine. Fibers are then crossed and stretched to a defined pretension force. After that, the lower part is manually rotated to 180° in order to twist the two crossed fibers as illustrated in Figure 5. The machine is next switched on, so that, the four motors start their rotations at a low velocity (1 to 20 rpm), according to the directions of arrows shown in Figure 5. As the angle β and the distance between the upper and the lower parts of the machine remain fixed during rotation, the tensile forces, induced on fibers, increase continuously. As explained in section 2, when sliding occurs in the contact zone, a sudden change in the tensile force takes place. At this moment, the tensile force F and the torsion angle θ of fibers are recorded to be used later. Further experiments are conducted for another pairs of fibers at the same angle (β = 38°) and different values of pre-tensile forces applied on the fibers. We shall note that for each test, the two main parameters θ and F are recorded to draw the curve presented in Figure 11.
From the above curve, we observe that when the pre-tensile force, applied on the fibers before experiment, increases, the inter-fiber sliding requires more torsion angles to be produced. Moreover, this curve has two parts, straight (blue) and non-linear part (red). In the red zone, we note that the torsion required for the sliding is more important than the corresponding torsion of the dashed line (linear response).
The difference between linear and nonlinear behaviors can be explained referring to Figure 5. In fact, if the two crossed fibers are assumed to be perfectly flexible, the normal forces N1, N2 are only caused by the traction forces F and the fiber curvature. As the flexion stiffness is neglected, the fiber curvature does not change with the force F, giving this way proportionality between F and N. On the other hand, the tangential force is proportional to the elastic torque, which is proportional to the sliding angle θ. This leads to a linear relationship between θ and F in the blue zone.
Practically the assumption of negligible flexion stiffness of fibers may be not justified, so, fibers behave like beams. In this case, when crossed fibers are twisted together, as shown in figure 5, each normal force N1 and N2 has two components: the first one caused by the traction forces applied on fibers, and the second one due to the fiber flexion stiffness. Subsequently, the appearance of the two zones, red and blue, in the previous curve, could be explained as follows: in the blue zone (linear one), when traction forces are important, their effects become highly important also, and thus, the normal forces component caused by flexion stiffness seems to be negligible with comparison to the normal component caused by fiber traction. In the red zone, the traction forces are not high enough and thus, the normal components caused by flexion stiffness could not be negligible. In this case, the total normal force could be more important than the normal force when the flexion stiffness was negligible. Subsequently, the resulted resistive tangential forces T1, T2, due to friction, are more important compared to the blue zone. Hence, the resistive torque in red zone is also more important than the resistive torque of the blue zone. Consequently, the motors should provide more torsion, in order to achieve an elastic torque capable to compensate the resistive torque of the red zone. Some preliminary numerical simulations seem to be coherent with the above analysis and give curves θ vs F similar to the one of Figure 11.
Conclusion
Thanks to this study, a new concept of transversal inter fiber friction measurement was developed and led to the realization of a new experimental device. The accomplished machine is flexible and currently in use. It allows the evaluation of the transversal friction between fibers of different materials with different diameters from 50 until 500 μm. The design flexibility and the machine program allowed the carrying out of several tests. The first results seemed to be coherent. Moreover, the measured variables (θ and F) would allow, through a theoretical model under development, to evaluate the transversal inter fiber friction.
Acknowledgment
The authors of this work would like to thank the French National Research Agency (Grant ANR-13-RPMN-0001-04), that supported and financed this research.
References
- Allaoui S, Cellard C, Hivet G (2015) Effect of inter-ply sliding on the quality of multilayer interlock dry fabric preforms. Compos Part Appl Sci Manuf 68: 336-345.
- Montero L, Allaoui S, Hivet G (2017) Characterisation of the mesoscopic and macroscopic friction behaviours of glass plain weave reinforcement. Compos Part Appl Sci Manuf 95: 257–266.
- Howell HG (1951) Inter-Fibre Friction. J Text Inst Trans 42: T521-T533.
- Ben BB, Haussy B, Ganghoffer JF (2007) Discrete woven structure model: yarn-on-yarn friction. Comptes Rendus Mécanique 335: 150-158.
- El Mogahzy YE, Gupta BS (1993) Friction in Fibrous Materials: Part II: Experimental study of the effects of structural and morphological factors. Text Res J 63: 219-230.
- Mulvihill DM, Smerdova O, Sutcliffe MPF (2016) Friction of carbon fibre tows. Compos Part Appl Sci Manuf 93: 185-198.
- Lindberg J (1953) Relationship between various surface properties of wool fibers: part II: Frictional properties. Text Res J 23: 225-236.
- Gassara HE (2016) Développement de nouvelles méthodes de mesure du frottement transversal entre fibres.
 Spanish
  Chinese
  Russian
  German
  French
  Japanese
  Portuguese
  Hindi
Hindi 
