Review Article, J Nucl Ene Sci Power Generat Technol Vol: 11 Issue: 6
Productivity Improvement through Bottleneck Identification and Elimination in a Pump Assembly Line Using Simulation
Jaiganesh V* and Kavinesh Sankaar TS
Department of Mechanical Engineering, Anna University, Tamil Nadu, India
*Corresponding Author: Jaiganesh V, Department of Mechanical Engineering, Anna University, Tamil Nadu, India;E-mail: vj.mech@psgtech.ac.in
Received date: 09 February, 2022, Manuscript No. JNPGT-22-46948;
Editor assigned date: 11 February, 2022, PreQC No. JNPGT-22-46948 (PQ);
Reviewed date: 25 February, 2022, QC No. JNPGT-22-46948;
Revised date: 13 April 2022, Manuscript No. JNPGT-22-46948 (R);
Published date: 28 April 2022, DOI: 10.4172/2325-9809.1000291
Citation: Jaiganesh V, Kavinesh Sankaar TS (2022) Productivity Improvement through Bottleneck Identification and Elimination in a Pump Assembly Line Using Simulation. J Nucl Ene Sci Power Generat Technol 11:6.
Abstract
Any manufacturing industry strives for improvement on a continual basis either to satisfy ever increasing customer demands or as a matter of self-sustained drive. Avenues for continual improvements can be either processes that are stable and capable or those that are causes of concern on a routine basis. One cause of concern in any manufacturing process at the operating and managerial level is bottleneck. Bottlenecks are a common phenomenon in any manufacturing system. These bottlenecks could sometimes be systemic in nature demanding huge investments and top management intervention for their elimination or those that can be eliminated as a matter of routine process improvement exercises. In this work, industrial engineering techniques and simulation was used to identify and eliminate bottleneck in a pump assembly line of a local industry, specializing in the manufacture and assembly of electric motors and pumps with customers in the domestic and industrial sectors. An assembly that was critical in terms of revenue was selected for study. ARENA was used to model and simulate the existing assembly process. Analysis of simulation results followed by a careful study of the assembly process indicated winding section as the bottleneck. Suggestion of additional resources in the winding section to eliminate bottleneck resulted in a 33% improvement in productivity
Keywords: Manufacturing simulation; ARENA; Pump assembly; Bottleneck elimination
Introduction
One fundamental and important objective of any industry is to improve customer satisfaction and internal targets on a continual basis that in turn necessitates sustenance and improvement of all its internal business processes. Tools and techniques for process improvement abound in number. Many of these techniques involve cost and time with an associated risk of investment recovery within a stipulated time. A very powerful alternative to solving a wide variety of problems in manufacturing is simulation. Simulation is the imitation of real-world process or system over time. Simulation involves the generation of an artificial history of a system and the observation of that artificial history to draw inferences concerning of the operating characteristics of the real system [1]. Simulation is done either manually or using computers. Simulation is basically an experimental technique. It is a fast and relatively inexpensive method of doing an experiment on the computer. The basic idea behind simulation includes modelling the given system by means of equations and determining its time-dependent behaviour. The simplicity of approach when combined with the computational power of the high-speed digital computer makes simulation a powerful tool. Simulation is mostly used when an exact analytical expression for the behaviour of the system under investigation is not available or when the analytic solution is too time consuming or expensive.
ARENA simulation software is one of the most inclusive toolsand a powerful simulation packagefor discrete event simulation modelling used for modelling and analysis of manufacturing processes and systems. The simulation software used in this work was ARENA v14.0. It is a powerful software tool developed by Rockwell Automation Inc. used to provide distinguished solution for better business decisions using discrete event simulations. By testing out the ideas in the computer, ARENA can help in predicting the future with confidence and without disrupting the current business environment.
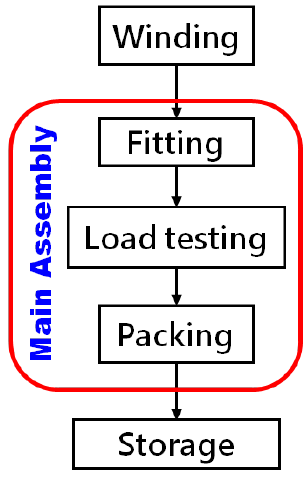
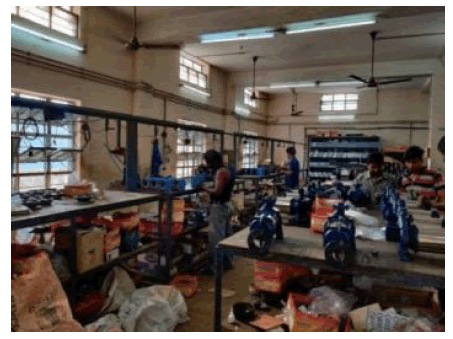
This work was carried out at GR Motors and Pumps, a small-scale industry producing household and industrial pumps in Coimbatore. Figure 1 illustrates the sequence of sections in the industry and a snapshot of an assembly section is shown in Figure 2.
Problem definitionThe work began with the study of various assemblies produced by the industry and identifying an assembly critical in terms of revenue. The details of revenue generated by various varieties in the first quarter of 2019 as a percentage of total revenue are presented in Table 1.
| S.no. | Pump model | Body | Winding | Revenue |
|---|---|---|---|---|
| 1 | 0.5 HP Monoblock Single Phase-Big flow | Al | Cu | 0.112 |
| 2 | 0.5 HP Monoblock Single Phase-Self priming | Al | Cu | 0.138 |
| 3 | 0.5 HP Monoblock Single Phase-Big flow | Al | Al | 0.087 |
| 4 | 0.5 HP Monoblock Single Phase-Self priming | Al | Al | 0.072 |
| 5 | 1.0 HP Monoblock Single Phase-Big flow | Al | Cu | 0.219 |
| 6 | 1.0 HP Monoblock Single Phase-Self priming | Al | Cu | 0.098 |
| 7 | 1.0 HP Monoblock Single Phase-Big flow | Al | Al | 0.086 |
| 8 | 1.0 HP Monoblock Single Phase-Self priming | Al | Al | 0.057 |
| 9 | 0.5 HP Openwell Submersible SP-Regular | S.S (Cover) | Cu | 0.031 |
| 10 | 1.0 HP Openwell Submersible SP-Regular | S.S (Cover) | Cu | 0.047 |
| 11 | 0.5 HP Monoblock Single Phase-Big flow heavy model (38 mts. Head) | Al | Cu | 0.014 |
| 12 | 0.5 HP Monoblock Single Phase-Big flow heavy model (38 mts. Head) | Cast iron | Cu | 0.039 |
Table 1: Varieties and revenues generated
It can be seen that 1.0 HP Monoblock single phase pump with Aluminium body and copper winding has the maximum revenue share (21.9%) and it was also the candidate requested by the plant head and top management for a detailed analysis. A detailed study of the existing process for this variety revealed the following.
- Absence of proper synchronization between the winding and fitting stations.
- Prevalence of higher workloads among the workers in the winding section than in the fitting section resulting in mental fatigue and discomfort.
- Less productivity than that for a similar variety produced by a competitor, a fact reported by the plant supervisor.
A need was realized for evolving a systematic methodology for solving the problem by the application of industrial engineering tools and techniques.
Literature Review
The authors in [2] presented the operating strategies for manufacturing systems using simulation. An existing manufacturing facility was replicated in a virtual environment using ARENA. Different manufacturing scenarios were studied and new strategies were developed to improve the performance parameters. In [3], the authors analysed an existing bottle manufacturing line which product had a rising demand. Simulation was chosen as a tool to analyse the line and data on processing times of different workstations along with their capacities were collected and used as inputs for simulation. Existing manufacturing line was modelled using Arena to determine the bottleneck of the production line. A modified model was proposed that reduces the waiting time by 14.11% with an increase in productivity of 4% with increment in profit to cope with rising demand. In [4], Modelling and simulation of a multi-product furniture assembling plant to develop an efficient system for timely product deliveries at minimal cost was carried out. Simulation and development of improved models resulted in a significant improvement in the average hourly throughput and an additional space to store the materials prior to processing at workstations was created. In [5], the authors applied computer simulation to analyse the production line bottlenecks in a colour manufacturing line using ARENA. Modifications in the production line to eliminate the bottle neck and improve the productivity were proposed. The authors in [6] explained the role of discrete-event system simulation in optimizing the cost and productivity of construction operations using a case study.
ARENA was cited as a tool with ease and flexibility of ARENA to simulate different aspects of construction. In [7], key factors influencing a cement production line were studied and analysed. A simulation model was developed using ARENA and analysed for bottlenecks. Using a simulation run length of 13 days, bottlenecks were identified and the utilization, buffer capacities and the line production rate were measured. The authors in [8] analysed the assembly line of a welding machine manufacturing plant and proposed a simulation model using ARENA for reducing the cycle time, determination of bottleneck and optimum worker assignment. In [9], the authors used ARENA for evaluation of the transportation system of the Sun gun copper mine. Different management strategies of the open pit mining equipment were studied. Using simulation modelling, different management systems of the open pit mining equipment including fixed and flexible assignments of trucks for loaders were studied. A dispatching model with the objective function of minimizing truck waiting times was developed. In, ARENA was used for study of existing facility layout in a gear manufacturing company and its redesign. The authors in simulated the layout of a factory using ARENA. Utilization of each machine was calculated and it was mentioned that the efficiency of manufacture depends on the arrangement of various facilities and employee’s amenities. In, yield improvement in a PCB assembly process was obtained using ARENA by changing the configuration of the setup on the assembly line.
The optimization process of printed circuit board assembly line was classified into hard and soft stages with the hard stage consisting of hardware changes and the soft stage consisting of the simulation of current assembly line and its analysis. In, the authors used simulation for line balancing and man power utilization. Different scenarios were tested to optimize and balance the line and the best solution was identified and discussed. The authors in simulated the production process of a metal stamping industry with three work stations performing ten different types of processes and evaluated the utilization of the production line using ARENA. The simulation model was verified and validated and it was found that utilization at each workstation would increase with increase in batch size with the throughput rate remaining constant. In, the authors worked on an optimization problem in a utensils industry utilizing a flow shop based production system. The objective was to study, simulate and improve the current plant layout using ARENA. An improvement from 8600 pieces to 9200 pieces in an 8 hours shift was reported. In, an ARENA model was developed for improving the throughput time in a plastic industry.
The author in indicated that computer simulation can be a method for analysing problems connected with limiting the production capacity. The major objective was to identify the possibility of applying selected simulation tool while analysing production bottlenecks. The problem analysis involved the application of the Tecnomatix Plant Simulation software by Siemens. In, the authors presented the results of process simulation carried out in a tyre manufacturing plant that required reduction in non-value added activities, bottlenecks and processing time to increase productivity. Simulation revealed the calendaring process in the plant as the bottleneck. Root causes for problems were identified using 5 why analysis and the cause-effect diagram. It was shown that bottleneck can be eliminated by modifying the calendaring machine to increase productivity by 15.81%.
Literature pertaining to modelling, simulation and bottleneck analysis of pump assembly seem to be limited indicating sufficient scope for bottleneck identification and productivity improvement using ARENA.
Objectives
The objectives of this work are to:
- Understand and systematically document the existing pump assembly process using industrial engineering tools and techniques.
- Model and simulate the existing pump assembly line using ARENA v14.0.
- Identify the bottleneck(s) in the assembly line by supplementing the results of simulation with a careful observation of process details.
- Suggest improvement(s) and verify using simulation, whether the improvements suggested do indeed improve productivity [5].
Methodology
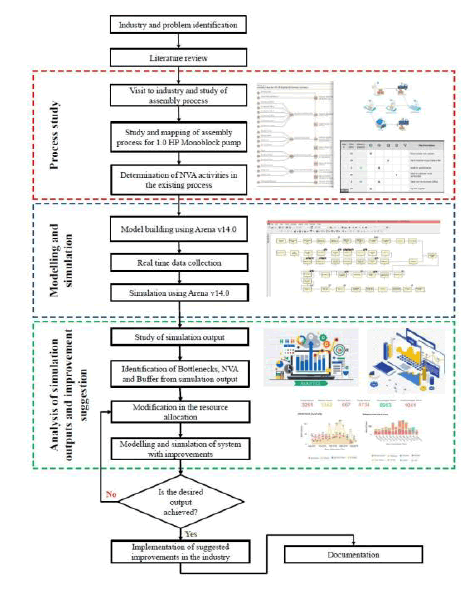
The methodology adopted is presented in Figure 3.
Process Study
If simulation is to be a relied upon as a tool for process improvement, then it should accurately reflect the reality. If simulation is to be an accurate representation of reality, then the simulation model should be realistic. Development of a realistic simulation model requires a thorough understanding of the existing process and its associated parameters. This in turn demands a careful and close attention to each and every aspect of the process.
Bill of Materials
Careful documentation of assembly process details includes as a first step, the collection of information pertaining to various components involved in a 1.0 HP Monoblock single phase pump with Al body and Cu winding. Collection and compilation of this information resulted in a Bill of Materials (BoM) [7].
Flow Process Chart
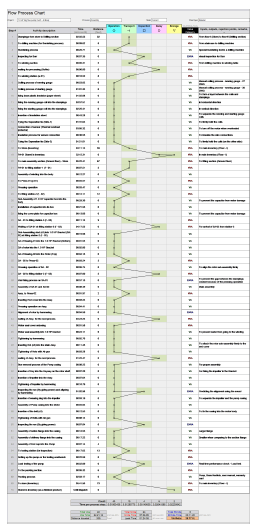
To facilitate enumeration and classification of assembly process steps and to further categorize these steps as either value added, non-value added or essential non value added, flow process chart was constructed. The necessary activity times were measured using a stopwatch and video study [8].
Flow process chart for the assembly is shown in Figure 4. For processes involving an operator, four readings by the same operator were taken and the average was represented in the flow process chart and in the case of processes with multiple operators, time values were measured for four different workers and the average value was represented in the chart. Completion of this step indicated that the assembly of 1.0 HP Monoblock Single phase-Big flow pump consisted of 70 process steps. From the summary presented in the bottom of the chart, it can be seen that 40 value added activities, 24 Non value added activities and 6 essential non value added activities are involved in the assembly process [10].
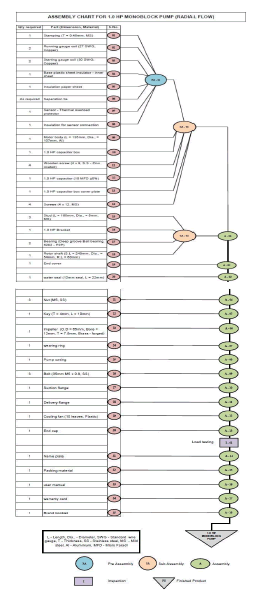
Assembly chart
An understanding of the sequence in which the components are assembled is facilitated by the assembly chart. The template for the chart was adopted from expert [11]. The assembly starts from the winding section in the Floor-II of the plant. The stampings get assembled to the running and starting coils in the winding section. The insulation sheet is then attached to the winding and finally the thermal overload sensor gets assembled along with its insulation cover. This entire assembly is referred to as Pre-assembly-01 (PA-01) in the assembly chart. Then the winding gets stored in their main inventory section in Floor-I after which it goes to the Floor-G where the main assembly process happens. A total of five stations are involved in the main assembly process namely fitting stations 1, 2 and 3, load testing station and the packing station. From the store, the winding enters the fitting station 1 where it gets assembled with the motor body. Then the capacitor and its mountings get assembled into the winding which is referred to as sub-assembly-01 (SA-01) in the assembly chart. Then, the stud is assembled into the 1.0 HP bracket along with the bearings and rotor shaft thus making the Sub-assembly-02 (SA-02). Then the Sub-assembly-01 gets assembled with Sub-assembly-02 which is indicated as main Assembly-01 (A-01) in the assembly chart. Then, components like end cover, water seal, Impeller and its key, pump casing, suction flange, delivery flange, cooling fan, end cap and the packing materials gets added consecutively. Thus, in total, the entire assembly process of a single 1.0 HP Monoblock single phase-Big flow pump consists of 35 different steps. The assembly chart is shown in Figure 5 [12].
Modelling and Simulation
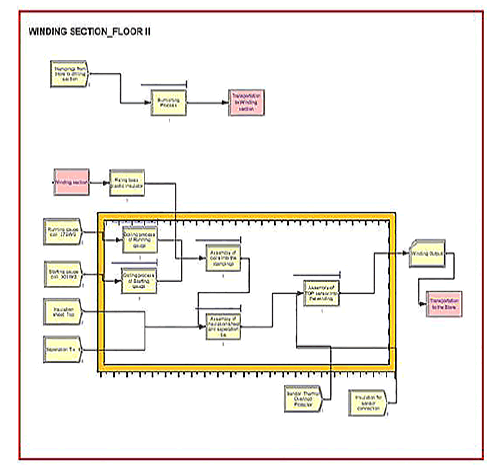
Modelling of the existing process was carried out using ARENA. Eight different modules were used to represent the assembly environment. The model was created in terms of sections and connected with each other. Each section represents a floor in the assembly plant and all the activities were represented using appropriate modules. Figure 6 represents the model of the winding section [13].
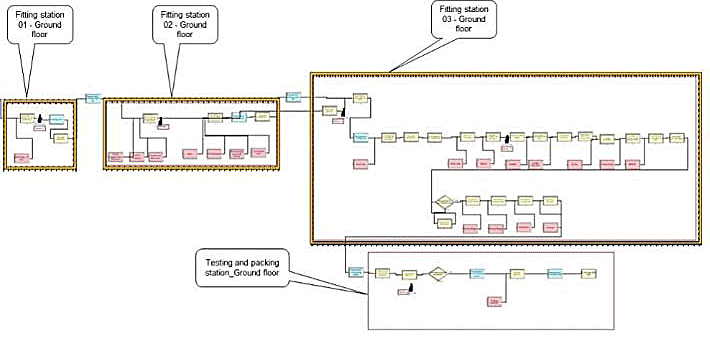
The simulation model of the main assembly section is shown in Figure 7. The detailed breakup of all the stations in the main assembly section is given in Appendix 1.
Process time distribution
The distribution of process times for all the process steps involved in the pump assembly process was obtained in this step and is an essential input for simulation. Four observations for each activity collected during the process study stage were exported in text format in order to make it compatible with the Input analyser tool [14]. This was followed by fitting the most appropriate distribution for the process times using the input analyser from ARENA v14.0. For a detailed summary and comparison of square error values for all possible distributions, fit-all summary option in ARENA was used. Square error in fit-all summary represents the sum of squared discrepancies between histogram frequencies and [15] fitted-distribution frequencies. The distribution with minimal square error best suits the fitted distribution with the sample data. For example, in the case of activity involving transportation of stampings from store to drilling, the beta distribution was selected since its square error is the minimum [16].
Assembly simulation
The length of simulation run was based on a shift of 8 hours (480 minutes). The number of replications and replication length were given as simulation inputs. Number of replications denotes how many times the simulation has to be run for the replication length specified by the user. Warm-up period may not be applicable for assembly line. Simulation output of the existing assembly line is presented in Appendix 2. The total output of the assembly line was found to be 127 units [17].
Bottleneck identification
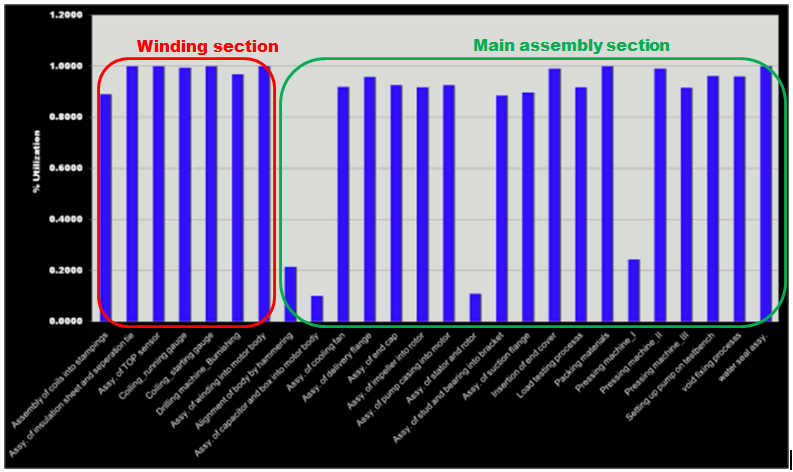
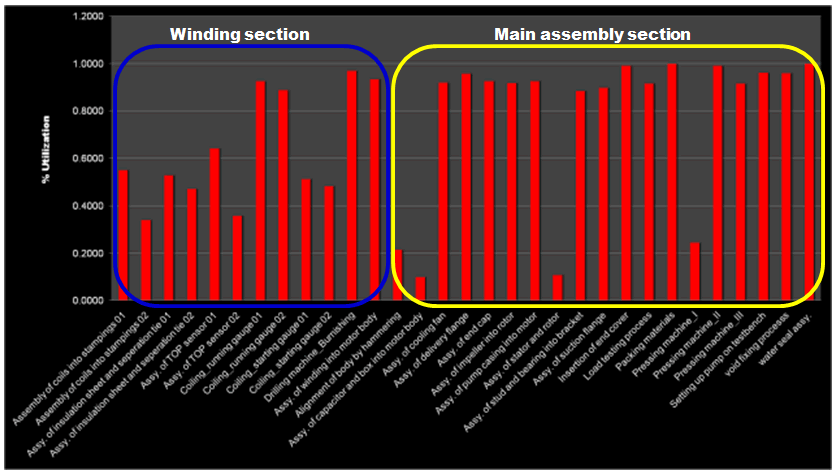
From the simulation results, two things are worth observing. In the winding section, all activities involve more waiting time and more numbers wait requiring to be processed. Figure 8 shows utilization of various sections in the pump assembly line [18].
A careful review of Figure 8 indicates that the resources in the winding section have greater utilization than that in the main assembly section. Some of the processes in main assembly section also have a utilization value closer to 1, particularly for the activities happening at the testing and packing station. In testing and packing stations queues pile up while setting up the pump in the test bench for load testing. The industry has only one test bench facility. Packing of a pump assembly does not happen immediately after its testing. In fact, it begins only at the end of the day after the completion of load testing of all the pumps produced. As a result, more waiting time is noticed in the packing station. Since the pumps are cumulated and then processed for packing, utilization indicated in Figure 8 is pseudo and hence packing cannot be taken as a bottleneck.
Out of the seven activities in the winding section shown in Figure 8, it can be seen that four activities have a utilization of unity and one very close to unity. These high utilization values prompted further studies in the winding section. A thorough study of this section indicated overloading of workers in the winding section and further it was found that insufficient man power was allocated to the winding section. Work study of the main assembly and winding sections revealed that winding operation involved more intricate tasks in comparison with that in the main assembly section. Also, from the perspective of human factors, the activities in the winding section being repetitive, the workers were found doing the task in standing posture for long durations, with increased paceandwith very minimal breaks to finish their stipulated target. A close interaction with the workers revealed the prevalence of body pain and discomfort during work. Ergonomic assessment of the work postures and work benches indicated table height-bottom rest distance incompatibility among workers. As a result, workers find standing posture more comfortable even for long and repetitive tasks. Data collected from another perspective indicates that if one of the workers in winding section is absent for a day, the productivity reduces by almost 12-16 pumps on the average. Further, it was observed in the industry that workers in main assembly section for a particular variety are redeployed for the assembly of another variety of pumps which increases the WIP of 1.0 HP Mono-block Single phase-Big flow pump thereby affecting its delivery schedule. All these issues can safely be attributed to the shortage of manpower in the winding section. Hence, winding section was considered as the bottleneck that affects the entire output of the assembly line.
Proposal of alternate solution
Results of simulation were presented to the top management and although it was accepted that winding section is indeed the bottleneck, the possibility of adding one more test bench in the testing station was temporarily ruled out in view of heavy investments [19].
To propose an alternative solution, it was decided to study the effect of allocating an additional resource to each activity in the winding section using simulation. The total number of activities in winding section is seven. The suggestion was implemented immediately by the deployment of one additional resource to each activity in the winding section except burnishing. Burnishing was carried out using a drilling machine. The industry has only one such machine and adding one more machine would not be economically viable. Hence, for six activities in the winding section, additional resource was added. This additional resource allocation was represented by a table with an operator in ARENA environment and the new situation was simulated using the set option available in ARENA. The results of simulation are presented in Figure 9. It can now be seen that additional resource allocation has considerably reduced the overload in the winding section as revealed by their utilization values. Simulation of the modified situation was presented to the top management and the suggestion was implemented immediately.
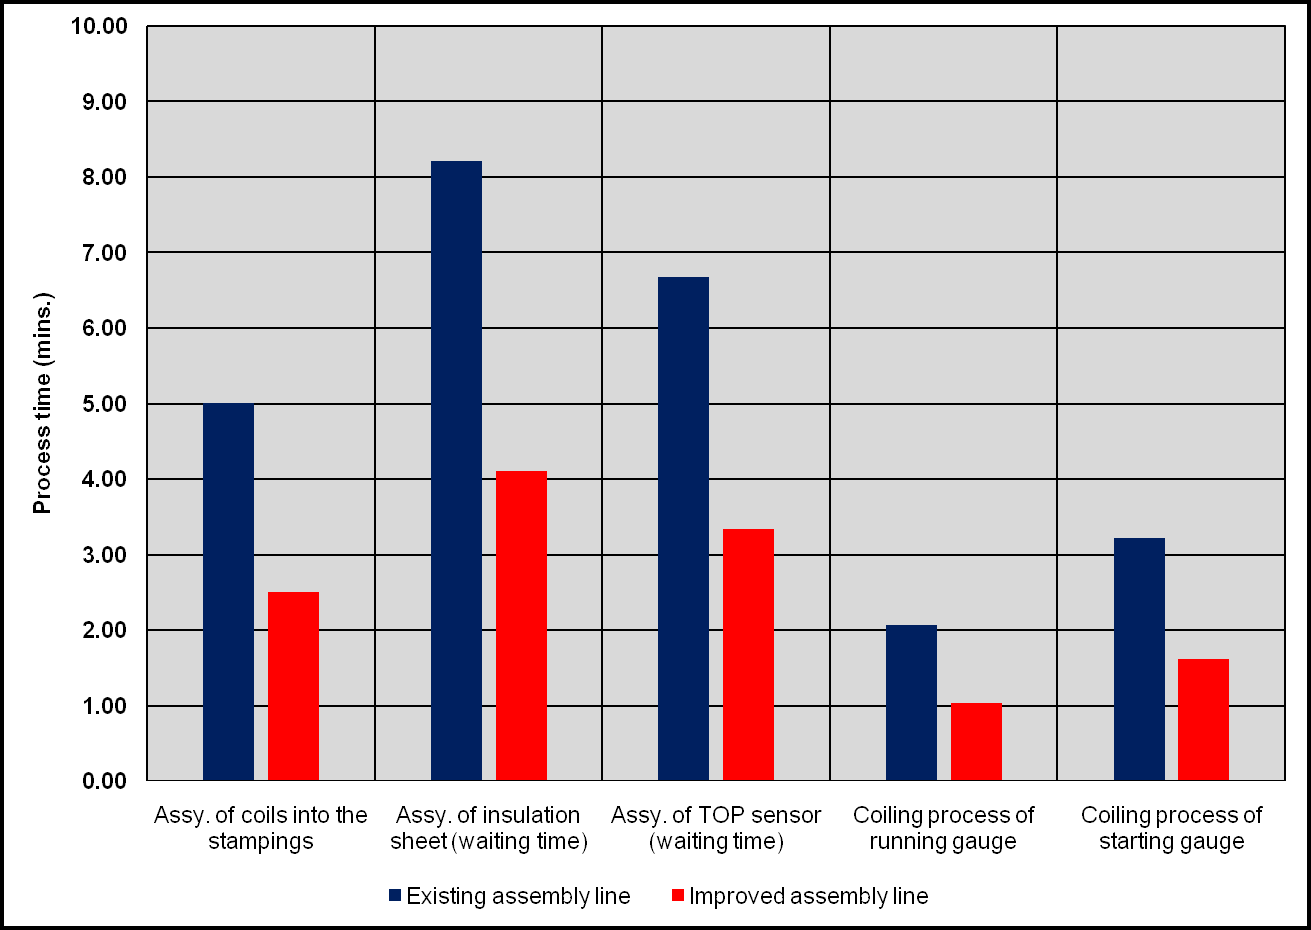
A comparison of the results of simulation before and after improvement for all the processes in the winding section is presented in Table 2. Since winding section is the bottleneck here, comparison is presented only for this section. For activities happening in main assembly section, there is no change in the simulation output.
| Performance Metrics | Winding section | % improvement | |
|---|---|---|---|
| Before improvement | After improvement | ||
Numbers out (units) |
127 |
169 |
0.33 |
VA time (min.) |
25.49 |
36.12 |
0.4171 |
Assy. of coils into the stampings (min.) |
5.01 |
2.5 |
0.5 |
Assy. of insulation sheet (waiting time, min.) |
8.21 |
4.11 |
0.5 |
Assy. of TOP sensor (waiting time, min.) |
6.68 |
3.33 |
0.5 |
Coiling process of running gauge, min. |
2.06 |
1.03 |
0.5 |
Coiling process of starting gauge, min. |
3.22 |
1.61 |
0.5 |
Table 2: Comparison of Simulation outputs.
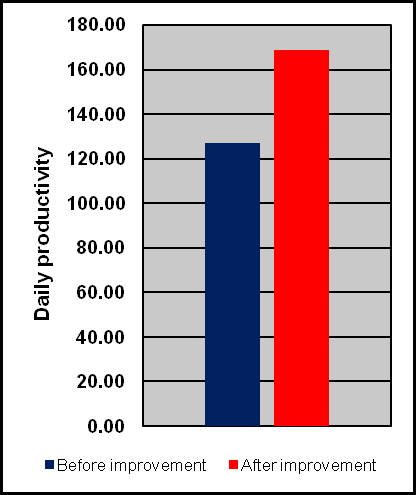
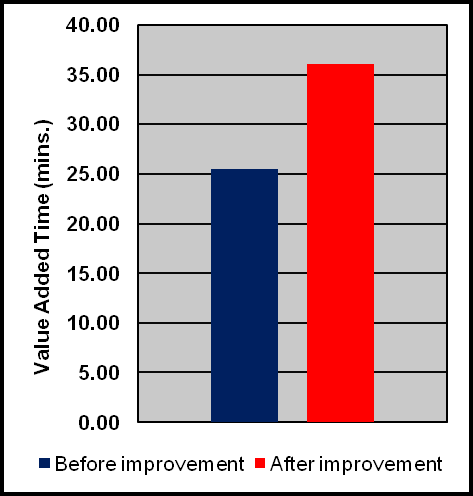
Simulation of the modified situation indicated reduction in the waiting time and numbers waiting for all the activities in the winding section by half. The total output of the assembly line increased to 169 units, as shown in Appendix 3; increasing the productivity by 33%. It can also be noted that the utilization of all resources in the winding section is brought down from 100% indicating a reduction in the overload and the numbers waiting has been reduced by 50%. It should be noted that additional resource deployment was not suggested as a straight forward solution but on the basis of a thorough analysis of the job content of various workers, work load balancing, analysis of human factors and multiple rounds of discussions with the plant head and top management. The value-added time for the entire assembly process increased from 25.49 to 36.12 minutes, all these improvements are represented graphically in Figures 10-12.
Conclusion
Application of industrial engineering tools and simulation to identify and eliminate bottlenecks in a real-life manufacturing environment was demonstrated with a case study. It can be understood that simulation of a manufacturing system and the interpretation of its results takes into consideration many aspects of industrial engineering. Bottleneck identification requires careful study and analysis of the existing process. Provision of additional resources to eliminate the bottleneck, although rare, is put down as a useful suggestion by many in the managerial level due to the associated cost implications. This case study is one out of many cases where such a suggestion brought about an improvement in productivity. Although, this would not work in all the cases, such a suggestion should be made only on the basis of a careful consideration of all the associated factors and their implications to the overall cost of manufacture and operation. In this particular case, additional resource deployment for all the activities in winding section resulted in a 50% reduction in the process time and 41.71% improvement in the value-added time. The daily productivity of the assembly line has improved by 33% for the variety taken for study, namely 1.0 HP Monoblock single phase-Big flow pump.
Acknowledgement
The authors gratefully acknowledge the support extended by Ms. G. APRAJITHA, Managing Director, G.R Motors and pumps for permitting us to study and collect the data related to this work in their reputed industry.
References
- Banks J (2005) Discrete event system simulation. Pearson Education India. [Crossref][Google Scholar]
- Singhania RH, Bilolikar VS. (2017) Application of simulation for manufacturing system management-A case study.J Strategic Innovation Sustainability. 126-135.[Google Scholar]
- Talapatra S, Tarannum R, Shefa J (2018) Simulation Modeling for Productivity Improvement of a Production Line: A Case Study. Int Conf Ind Eng Oper Manag 26-27. [Google Scholar]
- Nyembaand WR, Mbohwa C (2017) Modelling, simulation and optimization of the materials flow of a multi-product assembling plant. Procedia Manufac 8: 59-66. [Crossref][Google Scholar]
- Zahraee SM, Golroudbary SR, Hashemi A, Afshar J, Haghighi M, et al. (2014) Simulation of manufacturing production line based on Arena. In Adv Mat Res 933: 744-748. [Crossref][Google Scholar]
- Shawki KM, Kilani K, Gomaa MA (2015) Analysis of earth-moving systems using discrete-event simulation. Alex Eng J 54: 533-540. [Crossref][Google Scholar]
- Heshmat M, El Sharief MA, El Sebaie MG (2013) Simulation modeling of automatic production lines with intermediate buffers. JES. J Eng Sci 41: 2175-2189. [Crossref][Google Scholar]
- Patil MN, Namgare ST (2018) A Line balancing of the Welding Machine Assembly Line Using ARENA Simulation Software: A Case Study of a Manufacturing Industry, Int J adv res 7.
- Hashemi AS, Sattarvand J (2015) Application of ARENA simulation software for evaluation of open pit mining transportation systems–a case study. Springer 213-224. [Google Scholar]
- Tayal A, Kalsi NS, Gupta MK, Pimenov DY, Sarikaya M, et al. (2021) Effectiveness improvement in manufacturing industry; trilogy study and open innovation dynamics. J Open Innova: Tech, Mark, Complex 7: 7. [Crossref][Google Scholar]
- Bobby John E, Jenson Joseph (2013) Analysis and Simulation of Factory Layout using ARENA, Int J Sci Res Pubs 3. [Google Scholar]
- Ball MO. Magazine MJ (1988) Sequencing of insertions in printed circuit board assembly. Oper Res 36: 192-201. [Crossref][Google Scholar]
- Tushar Kumbhani D, Mukesh Chaudhari C (2018) Concrete Mixture Assembly Line Improvement using ARENA Simulation-A Case Study. Int J Trend Res Devp 2: 398-402. [Crossref]
- Marsudi M, Shafeek H (2013) The evaluation of production line performance by using ARENA-a case study. Int J Mech Aerospace, Industrial, Mechatron Manuf Eng 7: 1831-1835. [Crossref][Google Scholar]
- Azadivar F, Wang J (2000) Facility layout optimization using simulation and genetic algorithms. Int J Prod Res 38: 4369-4383. [Crossref][Google Scholar]
- Jilcha K, Berhan E, Sherif H (2015) Workers and machine performance modelling in manufacturing system using arena simulation. J Com Sci Sys Bio 8: 185. [Crossref][Google Scholar]
- Kikolski M (2016) Identification of production bottlenecks with the use of Plant Simulation software. Eng Manag Prod Ser 8: 103-112.[Crossref][Google Scholar]
- Krishnan S, Dev AS, Suresh R, Sumesh A, Rameshkumar K, et al. (2018) Bottleneck identification in a tyre manufacturing plant using simulation analysis and productivity improvement. Mat Today: Proc 5: 24720-24730. [Crossref][Google Scholar]
- Kleindorfer PR, Singhal K, Van Wassenhove LN (2005) Sustainable operations management. Prod oper manag 14: 482-492. [Crossref][Google Scholar]
 Spanish
  Chinese
  Russian
  German
  French
  Japanese
  Portuguese
  Hindi
Hindi 