Spanish
  Chinese
  Russian
  German
  French
  Japanese
  Portuguese
  Hindi
Hindi Research Article, J Hydrogeol Hydrol Eng Vol: 12 Issue: 2
Regional Distribution of Intensity Duration Frequency (IDF) Relationships in Sultanate of Oman
Prerana Chitrakar1, Ahmad Sana1* and Sheikha Hamood Nasser Almalki2
1Department of Civil and Architectural Engineering, Sultan Qaboos University, Muscat, Oman
2Department of Agriculture, Ministry of Agriculture Fisheries Wealth and Water Resources, Muscat, Oman
*Corresponding Author: Ahmad Sana
Department of Civil and Architectural Engineering, Sultan Qaboos University, Muscat, Oman
Tel: 96899658036
E-mail: sana@squ.edu.om
Received date: 10 November, 2022, Manuscript No. JHHE-22-79469;
Editor assigned date: 14 November, 2022, PreQC No. JHHE-22-79469 (PQ);
Reviewed date: 28 November, 2022, QC No. JHHE-22-79469;
Revised date: 10 April, 2023, Manuscript No. JHHE-22-79469 (R);
Published date: 18 April, 2023, DOI: 10.4172/2325-9647.1000256
Citation: Chitrakar P, Sana A, Almalki SHN (2023) Regional Distribution of Intensity-Duration-Frequency (IDF) Relationships in Sultanate of Oman. J Hydrogeol Hydrol Eng 12:2.
Abstract
Analysis of extreme rainfall parameters including rainfall intensities is a fundamental requisite in safe planning, designing, and operating various hydrologic and water engineering projects against storms and floods. In arid and semi-arid regions, such as Oman, sufficient long term rainfall data with short aggregation are usually not available in most locations across the country. This paper presents the development of Intensity Duration Frequency (IDF) curves using the available rainfall data from 65 metrological stations situated at different elevations and regions throughout Oman. Gumbel distribution was fitted to the observed data and rainfall intensities were found for various return periods. Rainfall analysis showed the average annual rainfall of 109.21 mm with a standard deviation of 92.82 mm, skewness coefficient of 1.62 and kurtosis coefficient of 3.08 for all the studied stations from 1977 to 2017. The statistical analysis showed that the estimated rainfall intensities for various return periods are high in the mountainous region compared to the desert or interior region, and the coastal region of the country. Also, the empirical parameters of IDF formula for all studied stations were established using non-linear regression. Finally, the contour maps for all the parameters were drawn which could be used to determine the IDF relationships for ungauged locations. This study will be useful for the decision makers and practicing hydrologists for planning and design of water resources systems in Oman.
Keywords: Regional IDF curves; Rainfall data analysis; Gumbel distribution; Ungauged catchments
Introduction
Rainfall is a fundamental constituent of the hydrological cycle. Consequently, the determination of rainfall events is important for planning and designing of any hydrologic project including storm and drainage designs, geotechnical and structural projects, water resources systems, and others. However, the development of any hydrological project is highly challenging in the arid region where the rainfall is largely random and erratic both temporally and spatially. The changes in precipitation as the result of extreme weather events in the water scare arid countries is often facing long-term droughts and flash floods; damaging coastal, residential and agricultural areas and its natural habitats in the arid region. The recent climate change is considered as one of the major challenges for water supply systems and flood risk analysis works. Thus, the quantification of rainfall is performed using Intensity Duration Frequency (IDF) curve as a tool, to implicate safe design and cost efficiency to the hydrologic and engineering projects for certain return period. The site specific IDF is used to study the relationship between rainfall intensity, duration and frequency (or return period) associated with the site location and amenities [1].
The IDF relationship was first presented in early 1930 by Bernard. Since then, different form IDF relationship have been established by many researchers in the field of engineering, hydrology and environmental studies in several regions of the world. IDF formula was developed by Bell and Chen for few regions of United State. Koutsoyiannis, et al. constructed the mathematical framework of IDF curve using data from both rainfall recording and non-recording stations based on probability distribution [2]. But, the probability distributions are considered as stationary and do not change with time. Whereas, the climate change is likely to alter the climatic extremes over the time, given the stationary IDF curve approach often underestimates the precipitation extremes. Several studies using nonstationary model using climate indices as covariates were explored in few studies. Raiford et al. updated the existing IDF curves for the different region of United States; and, acquired those curves at ungauged sites throughout the region using the newly developed rainfall frequency analysis methods. El-Sayed used iso-pluvial maps in Egypt; Awadallah, et al., used regional analysis and satellite data in Angola. Yu, et al., used scaling theory in Taiwan; Ouali and Cannon used quantile regression technique in Canada for developing the regional IDF at the ungauged sites. Likewise, Noor proposed method for IDF curve construction with related uncertainty at the ungauged sites using bias correction of satellite rainfall data and its comparison with the observed IDF curve.
Several researchers have developed the IDF curve for the arid Arabian Peninsula using both empirical formulae and frequency analysis. Various theoretical distribution functions Generalized Extreme Values (GEV), Gumbel distribution, Generalized Pareto Distribution (GPD), log pearson type III, log normal, exponential distribution and others) are normally used in frequency analysis. Al Shaikh, and Al Areeq, et al. used gumbel distribution for development of IDF curve in various region of Saudi Arabia. Elsebaie, Al-Amir and Subyan used both gumbel and log pearson III distribution; while, AlHassoun, et al. Al-anazi and El-Sebaie, et al. used gumbel, log pearson III, and log normal distribution for development of IDF curve in several locations of Saudi Arabia. There studies did not showed much difference in the rainfall analysis of IDF curve for gumbel and log pearson type III distribution for the semiarid and flat topographic region [3].
The development of IDF relationship requires the long-term and continuous historic rainfall data, which is typically not available in most semiarid and arid region countries including Sultanate of Oman. Also, the precipitation events in the region are rare but usually of high intensities in the short duration, resulting in flash floods in an interannual scales. Precipitation frequency analysis is equally important in nonstructural problems concerning natural risks related with ultimate rainfall events [4]. The data required to compute IDF curves are a record of rainfall depth measurements during fixed intervals of time, normally 5 minutes intervals. Thus, the coarse-resolution precipitation data in converted into the fine time-resolution precipitation using the temporal disaggregation technique [5].
Very limited studies in rainfall analysis and climate change projection has been conducted for Oman. Awadallah designed a storm hyetograph of few stations located at the Northern coastal zone of Oman using Alternating Block Method (ABM)-IDF curve method. While, Uraba has developed the IDF curve for Tawi-Atair station in Dhofar region of Southern Oman using two-stage downscaling disaggregation approach. Thus, the IDF relationships are not available for most of the regions in Oman. In the absence of a properly developed IDF relations hip, the planning and development of water resources system such as recharge dams, flood protection structures, storm water collection networks and other projects may result in improper design [6]. Also, the developed IDF curves can be adopted to quantify the rainfall rate and predict the flooding for any region. Therefore, this research aims to develop IDF curves for the Oman, by analyzing rainfall data at multiple metrological stations situated at different elevations and regions throughout the country using Gumbel distribution [7]. The empirical formulae were also developed to evaluate rainfall intensity for several rainfall durations and return periods. Further, the contour maps for all the observed parameters were drawn to establish the IDF relationships for the ungauged location for future prediction and designs.
Materials and Methods
Study area and data collection
Oman (Sultanate of Oman) lies in the southeastern corner of the Arabian Peninsula with total area of 309,500 km2 and coastline of 3165 km. It extends between latitudes of 16°C 40' and 26°C 20' N and longitudes of 51°C 50' and 59°C 40' E. The country is bordered by Arabian Gulf on the North, Sea of Oman on East, Arabian Sea on Southwest, United Arab Emirates and Saudi Arabia on West, and Yemen on Southwest as shown in Figure 1. Topographically, it is divided into three areas; the coastal plain (fertile plain) extends from Al Batinah plain in North to Salalah plain in South, mountainous region runs from Musandam in the North to Ras Al-Hadd in the Southeast and in Dhofar province, and the internal region (desert, gravel and sand plain) ranges in between the coastal plain and mountainous region covering 82% of the country [8].
Based on rainfall, Oman experiences the hyper arid (<100 mm rain), arid (100 mm-250 mm rain) and semiarid (250 mm-500 mm rain) climate at the various parts of the country. The long-term average annual rainfall of the country has been estimated to be 62 mm. Average annual rainfalls in the desert and coastal plain is less than 50 mm; while the rainfall in mountain region is up to 350 mm, and is relatively frequent providing recharge to the aquifers situated at the coastal and interior plains. Seasonal summer monsoon is observed from June to September in Southern parts of the country, especially in Dhofar governorate causing change in temperature. Whereas, the rainfall occurs during winter from November to April in the Northern and Central region of the country [9]. In summer, the weather is hot and humid in the coastal region, hot and dry in interior region; while, the weather is moderate and rainy throughout the year in the highlands. Rainfall in the country is associated by four principal mechanism; convection rainstorms related with localized strong convection developed mostly in summer, cold front trough from Mediterranean Sea or North Atlantic that brings rainfall to Northern part of Oman especially from November to April, tropical cyclones originated from Arabian Sea typically from May to June and October to November, and on-shore Southwesterly monsoon current that causes humid environment and brings frequent drizzle, mist, fog, rain in Dhofar region from June to September [10].
In this study, the rainfall data were obtained from the Ministry of Regional Municipalities and Water Resources (MRMWR). Oman is divided into eleven governorates, namely; Musandam, Al-Buraimi, Al-Batinah North, Al Batinah South, Muscat, Adh Dhahirah, Ad- Dakhaliya, Al-Sharqia North, Ash-Sharqia South, Al-Wusta, and Dhofar. Sixty five monitoring stations are selected to cover the ten governorates in the country. Al Wusta govenerate, the desert area is not considered in the study due to lack of enough stations and data for analysis. The selected stations had homogenous and short time interval record for longer period [11]. The record length varies from one station to another, which was because of some missing years of data and initial years of gauge installation at the sites. The record periods were between 20 years to 40 years of rainfall data. The location details and years of record of stations that were used for this study are shown in the following Table 1 and Figure 1.
| S.N. | Governorate | Station name | Easting | Northing | Elevation (m) | Years of record | Length of records (years) |
|---|---|---|---|---|---|---|---|
| 1 | Musandam | Ghamda | 414500 | 2887100 | 45 | 1981-2017 | 37 |
| 2 | Khasab | 424300 | 2892800 | 37 | 1983-2017 | 35 | |
| 3 | Rhaibah | 421936 | 2879218 | 704 | 1986-2016 | 31 | |
| 4 | Sal Ala | 436466 | 2880987 | 171 | 1983-2016 | 34 | |
| 5 | Sima | 430384 | 2884322 | 129 | 1981-2017 | 37 | |
| 6 | Al Buraimi | Al Juwayf | 408900 | 2715000 | 634 | 1996-2016 | 21 |
| 7 | AL Ubaylah | 413619 | 2679851 | 604 | 1997-2016 | 20 | |
| 8 | Fayyad | 415400 | 2658600 | 626 | 1995-2014 | 22 | |
| 9 | Khatwah | 409000 | 2689600 | 622 | 1995-2014 | 20 | |
| 10 | Mahdah | 396900 | 2698800 | 437 | 1985-2016 | 32 | |
| 11 | Wadi Salmah | 377500 | 2682700 | 300 | 1982-2017 | 36 | |
| 12 | Wadi Sharm | 395400 | 2710700 | 452 | 1989-2016 | 28 | |
| 13 | Al Batinah North | Al Ghuzayfah | 449210 | 2652513 | 510 | 1989-2017 | 29 |
| 14 | Al Jizzi | 450426 | 2689150 | 167 | 1995-2016 | 22 | |
| 15 | Aqair Al Abreein | 461672 | 2629031 | 741 | 1997-2016 | 20 | |
| 16 | Aqbat Al Risah | 444008 | 2671956 | 516 | 1995-2017 | 23 | |
| 17 | Hayl Al Najd | 478400 | 2622600 | 922 | 1997-2016 | 20 | |
| 18 | Saham | 488292 | 2669695 | 12 | 1988-2016 | 29 | |
| 19 | Al Batinah South | Al Miseen | 580300 | 2582000 | 363 | 1993-2016 | 24 |
| 20 | Al Wasit | 588000 | 2604500 | 118 | 1993-2016 | 24 | |
| 21 | Ar Rustaq | 543500 | 2590700 | 309 | 1991-2016 | 26 | |
| 22 | Barka | 589700 | 2615200 | 29 | 1988-2016 | 29 | |
| 23 | Dhabaah | 511800 | 2592900 | 916 | 1983-2016 | 34 | |
| 24 | Salma | 538700 | 2567700 | 1124 | 1992-2016 | 25 | |
| 25 | Muscat | Buei | 662700 | 2572500 | 433 | 1994-2016 | 23 |
| 26 | Hayfadh | 678100 | 2580700 | 208 | 1995-2016 | 22 | |
| 27 | Mazara | 690200 | 2554900 | 130 | 1981-2016 | 36 | |
| 28 | Muscat | 662400 | 2612200 | 7 | 1992-2016 | 25 | |
| 29 | Ruwi | 657100 | 2610600 | 25 | 1986-2016 | 31 | |
| 30 | Wadi Al Jannah | 650700 | 2586200 | 220 | 1987-2015 | 29 | |
| 31 | Wadi Al Khawd | 614400 | 2608000 | 71 | 1986-2013 | 28 | |
| 32 | Adh Dhahirah | Dakarah | 496725 | 2597564 | 916 | 1998-2017 | 20 |
| 33 | Dank | 424900 | 2606400 | 348 | 1977-2017 | 41 | |
| 34 | Dhahir | 460765 | 2621761 | 860 | 1996-2017 | 22 | |
| 35 | Kubarah | 481227 | 2553396 | 481 | 1995-2017 | 23 | |
| 36 | Majzi | 468957 | 2603338 | 738 | 1997-2016 | 20 | |
| 37 | Qarn Al Kabsa | 469440 | 2585836 | 503 | 1992-2016 | 25 | |
| 38 | Tanam | 445600 | 2559100 | 318 | 1986-2016 | 31 | |
| 39 | Ad Dakhliyah | Al Qusaiba | 508800 | 2494000 | 373 | 1995-2016 | 22 |
| 40 | Jiwar | 508100 | 2517500 | 549 | 1995-2016 | 22 | |
| 41 | MOD | 572100 | 2543200 | 1475 | 1993-2016 | 24 | |
| 42 | Musbit | 625400 | 2577600 | 384 | 1995-2016 | 22 | |
| 43 | Najd Al Musallah | 503000 | 2541900 | 642 | 1994-2016 | 23 | |
| 44 | Subayb | 515100 | 2567400 | 1345 | 1994-2016 | 23 | |
| 45 | Tawi Zahir | 588800 | 2546800 | 748 | 1994-2016 | 23 | |
| 46 | Ash Sharqiya North | Ad Dariz | 671300 | 2497700 | 348 | 1995-2014 | 20 |
| 47 | Al Mudaybi | 615500 | 2497100 | 409 | 1994-2014 | 21 | |
| 48 | Al Muqayhfah | 625600 | 2545400 | 681 | 1995-2014 | 20 | |
| 49 | Haimah | 646000 | 2526300 | 552 | 1994-2016 | 23 | |
| 50 | Ibra | 656300 | 2514500 | 455 | 1982-2016 | 35 | |
| 51 | Masroon | 645300 | 2493900 | 441 | 1995-2014 | 20 | |
| 52 | Wadi Bani Khalid | 713600 | 2500900 | 624 | 1995-2016 | 22 | |
| 53 | Ash Sharqiya South | Al Fujayj | 742900 | 2481900 | 113 | 1987-2015 | 29 |
| 54 | Fins | 725100 | 2538100 | 25 | 1993-2015 | 23 | |
| 55 | Jaalan Bani | 736700 | 2443900 | 118 | 1993-2016 | 24 | |
| 56 | Jabal Bani Jabir | 707600 | 2523600 | 1616 | 1993-2017 | 25 | |
| 57 | Snaf | 738791 | 2500297 | 417 | 1997-2016 | 20 | |
| 58 | Tahwah | 731100 | 2479100 | 223 | 1986-2016 | 31 | |
| 59 | Dhofar | Aqarhanawt | 248075 | 1893740 | 937 | 1996-2016 | 21 |
| 60 | Ghadow | 179100 | 1895700 | 763 | 1995-2017 | 23 | |
| 61 | Hagayf | 184600 | 1907200 | 896 | 1990-2017 | 28 | |
| 62 | Mughsayl | 164600 | 1871000 | 75 | 1993-2017 | 25 | |
| 63 | Sadh | 294100 | 1887500 | 40 | 1997-2016 | 20 | |
| 64 | Sher | 199600 | 1900700 | 525 | 1997-2017 | 21 | |
| 65 | Zayk | 196900 | 1911800 | 831 | 1987-2016 | 30 |
Table 1: Station detail with year and length of rainfall records.

Figure 1: Study area (FMO, 2022).
Methodology and data analysis
Estimation of IDF curves involved various steps. Initially the rainfall data were analyzed and disaggregated for the shorter period [12]. Collected data from monitoring stations were initially sorted according to the years, rainfall depth and duration. Disaggregation of rainfall data to shorter and regular period was done using the Hydrologic Engineering Center’s (HEC) Data Storage System Visual Utility Engine (HEC-DSSVue) software. Maximum rainfall depth is acquired for each monitored year and various set of duration. Statistical analysis such as mean and standard deviation of the maximum rainfall depth were also obtained for various durations [13].
Development of IDF is performed by fitting the probability distribution function to extreme rainfall data for specific durations. Based on measurements and fitted relationship, the rainfall intensity over specific duration and return period are determined for the recorded years. Gumbel distribution is used for frequency analysis of the annual maximum rainfall data for the calculation of rainfall depth for each return period. Design durations of 5, 15, 15, 30, 60, 360, 720, 1440 min, and return periods of 2, 5, 10, 25, 50 and 100 years were used in the present study [14].
Further, the parameters of the IDF relationship proposed by Bernard are obtained using regression. Finally, the contour maps for all the parameters were drawn using surfer software for determining the IDF relationships for ungauged locations.
Gumbel distribution
Extreme value type I (Gumbel) distribution, proposed by German mathematician Emil Gumbel is widely used for modeling extreme events in the field of water resources engineering. The distribution had over 50 applications ranging from data investigation of rainfall, flood, earthquake, pollution, environmental quality data, sea currents and other owing to its suitability for modeling maxima. For the development of IDF curves; it is widely used because of its simplicity [15]. In addition, it can be used to reach a higher level of safety by finding higher intensities for shorter duration in the absence of data.
As per Gumbel method the rainfall of specific return period for any desired duration is calculated. The frequency of the Precipitation (PT) in mm for all time intervals with a particular return period (T) in years is computed using the following equations;
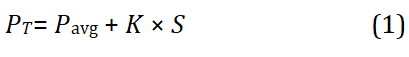
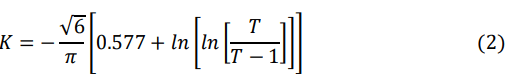
Where, K is the Gumbel frequency factor calculated by equation (2) as suggested by Chow.
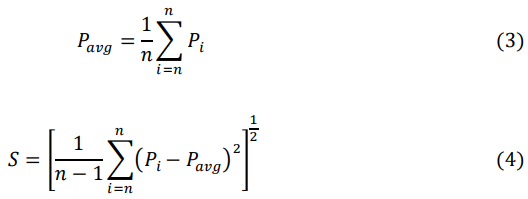
Pavg and S are the average and standard deviation of the maximum precipitation corresponding to a specific duration, calculated using equation (3), and equation (4), respectively. Where, Pi is the individual extreme value of rainfall, and n is the number of events or years of record.
The K is the function of sample size and the return period, thus when multiplied by standard deviation provides the average rainfall of a desired return period. The rainfall intensity IT (mm/hr) for the return period Td is calculated using equation (5).
Derivation of IDF empirical formula
The relationship between the rainfall intensity (I), rainfall duration (d), and the return period (TR) is defined by the IDF empirical formula. Several steps are followed to establish an equation for the calculation of rainfall intensity for a specific rainfall period and recurrence interval, which is dependent mainly on the results from the IDF curves. In the study the widely used Bernard equation Bernard, et al. is selected to establish the IDF relationship [16]. The following steps and equations were used to the IDF relationship.
Where, I is the rainfall intensity (mm/hr), d is the rainfall duration (minutes), T is the return period (years) and the empirical parameters (C, m, and e). Using logarithmic transformation equation (6) can be expressed as;

Further, for a particular T, considering K as a constant;
Equation (7) is rewritten as;

The plot of the logarithm of rainfall intensity (log I) against the logarithm of time (log d) for a specific return period results in a straight line for equation (8). From the linear relation the value of log K (intercept) and e (slope) are derived from each return period plot. The average of the values of e represents the empirical parameter e. The parameter C and m is obtained using logarithmic transformation of equation (8);
By plotting the log K and log TR in the straight line, the slope (m) and intercepts (log C) are derived. Finally, the values of C, m, and e are substituted in Eq. (6) to obtain the IDF equation.
The least squares goodness of fit method was used to evaluate the accuracy the observed and calculated rainfall intensities. The goodness of fit is checked using the calculation of coefficient of determination (R2).
Contourplots
The contour of the calculated IDF parameters were plotted using surfer software. The software is mostly used for 3D surface mapping, contour mapping, terrain modeling and others [17]. Kriging interpolation method was used for contouring of the parameters. It is a best unbiased linear estimation method Isaaks and Srivastava, et al. and a flexible gridding method that incorporates underlying trends and anisotropy in the natural and efficient manner.
Results and Discussion
Rainfall analysis
Statistical analysis of the annual rainfall (total rainfall) for 65 study location of Oman from year 1977 to 2017 is shown in Table 2. All the monitoring stations have demonstrated highly variable annual rainfall over the study period. Both annual maximum rainfall of 806.29 mm and minimum rainfall of 9.39 mm were observed in Muscat governorate. The skewness coefficient and kurtosis coefficient measures the asymmetry and peakedness or flatness of the frequency distribution of the data. Negative kurtosis and positive kurtosis values indicate the distribution is flatter and sharper in its center than the normal distribution, respectively [18]. Kurtosis coefficient is in the range of -1.429 to 8.167 during the study period that shows higher occurrence of probability near the mean than that in the normal distribution.
| Governorate | Station name | Maximum (mm) | Minimum (mm) | Average (mm) | Standard deviation (mm) | Skewness coefficient | Kurtosis coefficient |
|---|---|---|---|---|---|---|---|
| Musandam | Ghamda | 536.15 | 15.79 | 165.11 | 125.24 | 1.14 | 0.99 |
| Khasab | 426.43 | 10.11 | 136.54 | 109.98 | 1.07 | 0.6 | |
| Rhaibah | 515.36 | 17.73 | 185.22 | 126.61 | 0.75 | 0.15 | |
| Sal Ala | 489.34 | 17.64 | 123.25 | 110.69 | 1.8 | 3.42 | |
| Sima | 438.03 | 13.2 | 128.53 | 99.02 | 1.38 | 1.99 | |
| Al-Buraimi | Al-Juwayf | 344.87 | 23.23 | 99.97 | 80.19 | 1.88 | 3.87 |
| Al-Ubaylah | 302.11 | 10.04 | 69.81 | 72.73 | 2.01 | 4.51 | |
| Fayyad | 270.44 | 15.21 | 96.84 | 63.02 | 1.2 | 1.51 | |
| Khatwah | 274.45 | 17.33 | 48.3 | 66 | 2.66 | 7.19 | |
| Mahdah | 285.1 | 18.8 | 95.37 | 70.89 | 0.88 | 0.34 | |
| Wadi Salmah | 224.97 | 19.43 | 64.63 | 48.3 | 1.47 | 2.79 | |
| Wadi Sharm | 269.08 | 10.07 | 80.4 | 63.86 | 1.17 | 1.45 | |
| Al Batinah North | Al-Ghuzayfah | 326.91 | 9.66 | 88.61 | 74.73 | 1.99 | 3.91 |
| Al-Jizzi | 203.23 | 16.35 | 74.05 | 51.45 | 1.09 | 0.44 | |
| Aqair Al-Abreein | 415.5 | 13.53 | 110.78 | 108.96 | 1.61 | 2.35 | |
| Aqbat Al-Risah | 319.66 | 14.16 | 92.97 | 84.92 | 1.45 | 1.45 | |
| Hayl Al-Najd | 486 | 20.03 | 102.72 | 106.91 | 2.63 | 6.62 | |
| Saham | 275.56 | 11.35 | 78.74 | 64.28 | 1.31 | 1.88 | |
| Al-Batinah South | Al-Miseen | 460.37 | 13.63 | 127.5 | 100.06 | 1.74 | 4.46 |
| Al-Wasit | 252.78 | 15.93 | 76.01 | 69.18 | 1.38 | 0.64 | |
| Ar-Rustaq | 297.25 | 12.36 | 103.06 | 79.76 | 0.94 | 0.16 | |
| Barka | 178.98 | 13.22 | 66.79 | 37 | 1.29 | 2.23 | |
| Dhabaah | 558.76 | 19.58 | 155.03 | 111.35 | 1.58 | 3.98 | |
| Salma | 374.25 | 11.73 | 161.92 | 111.2 | 0.23 | -1.09 | |
| Muscat | Buei | 469.21 | 18.44 | 124.22 | 125 | 1.53 | 1.83 |
| Hayfadh | 672.08 | 15.02 | 83.36 | 150.11 | 2.37 | 6.12 | |
| Mazara 3 | 526.25 | 13.65 | 136.92 | 121.18 | 1.77 | 3.22 | |
| Muscat | 271.03 | 10.95 | 70.67 | 68.34 | 1.93 | 3.16 | |
| Ruwi | 346.4 | 9.39 | 111.26 | 79.25 | 0.96 | 1.14 | |
| Wadi Al-Jannah | 166.6 | 39.83 | 62.81 | 25.6 | 2.61 | 7.07 | |
| Wadi Al-Khawd | 860.29 | 17.83 | 120.66 | 213.61 | 2.52 | 8.17 | |
| Adh-Dhahirah | Dakarah | 410.22 | 14.6 | 108.8 | 96.8 | 1.93 | 4.25 |
| Dank | 331.43 | 10.81 | 69.4 | 74.16 | 2.18 | 5.34 | |
| Dhahir | 368.31 | 10.04 | 92.39 | 90.38 | 1.74 | 3.6 | |
| Kubarah | 200.82 | 16.27 | 61.64 | 50.09 | 1.4 | 2.23 | |
| Majzi | 536.76 | 18.19 | 105.32 | 130.82 | 2.3 | 5.88 | |
| Qarn Al-Kabsa | 282.05 | 19.28 | 74.03 | 71.26 | 1.65 | 2.66 | |
| Tanam 2 | 196.2 | 13.56 | 61.14 | 50.34 | 1.14 | 0.59 | |
| Ad-Dakhliyah | Al-Qusaiba | 169.64 | 12.11 | 38.41 | 42.72 | 1.99 | 4.1 |
| Jiwar | 249.47 | 18.07 | 64.37 | 62.74 | 1.43 | 2.39 | |
| MOD | 734.87 | 23.96 | 180.21 | 155.67 | 2.15 | 6.31 | |
| Musbit | 279.87 | 11.68 | 78.73 | 66.2 | 1.93 | 3.99 | |
| Najd Al-Musallah | 331.48 | 10.2 | 104.79 | 81.14 | 1.14 | 1.39 | |
| Subayb | 655.5 | 27.5 | 307.1 | 225.47 | 0.16 | -1.43 | |
| Tawi Zahir | 497.43 | 11.99 | 142.37 | 109 | 1.85 | 4.79 | |
| Ash-Sharqiya North | Ad-Dariz | 334.47 | 17.08 | 72.57 | 81.71 | 1.97 | 4.8 |
| Al-Mudaybi | 331.62 | 12.66 | 73.02 | 79.98 | 2.05 | 4.66 | |
| Al-Muqayhfah | 334.47 | 16.08 | 73.07 | 81.55 | 1.96 | 4.81 | |
| Haimah | 392.14 | 11.25 | 127.87 | 110.7 | 1.47 | 1.28 | |
| Ibra | 382.48 | 10.49 | 113.17 | 96.76 | 1.47 | 1.49 | |
| Masroon | 344.81 | 12.57 | 80.05 | 76.89 | 2.46 | 7.21 | |
| Wadi Bani Khalid | 514.33 | 13.24 | 129.17 | 126.03 | 1.82 | 3.41 | |
| Ash-Sharqiya South | Al-Fuljayj | 442.46 | 10.65 | 84.9 | 95.27 | 2.39 | 6.8 |
| Fins | 306.3 | 14.86 | 93.68 | 78.06 | 1.22 | 1.02 | |
| Jaalan Bani | 216.87 | 20.09 | 64.64 | 49.94 | 2.51 | 5.93 | |
| Jabal Bani Jabir | 765.23 | 36.53 | 190.45 | 165.53 | 1.97 | 5.07 | |
| Snaf | 368.8 | 20.7 | 107.1 | 106.68 | 1.31 | 0.75 | |
| Tahwah 3 | 442.46 | 12.36 | 84.69 | 91.69 | 2.52 | 7.57 | |
| Dhofar | Aqarhanawt | 438 | 19.01 | 141.98 | 125.26 | 1.3 | 0.83 |
| Ghadow | 676.93 | 22.05 | 136.92 | 159.37 | 2.01 | 5.03 | |
| Hagayf | 411.15 | 11.95 | 108.61 | 102.48 | 2.03 | 3.98 | |
| Mughsayl | 173.97 | 13.52 | 83.34 | 45.09 | 0.1 | -0.78 | |
| Sadh | 156.41 | 33.21 | 66.45 | 34.2 | 1.38 | 1.35 | |
| Sher | 394.35 | 14.2 | 154.1 | 126.92 | 0.76 | -0.56 | |
| Zayk 1 | 340.5 | 10.46 | 98.05 | 73.22 | 1.09 | 2.73 | |
| All Station | 860.29 | 7.83 | 109.21* | 92.82* | 1.62* | 3.08* | |
Note: *Represents the average values |
|||||||
Table 2: Statistical information of annual rainfall (mm) at the monitoring stations.
Skewness coefficient in the range of 0.1 to 2.66 was observed for the stations. The observed positive skewed distribution exhibits much less frequency of occurrence of higher intensity rainfalls and the high frequency of occurrence of annual rainfall below the mean value.
The average annual rainfall exhibited for all studied stations from 1977 to 2017 is 109.21 mm with a standard deviation of 92.82 mm, Skewness coefficient of 1.62 and Kurtosis coefficient of 3.08. The observed highest average annual rainfall is 307.1 mm at Subayb, followed by 190.45 mm at Jabal Bani Jabir, 185.22 mm at Rhaibah and, 180.21 at MOD. While the lowest average of 38.41 mm at Al-Qusaiba, succeeded by 48.30 mm at Khatwah, 61.15 mm at Tanam, and 61.64 mm at Kubarah. Interestingly, both highest and lowest average annual rainfall was recorded in Ad-Dakhliyah governate. Geographically, Subayb, is in the mountainous range at 1345 m elevation, while Al-Qusaiba station is situated in the flat terrain closer to the Al-Wusta desert region at 373 m elevation. Thus, the study shows that the rainfall in the mountainous region is high compared to the desert and the coastal region of the country.
Variation of average annual rainfall (total rainfall) in various governorates of Oman from 1986 to 2016 is shown in Figure 2. The highest average of 432.74 mm was recorded in 1997 in Musandam governorate located at the Northern Oman. The years 1990 (382.22 Ash-Sharqiya North), 1997 (360.21 at Ad-Dakhliyah), 2007 (361.21 mm at Muscat), and 2010 (347.37 at Ash-Sharqiya South) also recorded the high average rainfall. The lowest average of 20.64 mm was observed in the year 2008 in Ash-Sharqiya North. Similarly, lowest averages were recorded in the years 2001 (20.68 mm at Al-Buraimi), 2008 (21.09 at Ash-Sharqiya North), 2001 (21.28 at Adh-Dhahirah), and 1985 (23.30 mm Muscat). For the study period of 1986 to 2016, a slightly negative trend in average annual rainfall of -1.195 mm/years was observed for overall stations (Figure 2). Among the studied region, Musandam governorate in Northern part of Oman has the highest annual average of 149.81 mm followed by Mountainous area Ad-Dakhaliyah (130.06 mm). The annual average of 113.54 mm, 111.54 mm, 108.02 mm, and 102.54 mm were observed in Dhofar, Al-Batinah South, Ash-Sharqia North and Muscat governorates. While the lowest annual averages were observed at Ash-Sharqiyah North (95.56 mm), Al-Batinah North (91.84 mm), Adh-Dhahirah (83.04 mm) and Al-Buraimi (82.838 mm).
Intensity Duration Frequency (IDF) relationships
Gumbel distribution is used to construct IDF curves for the monitoring stations using equation (1) and equation (2) using maximum rainfall records. Rainfall intensities for all the stations are estimated for corresponding rainfall duration (5, 15, 30, 60, 360, 720 and 1440 minutes) and return periods (2, 5, 10, 25, 50, and 100). Table 3 shows the calculated rainfall intensities at Rhibah, Aqbat Al-Risah, Wadi Al-Jannah, Subayb, and Mughsayl stations for return periods of 2, 5, 10, 25 and 100 years. The estimation showed the rainfall intensities increased with the return period, while the intensities decreased with the increase in the rainfall duration at all the stations. Subayb station at Ad-Dakhliah, the site with higher annual rainfall is likely to experience high rainfall with longer duration and return period compared to other stations.
Also, higher intensity rainfall at various return periods were witnessed at the higher elevation stations compared to the lower elevation station. Among the stations presented in Table 3, Subayb (elevation 1345 m) has the highest rainfall while Mughsayl (elevation 25 m) has the lowest rainfall for all the return period compared to the other stations. Similar observations were reported in Kotoub study, where the rational method was used to evaluate the rainfall intensities at various return periods for plain, hills and mountains region of Oman, for flood peak and wadi characteristic studies for road network development. These studies showed among three studied regions of Oman, Mountains has the higher intensities rainfall followed by hills, and plains has the lowest intensities rainfall for various return periods. Thus, in the mountainous region the estimated rainfall intensities for various return periods is high compared to the desert or interior region, and the coastal region of the country.
| Station (Governor ate) | Elevation (m) | Rainfall duration, d (hr) | Return period, T (years) | |||||
|---|---|---|---|---|---|---|---|---|
| 2 | 5 | 10 | 25 | 50 | 10 | |||
| Frequency factor, K | ||||||||
| -0.1644 | 0.7198 | 1.3052 | 2.0449 | 2.5936 | 3.1383 | |||
| Rainfall intensity-I (mm/hr) | ||||||||
| Rhibah (Musandam) | 704 | 0.833 | 36.04 | 69.9 | 92.32 | 120.65 | 141.67 | 162.53 |
| 0.25 | 21.65 | 41.04 | 53.88 | 70.11 | 82.15 | 94.1 | ||
| 0.5 | 16.58 | 29.19 | 37.54 | 48.09 | 55.91 | 63.68 | ||
| 1 | 11.92 | 19.54 | 24.59 | 30.97 | 35.71 | 40.4 | ||
| 360 | 3.58 | 6.16 | 7.87 | 10.03 | 11.63 | 13.22 | ||
| 720 | 2.5 | 3.97 | 4.94 | 6.17 | 7.08 | 7.98 | ||
| 1440 | 1.71 | 2.6 | 3.19 | 3.93 | 4.48 | 5.02 | ||
| Aqbat Al-Risah (Al-Batinah North) | 516 | 0.833 | 44.34 | 74.18 | 93.93 | 118.89 | 137.41 | 155.78 |
| 0.25 | 26.36 | 43.81 | 55.37 | 69.98 | 80.81 | 91.57 | ||
| 0.5 | 17.51 | 30.73 | 39.48 | 50.54 | 58.74 | 66.88 | ||
| 1 | 11.14 | 19.69 | 25.35 | 32.5 | 37.8 | 43.07 | ||
| 360 | 2.32 | 4.05 | 5.2 | 6.66 | 7.74 | 8.8 | ||
| 720 | 1.38 | 2.27 | 2.86 | 3.6 | 4.16 | 4.71 | ||
| 1440 | 0.87 | 1.39 | 1.72 | 2.15 | 2.47 | 2.78 | ||
| Wadi Al-Jannah (Muscat) | 220 | 0.833 | 18.78 | 39.97 | 54 | 71.72 | 84.87 | 97.92 |
| 0.25 | 8.87 | 19.8 | 27.04 | 36.19 | 42.97 | 49.7 | ||
| 0.5 | 5.94 | 12.07 | 16.13 | 21.26 | 25.06 | 28.84 | ||
| 1 | 3.65 | 7.12 | 9.42 | 12.33 | 14.48 | 16.62 | ||
| 360 | 0.89 | 1.63 | 2.12 | 2.74 | 3.2 | 3.65 | ||
| 720 | 0.56 | 1 | 1.3 | 1.67 | 1.95 | 2.22 | ||
| 1440 | 0.39 | 0.81 | 1.09 | 1.45 | 1.71 | 1.97 | ||
| Subayb (Ad-Dakhaliyah) | 1345 | 0.833 | 116.65 | 167.11 | 200.52 | 242.73 | 274.05 | 305.13 |
| 0.25 | 74.58 | 114.22 | 140.47 | 173.63 | 198.23 | 222.64 | ||
| 0.5 | 51.15 | 80.74 | 100.32 | 125.07 | 143.43 | 161.66 | ||
| 1 | 30.39 | 47.92 | 59.52 | 74.18 | 85.05 | 95.85 | ||
| 360 | 8.06 | 13.32 | 16.8 | 21.19 | 24.46 | 27.69 | ||
| 720 | 4.43 | 7.6 | 9.7 | 12.35 | 14.32 | 16.27 | ||
| 1440 | 2.6 | 4.5 | 5.76 | 7.35 | 8.53 | 9.7 | ||
| Mughsayl (Dhofar) | 25 | 0.833 | 15.29 | 35.23 | 48.42 | 65.1 | 77.47 | 89.75 |
| 0.25 | 8.24 | 18.91 | 25.97 | 34.89 | 41.51 | 48.08 | ||
| 0.5 | 5.69 | 12.5 | 17.01 | 22.71 | 26.93 | 31.13 | ||
| 1 | 3.94 | 7.71 | 10.21 | 13.36 | 15.7 | 18.02 | ||
| 360 | 1.1 | 2.2 | 2.93 | 3.86 | 4.54 | 5.22 | ||
| 720 | 0.76 | 1.44 | 1.9 | 2.47 | 2.9 | 3.32 | ||
| 1440 | 0.51 | 0.92 | 1.19 | 1.53 | 1.78 | 2.03 | ||
Table 3: Rainfall Intensity (mm/hr) at Rhibah, Aqbat Al Risah, Wadi Al Jannah, Subayb and Mughsayl station at various duration and return period.

Figure 2: Variation of average annual total rainfall in various governorate.
Intensity Duration Frequency (IDF) equation
Estimation of the empirical parameters (C, m, and e) of IDF relationship (Equation 6) was done using nonlinear regression analysis in Microsoft Excel. Goodness of fit between observed and estimated data was checked using R2 values. IDF curve for Khasab, Wadi Salmah, Saham, Dhabaah, Wadi Al-Jannah, Dank, Subayb, Ibra, Tahwa and Mughsayl stations presented in log scale are shown in Figure. 3 Also, the IDF curves are parallel to each other (Figure 3). Table 4 shows the estimated IDF parameter values, IDF equation with coefficient of determination achieved by IDF data analysis. The empirical parameter values for C ranged from 417.5 m to 8.95 m ranged from 0.645 to 0.196, and ranged from 0.79 to 0.391 for the studied stations. The obtained results showed good correlation between the observed and estimated rainfall intensities with high R2 ranging between 0.994 and 0.851 (Table 4). Therefore, the IDF curved generated at the stations could be further used in the rainfall anticipation and in design of water related projects in the Oman.

Figure 3: IDF curve for Khasab, Wadi Salmah, Saham, Dhabaah, Wadi Al-Jannah, Dank, Subayb, Ibra, Tahwa, and Mughsayl station.
| Governorate | Station name | IDF parameters | IDF formula |
Coefficient of determination (R2) | ||
|---|---|---|---|---|---|---|
| C | m | e | ||||
| Musandam | Ghamda | 73.3 | 0.435 | 0.641 |  |
0.914 |
| Khasab | 84.6 | 0.377 | 0.648 |  |
0.931 | |
| Rhaibah | 71.4 | 0.405 | 0.599 |  |
0.93 | |
| Sal Ala | 24 | 0.645 | 0.596 |  |
0.861 | |
| Sima | 33.6 | 0.58 | 0.614 |  |
0.87 | |
| Al-Buraimi | Al-Juwayf | 144.6 | 0.319 | 0.713 |  |
0.994 |
| Al-Ubaylah | 111.5 | 0.317 | 0.713 |  |
0.948 | |
| Fayyad | 168 | 0.279 | 0.685 | 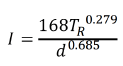 |
0.99 | |
| Khatwah | 27.8 | 0.39 | 0.575 | 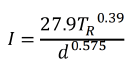 |
0.926 | |
| Mahdah | 65.4 | 0.403 | 0.627 | 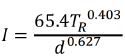 |
0.934 | |
| Wadi Salmah | 75.1 | 0.398 | 0.672 | 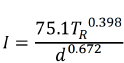 |
0.924 | |
| Wadi Sharm | 145.5 | 0.371 | 0.691 |  |
0.932 | |
| Al-Batinah North | Al-Ghuzayfah | 9 | 0.347 | 0.413 |  |
0.937 |
| Al-Jizzi | 130.6 | 0.444 | 0.746 |  |
0.915 | |
| Aqair Al-Abreein | 70.9 | 0.416 | 0.618 |  |
0.918 | |
| Aqbat Al-Risah | 166.1 | 0.325 | 0.734 |  |
0.946 | |
| Hayl Al-Najd | 229.8 | 0.313 | 0.74 |  |
0.851 | |
| Saham | 70.9 | 0.416 | 0.618 |  |
0.918 | |
| Al-Batinah South | Al-Miseen | 168.9 | 0.301 | 0.651 |  |
0.953 |
| Al-Wasit | 137.6 | 0.35 | 0.683 | 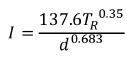 |
0.939 | |
| Ar-Rustaq | 129.5 | 0.36 | 0.664 | 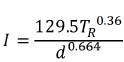 |
0.936 | |
| Barka | 90.1 | 0.566 | 0.742 | 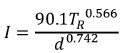 |
0.963 | |
| Dhabaah | 82.5 | 0.437 | 0.643 | 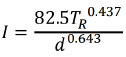 |
0.913 | |
| Salma | 176.4 | 0.311 | 0.652 |  |
0.949 | |
| Muscat | Buei | 157.8 | 0.324 | 0.577 |  |
0.957 |
| Hayfadh | 74.8 | 0.216 | 0.391 |  |
0.991 | |
| Mazara | 99 | 0.303 | 0.743 |  |
0.96 | |
| Muscat | 42.8 | 0.452 | 0.658 | 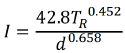 |
0.922 | |
| Ruwi | 167 | 0.307 | 0.644 | 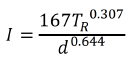 |
0.99 | |
| Wadi Al-Jannah | 58.3 | 0.412 | 0.726 | 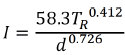 |
0.92 | |
| Wadi Al-Khawd | 109.2 | 0.453 | 0.568 | 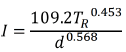 |
0.949 | |
| Adh-Dhahirah | Dakarah | 205.1 | 0.211 | 0.654 | 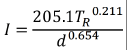 |
0.977 |
| Dank | 37.4 | 0.43 | 0.612 | 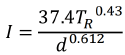 |
0.914 | |
| Dhahir | 170.9 | 0.266 | 0.703 | 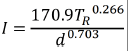 |
0.961 | |
| Kubarah | 175.2 | 0.373 | 0.775 | 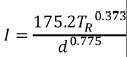 |
0.932 | |
| Majzi | 193.8 | 0.304 | 0.733 |  |
0.951 | |
| Qarn Al-Kabsa | 97.6 | 0.458 | 0.694 |  |
0.914 | |
| Tanam | 89.7 | 0.384 | 0.683 |  |
0.939 | |
| Ad-Dakhliyah | Al Qusaiba | 177 | 0.299 | 0.708 |  |
0.959 |
| Jiwar | 175.6 | 0.398 | 0.79 |  |
0.924 | |
| MOD | 309.4 | 0.196 | 0.681 |  |
0.98 | |
| Musbit | 381 | 0.248 | 0.653 |  |
0.973 | |
| Najd Al-Musallah | 251.6 | 0.332 | 0.753 |  |
0.99 | |
| Subayb | 417.5 | 0.249 | 0.654 | 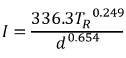 |
0.972 | |
| Tawi Zahir | 263.3 | 0.219 | 0.685 | 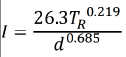 |
0.994 | |
| Ash Sharqiya North | Ad-Dariz | 180.1 | 0.211 | 0.606 | 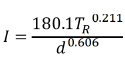 |
0.956 |
| Al-Mudaybi | 195.1 | 0.218 | 0.676 | 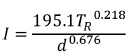 |
0.994 | |
| Al-Muqayhfah | 179.8 | 0.294 | 0.696 | 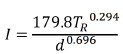 |
0.956 | |
| Haimah | 265.8 | 0.237 | 0.685 | 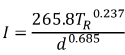 |
0.969 | |
| Ibra | 144.7 | 0.425 | 0.74 | 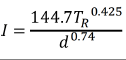 |
0.914 | |
| Masroon | 114.1 | 0.407 | 0.741 | 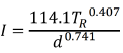 |
0.955 | |
| Wadi Bani Khalid | 279 | 0.238 | 0.67 | 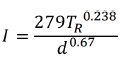 |
0.973 | |
| Al-Fujayj | 102.1 | 0.352 | 0.583 | 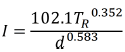 |
0.94 | |
| Ash-Sharqiya South | Fins | 168.1 | 0.245 | 0.631 | 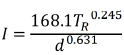 |
0.969 |
| Jaalan Bani | 45.9 | 0.242 | 0.569 | 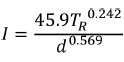 |
0.97 | |
| Jabal Bani Jabir | 105.1 | 0.397 | 0.58 |  |
0.924 | |
| Snaf | 148.6 | 0.214 | 0.547 | 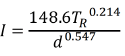 |
0.985 | |
| Tahwah | 94.9 | 0.345 | 0.576 | 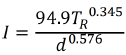 |
0.943 | |
| Dhofar | Aqarhanawt | 37.6 | 0.584 | 0.552 | 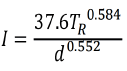 |
0.968 |
| Ghadow | 25.8 | 0.632 | 0.566 | 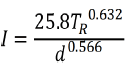 |
0.929 | |
| Hagayf | 71.4 | 0.405 | 0.548 | 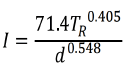 |
0.912 | |
| Mughsayl | 42.8 | 0.452 | 0.658 | 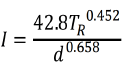 |
0.908 | |
| Sadh | 90.4 | 0.268 | 0.651 | 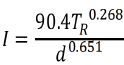 |
0.968 | |
| Sher | 114.1 | 0.407 | 0.645 | 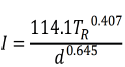 |
0.921 | |
| Zayk | 52.4 | 0.507 | 0.635 |  |
0.887 | |
Table 4: IDF parameter and equation with coefficient of determination for studied stations.
Empirical IDF parameter contours
The spatial distribution maps of the IDF parameters C, m, and e are shown in Figure 4. The contours show the smooth variation of parameter over the whole country. But, due to the absence of monitoring points in the Al-Wusta region, contour lines generated in the middle section of the based on the interpolation of data from the neighboring regions. Also, the data from adjacent countries Saudi Arabia and United Arab Emirates were included. Thus, the contour lines extending beyond the Oman’s border were based on the interpolation only.
All parameter values are relatively high and more condensed in the Northern part of the country compared to the Southern part. Particularly, the high values were observed along the Al-Hajar mountain range that runs parallel to the Al Batinah coast. Values of the parameters are lower at the flat areas than the ones in the higher altitude areas of Al Batinah region. Also, the values were observed declining steadily along the coastal plains. There is no literatures found on the generation of IDF curve and its parameters at the various stations covering the Oman. Therefore, the generated contour map could be used to estimate the empirical parameters; construct the IDF formula and curves and estimate the rainfall intensities for various rainfall duration and return periods at ungauged locations. Especially in the arid region where the rainfall is erratic and unpredictable with both space and time local IDF curves development would be valuable. Also, using new IDF curve concentrated in the actual study area rather than using one generalized regional IDF curve will provide appropriate rainfall data for flood, storm water, road-bridge design and other environmental studies.

Figure 4: Spatial distribution contour map of empirical IDF parameters (a) C, (b) m, and (c) e.
Conclusion
Intensity Duration Frequency (IDF) curves are utilized in the hydrologic and water engineering projects water resource projects in planning and designing of storm drainage, flood protection, bridges and culverts, water impounding facilities, and other water resources systems. In this study the development of IDF curves was done using Bernard’s equation. Gumbel distribution was used to obtain rainfall intensities for various durations and return periods. The historical rainfall data obtained from the Ministry of Regional Municipalities and Water Resources (MRMWR) at 65 gauging stations situated at different elevation and region throughout the Oman were used in the study. IDF curves and empirical formulas were derived for rainfall durations (5, 15, 30, 60, 360, 720, and 1440 minutes) for various return periods (2, 5, 10, 25, 50, and 100 years).
Rainfall analysis exhibited the average annual rainfall of 109.21 mm with a standard deviation of 92.82 mm, Skewness coefficient of 1.62 and Kurtosis coefficient of 3.08 for all the studied stations from 1977 to 2017. The study also shows that the rainfall in the mountainous region is high compared to the desert and the coastal region of the country. Also, IDF analysis indicated the higher intensity rainfall at various return period was witnessed at the higher elevation stations compared to the lower elevation station. IDF empirical parameters estimation using nonlinear regression provided the parameter values for C ranging from 417.5 m to 8.95 m ranging from 0.645 to 0.196, and ranging from 0.79 to 0.391 for the studied stations.
Finally, the contour maps of spatial distribution the IDF parameters were plotted for whole country. The parameter values were moderately high and more condensed in the Northern part of the country along the Al-Hajar mountain range compared to the southern part and along the flat terrain of the country. The created contour maps may be helpful in estimating the empirical parameters of the IDF formula and estimate the rainfall intensities for various rainfall duration and return periods at ungauged locations. The outcome of this study will be helpful in planning, designing and decision making of future water resources and urban drainage projects.
Acknowledgement
The authors would like to thank the ministry of agriculture, fisheries wealth and water resources, Sultanate of Oman for providing the data used in the present study.
Declaration of Interest
None.
References
- Ahmed Z, Rao D, Reddy K, Raj E (2012) Rainfall intensity variation for observed data and derived data a case study of Imphal. ARPN J Eng Appl Sci 11:1506-1513.
- Al-Amri NS, Subyan AM (2017) Generation of rainfall Intensity Duration Frequency (IDF) curves for ungauged sites in arid region. Earth Syst Environ 1.
- Al-Anazi KK, El-Sebaie IH (2013) Development of intensity duration frequency relationships for Abha city in Saudi Arabia. Int J Comput Eng Res 3:58-65.
- Al-Wagdany (2021) Construction of IDF curves based on NRCS synthetic rainfall hyetographs and daily rainfall records in arid regions. Arab J Geosci 14:527.
- Al Areeq A, Al Zahrani M, Chowdhury S (2021) Rainfall Intensity Duration Frequency (IDF) curves: Effects of uncertainty on flood protection and runoff quantification in southwestern Saudi Arabia. Arab J Sci Eng 46:10993-11007.
- Aldosari D, Almedeij J, Alsumaiei AA (2020) Update of intensity duration frequency curves for Kuwait due to extreme flash floods. Environ Ecol Stat 27:491–507.
- AlHassoun SA (2011) Developing an empirical formulae to estimate rainfall intensity in Riyadh region. J King Saud Univ Eng Sci 23:81-88.
- Awadallah A, ElGamal M, ElMostafa A, ElBadry H (2011) Developing intensity duration frequency curves in scarce data region: An approach using regional analysis and satellite data. Eng 3:215-226.
- Awadallah AG, Elsayed AY, Abdelbaky AM (2017) Development of design storm hyetographs in hyper-arid and arid regions: Case study of Sultanate of Oman. Arab J Geosci 10.
- Bell FC (1969) Generalized rainfallduration frequency relationships. J Hydraul Divi 95:311-327.
- Bernard M (1932) Formulas for rainfall intensities of long duration. Trans Am Soc Civ Eng 96:592-624.
- Bracken C, Holman KD, Rajagopalan B, Moradkhani H (2018) A bayesian hierarchical approach to multivariate nonstationary hydrologic frequency analysis. Water Resour Res 54:243-255.
- Chen C (1983) Rainfall intensity duration frequenc formulas. J Hydraul Eng 109:1603-1621.
- Cheng L, AghaKouchak A (2014) Nonstationary precipitation intensity duration frequency curves for infrastructure design in a changing climate. Sci Rep 4:1-6.
[Crossref] [Google Scholar] [PubMed]
- Cosgrove WJ, Loucks DP (2015) Water management: Current and future challenges and research directions. Water Resour Res 51:4823-4839.
- Elsebaie IH (2012) Developing rainfall intensity duration frequency relationship for two regions in Saudi Arabia. J King Saud Univ Eng Sci 24:131-140.
- Forestieri A, Arnone E, Blenkinsop S, Candela A, Fowler H, et al. (2018) The impact of climate change on extreme precipitation in Sicily, Italy. Hydrol Process 32:332-348.
- Gunawardhana LN, Al-Rawas GA (2016) A comparison of trends in extreme rainfall using 20 years data in three major cities in Oman. J Eng Res 13:137-148.