 Spanish
  Chinese
  Russian
  German
  French
  Japanese
  Portuguese
  Hindi
Hindi Special Issue Article, Geoinfor Geostat An Overview Vol: 0 Issue: 0
A WebGIS for Stray Dogs:Methodological and Practical Aspects
Mariella L, Palma M and Pellegrino D*
Università del Salento, Dipartimento di Scienze dell’Economia, Complesso Ecotekne, Via per Monteroni, Lecce 73100, Italy
*Corresponding Author: Pellegrino D
Università del Salento, Dipartimento di Scienze dell’Economia, Complesso Ecotekne, Via per Monteroni, Lecce 73100, Italy
Tel: +39 0832 298786
E-mail: daniela.pellegrino@unisalento.it
Received: May 28, 2019 Accepted: June 10, 2019 Published: June 17, 2019
Citation: Mariella L, Palma M, Pellegrino D (2019) A WebGIS for Stray Dogs: Methodological and Practical Aspects. Geoinfor Geostat: An Overview S2.
Abstract
The stray dogs represent a complex issue and the management of this phenomenon requires the use of a geographical information system, i.e. GIS and WebGIS, to support the policy makers in the definition of suitable control and prevention actions.
In particular, GIS and WebGIS are advanced information technologies for a) the implementation of spatial databases concerning different kind of data, b) the development of multiscale and multi-thematic representations of available information and c) the analysis of spatial information. Moreover, the WebGIS guarantees the simplicity of use, homogeneity and speed in updating geographic and alphanumeric data, as well as flexibility in database queries.
In this paper a WebGIS for stray dogs monitoring over the province of Lecce (Apulia Region) is proposed. This original WebGIS combines geographical information over the area under study, with the results obtained through a sample survey aimed at detecting roads and places where there are the main stray dogs-sightings.
Keywords: Free-roaming animals management, Geographic Information System, Statistical indicators, Spatial distribution
Introduction
In recent years, the control of stray dogs is an alarming problem for all European governments [1,2]. According to the World Health Organization (WHO), in 2017 there were more than 200 million of stray dogs all over the world. In Europe, there are no central statistics on this phenomenon and several countries have no control or data on the number of dogs without owner located in their territory. The European Society of Dog and Animal Welfare (ESDAW) estimates that in Europe, in 2016, there were over 100 million of stray dogs. In Italy, according to the last estimate, provided by the Health Ministry in 2012, there are 500,000-700,000 stray dogs.
Recently, this phenomenon has increased due to different reasons, that is: a) the easy access of stray dogs to food resources (waste) in places where these animals tend to settle down, such as restaurants, supermarkets or other gathering places [3]; b) the lack of control by public authorities responsible for stray dogs monitoring; c) the poor education of the dog owners that determines wrong practices, such as the abandonment, the lack of registration into the Canine Registry and sterilization of the animals.
There are several problems related to the presence of stray dogs on a territory concerning public health, animal husbandry and wildlife. In general, more attention is paid to ethical problems related to the dogs abandonment, the possibility of humans attacks, as well as health risks and several damages caused to economic activities [4-7]. In particular, the stray dogs population represents a potential public health and environmental risk since several viral and bacterial diseases could be transmitted to humans by these animals [8-17]. Nevertheless the stray dogs phenomenon is related to important human health effects, nowadays the problems concerning animal husbandry and wildlife remain underestimated [18].
Over the years, European countries have promoted multiple actions against the increase in stray dogs. However, according to the World Society for the Protection of Animals (WSPA) and the Royal Society for the Prevention of Cruelty to Animal (RSPCA), in Europe only 42% of countries have a specific law for the control of dogs, despite the 70% of European States prohibit the dogs abandonment In particular, WSPA and RSPCA do not include Italy among the virtuous countries in the control of stray dogs phenomenon, although in Italy several laws on animal welfare, abandonment and identification of dogs by microchip, have been formulated. Moreover, there are no published data about the size of stray dogs population. The lack of certainty around the number of stray dogs makes it difficult to implement appropriate risk management strategies to deal with their presence.
The spread of stray dogs could be solved only with a strategic policy at national level and with campaigns for sterilization aimed at containing the number of animals without owner. However, management, planning and decision making require readily accessible information on stray dogs, in order to know the scale of this phenomenon. Hence, in this context, monitoring activities are important and require the availability of homogeneous and reliable data, as well as the use of advanced Information Technologies (IT) in order to process and store a large amount of data.
For competent authorities and local governments a GIS could represent the most appropriate tool to manage this phenomenon, since it allows a joint analysis of geographic elements and alphanumeric data about stray dogs. Hence, by using a GIS it is possible to deal, in an integrated way, the available information, to plan stray dogs monitoring actions and prevention policies.
Moreover, in recent years, the widespread use of IT, as well as the development and implementation of GIS applications, accessible to different kind of users, have inspired the integration between Internet and GIS technology [19]. A GIS equipped with a web interface, known as WebGIS, allows the users to perform real time assessment of phenomena on the surface of Earth, since geographic and alphanumeric data management, statistical analysis, real time modeling as well as the web implementation of GIS functionality could be conducted by using a World Wide Web browser or other client program. Consequently, the role of GIS and WebGIS technologies in planning processes and developing socioe-conomic models for land management policies has been very important. Although, these tools are often used to visualize relationship and analyze trends in industries such as government, healthcare administration and emergency management [20], GIS and WebGIS could be also convenient to manage stray dogs phenomenon and represent cognitive tools to analyze the environment and define procedures for implementing services and land management strategies. Recently, several studies have used GIS applications to manage data related to animals: in [21] GIS was proposed to determine the influence of some environmental factors on the distribution of specific infections in stray cats; in [22] stray cats density in an urban area was mapped by using GIS; in [23] a GIS application has been implemented in order to assess the distribution of road accidents involving stray dogs.
In this paper, after a brief description of the stray dogs phenomenon in Italy and Apulia Region, in the northeastern Italy, the study area and the characteristics of the available data are discussed. Moreover, the steps for implementing a monitoring WebGIS, named “Stray Dogs WebGIS”, in a province of the Apulia Region are illustrated and an innovative web application for stray dogs management is presented. In particular, in the GIS and WebGIS applications a complex and structured computerized database able to acquire new data, integrate and correlate the available information, from different sources (sample surveys, ISTAT, municipalities), on the area under study, is used.
The stray dogs in Italy: Main empirical evidence
In Italy, the reception facilities play a primary role in stray dogs management. In particular, there are two different kind of these structures (National Law 281/1991 of Italy):
a) The “kennels”, with reception functions, directly controlled by the official veterinary service; in these structures stray dogs are microchipped, registered in the Canine Registry and, finally, they are subjected to health checks;
b) The “shelters” with temporary reception functions, waiting for dogs adoption.
According to the last data provided by the Italian Health Ministry, there were 1,070 kennels and shelters in Italy, in 2015, as shown in Table 1.
| Geographical area | Region | # Structures | |
|---|---|---|---|
| North | Emilia-Romagna | 60 | 312 |
| Friuli Venezia-Giulia | 15 | ||
| Liguria | 16 | ||
| Lombardy | 94 | ||
| Piedmont | 77 | ||
| Trentino-South-Tyrol | 17 | ||
| Aosta Valley | 2 | ||
| Veneto | 31 | ||
| Center | Lazio | 80 | 239 |
| Marche | 58 | ||
| Tuscany | 70 | ||
| Umbria | 31 | ||
| South | Abruzzo | 32 | 519 |
| Basilicata | 41 | ||
| Calabria | 38 | ||
| Campania | 114 | ||
| Molise | 7 | ||
| Apulia | 175 | ||
| Sardinia | 44 | ||
| Sicily | 68 | ||
| Total | - | - | 1,070 |
Table 1: Number of Italian kennels and shelters, in 2015, classified by region and geographical area (Source: Italian Health Ministry).
In particular, most of these structures are in the southern regions of Italy and in the islands (519), mainly in Apulia (175) and Campania (114). On the other hand, a lower number of authorized kennels was observed in the northern part of Italy (312), with a greater concentration in Lombardy (94), Piedmont (77) and Emilia- Romagna (60) regions. Finally, in the central part of Italy 239 kennels and shelters were registered, mainly in Lazio (80) and Tuscany (70) regions.
Nowadays, the authorities responsible for programming policies in the stray dogs management have many difficulties to quantify this phenomenon. Neverthless, a precise datum about the intensity of the phenomenon could allow a planning of effective and efficient strategies.
Indeed, official data only concern the inputs of dogs in Italian kennels and shelters. Annual data over the five year span from 2011 to 2015, classified by region and geographical area are shown in Table 2: The highest value was recorded in 2012 (104,142), mainly in Lombardy (16,629) and Campania (10,731) regions. This number has decreased to 97,859 in 2014.
| Geographical area | Region | 2011 | 2012 | 2013 | 2014 | 2015 |
|---|---|---|---|---|---|---|
| North | Emilia Romagna | 10,677 | 7,132 | 10,136 | 9,695 | 9,951 |
| Friuli Venezia-Giulia | 1,981 | 2,523 | 2,380 | 1,977 | 1,542 | |
| Liguria | 2,230 | 823 | 1,742 | 970 | 1,078 | |
| Lombardy | 13,082 | 16,629 | 12,809 | 12,802 | 12,528 | |
| Piedmont | 8,775 | 8,006 | 7,964 | 9,402 | 9,050 | |
| Trentino-South-Tyrol | 1,134 | 1,128 | 330 | 1,147 | 1,024 | |
| Aosta Vallet | 378 | 397 | 339 | 311 | 271 | |
| Veneto | 9,673 | 8,930 | 1,582 | 8,576 | 8,576 | |
| Center | Lazio | 7,465 | 6,951 | 6,931 | 7,554 | 7,627 |
| Marche | 2,090 | 1,769 | 1,676 | 889 | 1,233 | |
| Tuscany | 7,268 | 7,891 | 8,037 | 8,542 | 7,749 | |
| Umbria | 1,915 | 1,958 | 2,728 | 1,982 | 1,731 | |
| South | Abruzzo | 3,070 | 1,984 | 3,345 | 4,601 | 4,624 |
| Basilicata | 1,911 | 1,703 | 1,836 | 1,784 | 1,750 | |
| Calabria | 4,103 | 4,636 | 4,871 | 3,637 | 2,174 | |
| Campania | 10,884 | 10,731 | 10,146 | 3,807 | 10,283 | |
| Molise | 673 | 687 | 683 | 714 | 631 | |
| Apulia | 4,184 | 9,428 | 10,076 | 9,615 | 9,073 | |
| Sardinia | 3,241 | 3,367 | 3,093 | 4,207 | 3,228 | |
| Sicily | 7,631 | 7,469 | 9,676 | 5,647 | 6,071 | |
| Total | - | 1,02,365 | 1,04,142 | 1,00,380 | 97,859 | 1,00,194 |
Table 2: Number of the inputs of dogs in Italian kennels and shelters, in the period 2011-2015, classified by region and geographical area (Source: Italian health ministry).
Moreover, Figure 1 shows the temporal evolution of the number of inputs of stray dogs in Italian kennels and shelters, classified by geographical area. In Italy, despite a decrease from 2013 to 2014, the number of dogs has increased in 2015 up to level still lower than the value in 2011. A relative variation equal to -3.61% was reported in 2013 with respect to 2012, followed by-2.51% in 2014 with respect to 2013, and a positive relative variation equal to 2.39% in 2015 (see the data reported in Figure 1).

Figure 1: Temporal evolution of the inputs of dogs in Italian kennels and shelters, in the period 2011- 2015, classified by geographical area (Source: Italian Health Ministry).
The national evolution is confirmed even at a more disaggregated territorial level. Indeed in Figure 1 the temporal evolution of the number of inputs of stray dogs classified for north, center and south Italy is shown. In the analyzed period, the central part of Italy has registered lower number of dogs (with respect to the rest of the Italian territory), followed by the southern and northern parts: positive relative variations of 4.32% and 9.30% were reported in 2013 for the central and the southern parts, respectively, followed by negative relative variations in 2014. Instead, for the northern sub area, there is a light decreasing tendency with a negative peak in 2013.
Hence, in 2015, a positive relative variation was observed in Southern Italy. In particular, in Figure 2 the spatial profiles of the Incidence Rate of Stray Dogs (IRSD), from 2011 to 2015 for the Italian regions, are illustrated. Note that the IRSD could be considered as a measure of the penetration of stray dogs phenomenon, per 100,000 inhabitants, over the national territory and it is equal to the ratio between the total number of inputs of stray dogs in the Italian kennels and shelters and the residential population of each region.

Figure 2: Spatial distribution of IRSD indicator in Italy, in the period 2011-2015.
Higher values can be found in the north-western and in the southern part of Italy. In particular, the density of dogs, per 100,000 inhabitants, is lower in Lombardy, Friuli Venezia Giulia, Calabria and Sicily regions.
The stray dogs in Apulia Region
In Apulia Region, except for Foggia province, the annual number of the inputs of dogs into kennels and shelters has registered a decreasing trend, in the period 2011-2015, as shown in Table 3, on the basis of the data provided by the Experimental Zooprophylactic Institute of Apulia and Basilicata (EZI).
| Province | 2011 | 2012 | 2013 | 2014 | 2015 |
|---|---|---|---|---|---|
| Bari | 2,213 | 1,420 | 1,958 | 1,943 | 1,724 |
| Barletta-Andria-Trani | 746 | 622 | 506 | 321 | 273 |
| Brindisi | 1,116 | 1,098 | 759 | 322 | 155 |
| Foggia | 885 | 951 | 857 | 1,792 | 1,312 |
| Lecce | 1,713 | 1,126 | 1,408 | 1,578 | 800 |
| Taranto | 1,497 | 536 | 701 | 382 | 530 |
| Total | 8,170 | 5,753 | 6,189 | 6,338 | 4,794 |
Table 3: Number of the inputs of dogs in Apulian kennels and shelters, in the period 2011-2015, classified by province (Source: EZI).
In the period from 2011 to 2015, the highest values of the inputs of stray dogs have been registered in 2011 (8,170), mainly in Bari (2,213) and Lecce (1,713) provinces. On the other hand, lower values can be found in 2015: 4,794 inputs in the regional structures. Moreover, the analysis of the time plots in Figure 3 highlights that, in the period 2011-2015, Barletta-Andria-Trani (BAT) and Brindisi provinces have shown a constant decay: negative relative variations were observed in all the analyzed years (see the data reported in Figure 3).

Figure 3: Temporal evolution of the inputs of dogs in Apulian kennels and shelters, in the period 2011- 2015, classified by province (Source: EZI).
In particular, relative variations of -51.86%, -49.30% and -14.95% were computed in 2015, with respect to 2014, for Brindisi, Lecce and BAT provinces, respectively. For the other Apulian provinces, in the period 2011-2015, the temporal evolution of the number of inputs dogs was characterized by increases and decreases, but it is worth noting that only the province of Foggia recorded a relative increment in 2015 with respect to 2011 (48.25%).
Figure 4 shows the spatial profiles of the IRSD for the Apulian provinces from 2011 to 2015. Higher values of IRSD can be found in the southern part of the Apulia Region until 2013, while, recently, the density of dogs, per 100,000 inhabitants, has exhibited higher values for the northern part of the region (2011-2015).

Figure 4: Spatial distribution of IRSD indicator in Apulia Region, in the period 2011-2015.
The study area
The study area is located in the southern part of Italy (Lecce province, in the Apulia Region). The province of Lecce has been divided into five sub areas, as illustrated in the Figure 5, (Area 1 “Northeastern Coast”, Area 2 “Northwestern Coast”, Area 3 “Central Area”, Area 4 “Southwestern Coast”, Area 5 “Southeastern coast”), in order to analyze the evolution of the stray dogs phenomenon in geographically close municipalities. It is important to underline that each Area has been identified by considering the main provincial arterial roads, such as SS101 “Lecce-Gallipoli”, SS274 “Southern Salento Gallipoli-Leuca”, SS16 “Lecce-Maglie”, SS275 “Maglie-Leuca”, as well as the location of the urban centres of each municipality with respect to the road network. In fact, it is well known that stray dogs usually roam over a territory without crossing the great arterial roads such as, for example, the state and provincial roads.

Figure 5: Municipalities of Lecce province and sub-areas.
Materials and Methods
Data description
The Stray Dogs WebGIS requires different kinds of input data, to be managed by a shared Desktop-GIS and Web-GIS environment.
In particular, in order to implement a WebGIS application for the phenomenon under study, spatial and alphanumeric data have been integrated into a Desktop-GIS environment. The spatial data represented by vector models (Figure 6), in a shapefile format, are:

Figure 6: Vector data included in the GIS for the stray dogs phenomenon: (a) 5 sub-areas boundaries (b) Municipalities administrative boundaries (c) Urban centres administrative boundaries (d) Seaside places administrative boundaries (e) Road network (f) Sighting road network (g) Sighting places.
1. Polygonal data, which are the boundaries of the 5 sub-areas under study, the administrative boundaries of the municipalities of Lecce province, the urban centres and the seaside places of Lecce province;
2. Linear data, which are road network, including state, provincial and municipal roads, as well as stray dogs sighting roads, where dogs have been sighted;
3. Point data, which are the main sighting places of stray dogs.
Furthermore, the alphanumeric information is represented by:
- Socio-demographic data of the municipalities of Lecce province;
- Type and location of sighting places;
- Statistical indicators developed for the stray dogs monitoring.
Note that, alphanumeric information has been obtained by a survey conducted on a sample of 2,259 students aged between 14 and 16 years in 37 schools of Lecce province. In particular, the submitted questionnaire has allowed obtaining information concerning the main stray dogs sighting roads and places.
The databases implemented for the stray dogs phenomenon, with the description of the source data and the databases fields are illustrated in Table 4.
| Database | Source | Fields | Description |
|---|---|---|---|
| Sighting places | ISTAT | CodComune | ID code of municipality |
| Comune | Municipality name | ||
| Sample survey | codArea | ID code of the sub-area | |
| Tipluogo | Type of the place (church, place,..) | ||
| Indirizzo | Address description | ||
| NEIR | Negative effects incidence rate | ||
| NDR | Non-discomfort rate | ||
| IRSP1 | IRSP1: Rummage through garbage | ||
| IRSP2 | IRSP2: Attack/chase passers | ||
| IRSP3 | IRSP3: Chase cars | ||
| IRSP4 | IRSP4: Bark | ||
| Sighting roads | ISTAT | CodComune | ID code of municipality |
| Comune | Municipality name | ||
| osmProco | Alphanumeric code | ||
| Sample survey | codArea | ID code of the sub-area | |
| NEIR | Negative effects incidence rate | ||
| NDR | Non-Discomfort rate | ||
| IRSP1 | IRSP1: Rummage through garbage | ||
| IRSP2 | IRSP2: Attack/chase passers | ||
| TIDS3 | IRSP3: Chase cars | ||
| IRSP4 | IRSP4: Bark | ||
| Seaside places | ISTAT | CodComune | ID code of municipality |
| Comune | Municipality name | ||
| sez2011 | Section code | ||
| codloc | Place code | ||
| Sample survey | codArea | ID code of the sub-area | |
| NEIR | Negative effects incidence rate | ||
| NDR | Non-discomfort rate | ||
| IRSP1 | IRSP1: Rummage through garbage | ||
| IRSP2 | IRSP2: Attack/chase passers | ||
| IRSP3 | IRSP3: Chase cars | ||
| IRSP4 | IRSP4: Bark |
Table 4: Database tables integrated into the GIS for the stray dogs phenomenon.
Statistical indicators for stray dogs phenomenon
Starting from the sample data collected during the survey on young people, some important indicators, defined to assess the phenomenon of stray dogs, are described hereafter. Assigned a spatial domain D, characterized by N geographic entities, uα,α =1,...,N, it is possible to define:
1. The “Negative Effects Incidence Rate”, NEIR(uα), as a measure of the impact and penetration of the negative social-health effects, associated with the presence of stray dogs on the territory. In particular, for each spatial location, this index measures the proportion of the negative effects d(uα) and is equal to the ratio between the total number of negative effects perceived by the respondents and the total number of responses n(uα), that is:
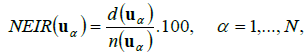 (1)
(1)
2. The “Non Discomfort Rate”, NDR(uα), as a measure of the percentage of respondents who believe that, in each geographic entity, stray dogs are not an issue. This rate is obtained from the ratio of the total of the respondents who declare that the stray dogs do not cause any discomfort r(uα) and the total number of the respondents s(uα), namely:
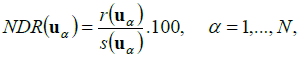 (2)
(2)
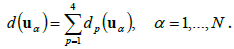
3. The “Incidence Rate of Specific Distress”, IRSPp(uα), as a measure of the impact and penetration on the territory, of the pth discomfort due to the presence of stray dogs. In particular, for each discomfort p, this index allows to identify the geographic entity in which the same discomfort is perceived; the index is obtained from the ratio between the number of times the pth discomfort is felt, dp(uα), and the total of the answers n(uα), i.e.:
 (3)
(3)
Note that, the IRSPp(uα) is calculated with reference to the following discomforts:
- “Rummage through garbage”, if p=1;
- “Attack/chase passers”, if p=2;
- “Chase cars”, if p=3;
- “Bark”, if p=4.
Note that for each geographic entity uα, it results
It is important to highlight that the geographic entity is represented, at the macro level, by the single Area (Northeastern Coast, Northwestern Coast, Central Area, Southwestern Coast, Southeastern Coast) or by each municipality of the province of Lecce; while at the micro level the geographic entity is represented by the place in which the interviewees have seen stray dogs.
Note that geographic entity corresponding to an area is identified by the centroid of the polygon, which describes the shape of this entity.
Methodology
The available data on stray dogs phenomenon are processed in order to implement the Stray Dogs WebGIS. Note that the application proposed in this paper is developed by using ArcGIS software.
Figure 7 shows the inputs required, the processes implemented and the outputs. In particular, inputs data, that is the tables holding feature classes, alphanumeric and geographic information represented by shapefiles (i.e. geospatial vector data format which can spatially describe vector features, such as polygon, line or point, with defined shape and geometric location) are stored in a geodatabase. Hence, the sampling information concerning environmental, social and hygiene discomforts, deriving from the presence of stray dogs is stored in the application.

Figure 7: Flow chart of the Stray Dogs WebGIS tool functionalities and main engines: database, Desktop GIS, and WebGIS modules.
As shown in Figure 7, the Stray Dogs WebGIS application converges in a dual GIS environment (Desktop GIS and WebGIS) with the goal of: (i) managing all required information to perform the analyses; (ii) visualizing and monitoring results in this regard.
The main functionality of the Desktop GIS environment is to support stray dogs management from a quantitative point of view. Specifically, it allows to perform the following different processes: (i) compute the stray dogs indicators; (ii) detecting areas characterized by high risk associated with the stray dogs; (iii) access, manage and updating the spatial database. In particular, the implemented Desktop GIS enables effective spatial intersections between several layers as well as different calculation operations, by using all the available geoprocessing tools in ArcGIS.
Finally, the information produced by the Desktop GIS module, stored in the geodatabase, is used to implement the WebGIS environment. It supports stray dogs management by the real time visualization of all geospatial information and the monitoring of the high risk sub-areas and places. The WebGIS is implemented through Open Geospatial Consortium (OGC) services and open source software for the publication of georeferenced data on internet, that is P. Mapper software, a framework based on MapServer and PHP/ MapScript. It is important to point out that the OGC services used in the application are the Web Map Service (WMS), which provides georeferenced map images over the Internet, and the Web Feature Service (WFS), which allows creating, modifying and exchanging vector format geographic information on the Internet.
In particular, as shown in Figure 7, the WebGIS environment allows: (i) visualizing all geospatial information; (ii) monitoring of the stray dogs; (iii) generating reports, maps and support materials.
Results and Discussion
As previously pointed out, this paper has proposed an application for stray dogs management composed of a Desktop GIS and a WebGIS application. The analysis of the statistical indicators implemented in the GIS environment has allowed the assessment of the phenomenon in the province of Lecce and the identification of the main issues caused by the stray dogs presence in some areas of the province.
In particular, the analysis of the spatial distribution of the NDR and IRSP indicators has been conducted.
Note that, in order to assure the reliability of the above mentioned indicators, only municipalities in which at least 15 interviewees have seen stray dogs, have been considered. The joint analysis of these indicators has enabled to identify
- “Risk areas”, i.e. the geographical areas where the stray dogs issue is more perceived (lower NDR values) and characterized by high impact of the negative effects related to the stray dogs movement (higher IRSP values);
- “Virtuous areas”, i.e. the geographical areas where the residents do not consider the stray dogs movement as an issue (higher NDR values) and do not highlight any relevant worry related to this phenomenon (lower NDR values).
It is important to point out that, for each indicator, classes of values have been defined by considering the percentiles of each distribution. As illustrated in Figure 8, the southeastern coast and the northwestern coast are the “virtuous areas”, where, despite the residents have seen some stray dogs, this phenomenon is not considered as an issue (higher values of NDR) and there are no significant negative effects related to the movement of these animals (lower values of IRSP).

Figure 8: Spatial distribution of: (a) NDR e (b) IRSP indicator, in the municipalities of the province of Lecce, “risk area” and “virtuous areas”.
Social and environmental problems related to the stray dogs phenomenon have been analyzed by considering the following discomforts:
1. “Rummage through gargabe”;
2. “Attack/chase passers”;
3. “Chase cars”;
4. “Bark”.
Therefore, for each IRSP (p=1, ..., 4), classes of values based on the percentiles of the distribution, have been defined and the geographical areas where each discomfort occurs with high frequency (“risk areas”), have been identified.
The study of the spatial distribution of these indicators (Figures 9 and 10) highlights that in the southwestern coast, previously defined as “risk area”, the most frequent discomforts are “attack/ chase passers” (highest value of IRSP2), “chase cars” (highest value of IRSP3). Moreover, in this area, stray dogs attack/chase citizens mainly near bars/restaurants and petrol stations; while they chase the cars near supermarkets, stations and schools.

Figure 9: Spatial distribution of IRSPp p=1, .., 4 indicator, for the discomfort: (a) “Rummage through” (p=1) and (b) “Attack/chase passers” (p=2), in the municipalities of the province of Lecce and “risk areas”.

Figure 10: Spatial distribution of IRSPp p=1, .., 4 indicator, for the discomfort: (a) “Chase cars” (p=3) and (b) “Bark” (p=4), in the municipalities of the province of Lecce and “risk areas”.
The results obtained in the GIS environment are successively implemented in the WebGIS module. The home page of the Stray Dogs WebGIS is shown in Figure 11. It is divided into 4 main sections: 1) special reports, 2) main map and navigation bar, 3) interactive legend, 4) reference image.

Figure 11: Home page of the Stray Dogs WebGIS.
Note that through the “special reports” section the users can get information about legislation and monitoring techniques adopted at the European, national and regional level, in order to contain this phenomenon. Moreover, there are links to visualize the main features of the integrated GIS module.
The “navigation bar” (on the right side of the main map) includes several functionalities.
Moreover, the “interactive legend” (on the right side of the home page) allows activating and deactivating the several GIS layers and is divided into 5 sections: 1) Administrative data, 2) 5 Sub-areas, 3) Road network, 4) Stray dogs monitoring and 5) Load WMS.
In the “Administrative data” section, it is possible to use the overlay function (by activating the layers) and simultaneously display the administrative boundaries, urban centres and seaside places of the province of Lecce.
In addition, using the identify command in the navigation bar, it is possible to visualize the alphanumeric information associated with these layers, for example by activating the administrative boundaries of the municipalities, socio-demographic information of each municipality is visualized (Figure 12).

Figure 12: Thematic map of the administrative boundaries of the municipalities of the province of Lecce.
In the “Stray dogs monitoring” section the user could consult the data on stray dogs phenomenon, such as the sighting places. In particular, the search for tool enables to query the vector data implemented in the system, to search for high risk locations and to visualize (in a table and in a thematic map) all the sites where these animals have been sighted. Finally, all the information associated to each selected place/road could be displayed (Figure 13). The results obtained by this query could be integrated by overlaying an orthophoto of the reference area. In this case, it is necessary to integrate the WMS of the National Geoportal into the WebGIS. On the other hand, the graph of the road network of the municipalities of the province of Lecce could be integrated by the WFS of the National Geoportal.

Figure 13: Example of search for function, overlay of orthophoto, administrative boundaries of the municipality of Lecce and sighting places.
Moreover, if multiple search criteria are combined, the search for function also allows using Boolean operators (and, or and not). Figure 14 shows the use of the search for tool to identify and display the sighting places of the municipality of Lecce and classified as “square” category. This result is useful for administrators in order to identify immediately the main places, within a municipality of the province of Lecce, where stray dogs are more frequently sighted.

Figure 14: Example of search for function and boolean operators.
It is worth noting that the search for function, implemented in the MapServer, allows a dynamic query of the geographic and alphanumeric information stored in the geodatabase that users intend to display over the map. Finally, note that the selected geographical information could be saved in different formats (*.csv, *.pdf, *shp).
Conclusion
In this paper, the Stray Dogs WebGIS implemented for stray dogs management is presented. In particular, the convenience and usefulness of GIS and WebGIS application for the policy makers are illustrated.
The proposed application combines the statistical indicators (alphanumeric data) defined in order to quantify the stray dogs phenomenon, with geographic information (vector data) concerning the province of Lecce.
Hence, this tool is a very important instrument to define suitable management and prevention policies for stray dogs. In particular, the Stray Dogs WebGIS could represent a strategic tool for policy makers in order to identify the risk areas, where specific intervention should be planned to limit the negative effects of the stray dogs movement.
References
- Butcher R (1999) Stray dogs: A worldwide problem, J Small Anim Pract 40: 458-459.
- Voslárová E, Passantino A (2012) Stray dog and cat laws and enforcement in Czech Republic and in Italy. Ann 1st Super Sanita, 48: 97-104.
- Ortega-Pacheco A, Rodriguez-Buenfil JC, Bolio-Gonzalez ME, Sauri-Arceo CH, Jiménez-Coello M, et al. (2007) A survey of dog populations in urban and rural areas of Yucatan, Mexico, Anthrozoos 20: 261-274.
- Hubbert WT McCulloch WF, Schnurrenberger PR (1975) Diseases transmitted from animals to man. Thomas Pub, Springfield.
- Matter HC, Daniels TJ (2000) Dogs, zoonoses, and public health. In: Macpherson CNL, Meslin FX, Wandeler AI (eds.) Dog ecology and population biology. CABI Publishing, New York, pp: 17-62.
- Stafford K (2007) The welfare of dogs. Springer, Dordrecht.
- Slater MR, Di Nardo A, Pediconi O, Villa PD, Candeloro L, et al. (2008) Freeroaming dogs and cats in central Italy: Public perceptions of the problem. Prev Vet Med 84: 27-47.
- Beck AM (1973) The ecology of stray dogs: A study of free ranging urban animals. York Press, Baltimore.
- Rubin HD, Beck AM (1982) Ecological behavior of free-ranging urban pet dogs, Appl Anim Ethol 8: 161-168.
- Daniels TJ, Bekoff M (1989) Population and social biology of free-ranging dogs, Canis familiaris. J Mammalogy 70: 754-762.
- Kato M, Yamamoto H, Inukai Y, Kira S (2003) Survey of the stray dog population and the health education program on the prevention of dog bites and dog acquired infections: A comparative study in Nepal and Okayama Prefecture, Japan. Acta med Okayama 57: 261-266.
- Morgan M, Palmer J (2007) Dog bites. BMJ 334: 413-417.
- De Keuster T, Butcher R (2008) Preventing dog bites: Risk factors in different cultural settings. Vet J 177: 155-156.
- Georges K, Adesiyun A (2008) An investigation into the prevalence of dog bites to primary school children in Trinidad. BMC Public Health 5: 85.
- Rinzin K, Stevenson M, Probert D, Bird R, Jackson R, et al. (2008) Free-roaming and surrendered dogs and cats submitted to a humane shelter in Wellington, New Zealand, 1999-2006. NZ Vet J 56: 297-303.
- Dalla Villa P, Kahn S, Stuardo L, Iannetti L, Di Nardo A, et al. (2010) Free-roaming dog control among OIE-member countries. Prev Vet Med 97: 58-63.
- Liberato C, Berrilli F, Odorizi L, Scarcella R, Barni M, et al. (2018) Parasites in stray dogs from Italy: prevalence, risk factors and management concerns. Acta Parasitol 63: 27-32.
- Beran GW, Frith M (1988) Domestic animal rabies control: An overview. Rev Infect Dis 10: 672-677.
- Dragicevic S (2004) The potential of web-based GIS. J Geograph Syst 6: 79-81.
- ESRI (2012) Community analyst: Reports reference guide ESRI. ArcGIS.
- Simking P, Wongnakphet S, Stich RW, Jittapalapong S (2010) Detection of Babesia vogeli in stray cats of metropolitan Bangkok, Thailand. Vet Parasitol 173: 70-75.
- Aguilar GD, Farnworth MJ (2012) Stray cats in Auckland, New Zealand: Discovering geographic information for exploratory spatial analysis. Appl Geogr 34: 230-238.
- Mennonna G, Murino C, Micieli F, Costagliola A, D'Angelo D, et al. (2018) Geographical information system analysis on road accidents involving wandering dogs in the urban area of Naples. Geospat Health 13: 628.

