 Spanish
  Chinese
  Russian
  German
  French
  Japanese
  Portuguese
  Hindi
Hindi Research Article, Geoinfor Geostat An Overview S Vol: 0 Issue: 0
An Improved Method for Estimating the Percentage Impervious Surface Area from MODIS and DMSP-OLS Night time Light Data
Matsushita B1*, Pok S2, Jiang D2 and Hamzah R2
1Faculty of Life and Environmental Sciences, University of Tsukuba, Tsukuba, Japan
2Graduate School of Life and Environmental Sciences, University of Tsukuba, Tsukuba, Japan
*Corresponding Author : Matsushita B
Faculty of Life and Environmental Sciences, University of Tsukuba, Tsukuba, Japan
Tel: +81-29-853-7190
E-mail: matsushita.bunkei.gn@u.tsukuba.ac.jp
Received: June 28, 2018 Accepted: July 24, 2018 Published: July 31, 2018
Citation: Matsushita B, Pok S, Jiang D, Hamzah R (2018) An Improved Method for Estimating the Percentage Impervious Surface Area from MODIS and DMSP-OLS Night time Light Data. Geoinfor Geostat: An Overview S3. doi: 10.4172/2327-4581.S3-003
Abstract
The percentage of impervious surface area (ISA%) in a watershed has been suggested to be an important indicator for evaluating watershed health since the 1990s. Thus, an accurate and frequently updated ISA% map is needed by decision-makers and environmental managers. Recently, Pok developed an easily implemented method (hereafter referred to as the Pok17 method) for estimating ISA% from a moderate resolution imaging spectroradiometer (MODIS) time-series and the Defense Meteorological Satellite Program’s Operational Line-scan System (DMSP-OLS) nighttime light (NTL) data. However, it was found that the Pok17 method systematically overestimated ISA % values in rural areas (i.e., pixels with lower ISA% values). In this study, we improved the original Pok17 method to mitigate these overestimations. Firstly, we analyzed the cause of the overestimation in the Pok17 method and found that it was because a large uncertainty existed in the enhanced vegetation index-adjusted NTL index (EANTLI) values of rural areas, which are used as inputs for ISA% estimations in the Pok17 method. In this study, we proposed to use original NTL data instead of EANTLI values in rural areas. For urban and suburban areas, the EANTLI data were still used to correct the saturation problem and blooming effects in the original NTL data. The results showed that the improved Pok17 method outperformed the original one with a root mean square error (RMSE) of 10.3%, a system error (SE) of 4.3%, and a determination coefficient of 0.88. A remarkable improvement was found in pixels with ISA% values less than 20%, with the RMSE reduced from 9.7% to 8.1% and the SE reduced from 6.1% to 3.3%. This improvement is significant for evaluating watershe health because the ISA% value of the watershed is obtained by accumulating the ISA % value of each pixel, and pixels with lower ISA% values usually account for most of the area in the watershed.
Keywords: Impervious surface area; Temporal mixture analysis; Hybrid method; Watershed evaluation; Remote sensing
Introduction
With the continuous growth of the world’s population and economy, the Earth’s surface is increasingly paved with impervious surface area (ISA, e.g., rooftops, sidewalks, road, parking lots and other man-made surfaces) due to the increased demand for infrastructure to support human life [1]. Since the 1970s, researchers have recognized that the appearance of new ISA in a watershed can alter the functioning of the watershed [2]. In the 1990s, researchers suggested that the ISA percentage (ISA%) of a watershed be used to evaluate the watershed’s health [3,4]. They classified watersheds into four categories based on ISA% values: natural (ISA% less than 1%), stressed (between 1%-10%), impacted (between 11%-25%), and damaged (larger than 25%). To perform this evaluation, an accurate and frequently updated ISA% map is necessary.
Since the 2000s, satellite data have been widely used to generate ISA% maps [5]. Satellite imagery with medium spatial resolution (e.g., Landsat) is usually used to generate ISA% maps on a city or watershed scale based on spectral mixture analysis (SMA) [6-9]. In contrast, satellite imagery with coarse spatial resolution (e.g., MODIS) is often used to generate ISA% maps at a national or continent scale based on Temporal Mixture Analysis (TMA) [10-13]. A substantial difference between SMA and TMA is that the latter uses temporal information instead of spectral information in the mixture analysis procedure [11]. Compared to SMA, TMA has three advantages: (1) the use of temporal information can reduce variability within end members and thus can improve the accuracy of ISA% estimation [11]; (2) the use of temporal information can also distinguish cropland from forest according to their different growth patterns [14]; (3) TMA is more suitable for satellite data with coarse spatial resolution, and thus it makes it easier to generate an ISA% map on a large scale (e.g., a national, continental, or even global scale) [12]. However, a weakness of TMA is that it cannot easily distinguish between impervious surface and bare soil when they are mixed; TMA has thus resulted in a large overestimation of ISA% values when applied to areas with both land cover types [15].
To solve the above problem, Pok et al. [15] proposed to incorporate the Defense Meteorological Satellite Program’s Operational Linescan System (DMSP-OLS) nighttime light (NTL) data with moderate resolution imaging spectro radiometer (MODIS) normalized difference vegetation index (NDVI) time-series to improve ISA estimation accuracy (denote as Pok17 method hereafter). The Pok17 method adopted the enhanced vegetation index (EVI)-adjusted NTL index (EANTLI) [16], which can mitigate not only the saturation problem in urban centers but also blooming effects in suburban areas, in order to separate ISA from bare soil. In the Pok17 method, two relationships between ISA% and EANTLI were obtained based on a statistical analysis of data from two satellites throughout the study area to estimate ISA% values from the EANTLI values pixel by pixel. Although the ISA % estimation accuracy was largely improved compared to the original TMA method, overestimations were still found, especially in rural areas (i.e., pixels with an ISA% less than 40%) [15]. On the other hand, it was found that rural areas usually account for a large proportion of a watershed while urban and suburban areas account for a small proportion. Therefore, it can be considered that the overestimations of ISA% in rural area pixels will cause a larger overestimation of total ISA% in a watershed and thus lead to a misevaluation of the watershed health.
Consequently, the objectives of this study are: (1) to analyze the reasons for the overestimations of ISA% in rural area pixels in the original Pok17 method; (2) to improve the Pok17 method by reducing the overestimations of ISA% in rural area pixels; and (3) to show how the improved Pok17 method advanced in accurately estimate the ISA%, especially in rural areas.
Study Area and Datasets
The same study area and datasets used in Pok17 method were adopted in this study to make it convenient to compare the performance between the improved and original methods. Figure 1 shows the study area, which includes Thailand, Laos, Cambodia, Vietnam, a part of Myanmar, and a small part of China. It has a total area of 2,877,306 Sqkms, with land area accounting for 59% of the total. Six MODIS tiles were needed to cover the study area. The main land cover types in the study area are paddy fields, mixed forests, and land cultivated for cash crops [17]. In addition, according to the World Bank data, the total population of the four main countries in the study area (i.e.,Thailand, Laos, Cambodia, and Vietnam) was 135.8 million in 1990, and the number reached to 184 million in 2016 with an increase of almost 36%. The total Gross Domestic Product (GDP) of the four countries had increased by 290% over a 16 y period from 2000 to 2016. The fast growths of population and GDP have unavoidably caused rapid urbanization. The expansion of urban area can lead to an increase in ISA, which consequently threatens or alters the watershed conditions in the region.

Figure 1: Location of the study area and the six MODIS tiles used in this study.
Table 1 summarizes the datasets used in this study. MODIS 16- day composited NDVI time series (MOD13A2) were used to generate a non-vegetation fraction map by the TMA method. The MODIS monthly composited EVI datasets (MOD13A3) were used first to obtain yearly EVI and then to generate an EANTLI map by combining the yearly EVI data with DMSP-OLS NTL data. The MODIS Land Water Mask (MOD44W) was used to remove water pixels before the ISA% estimation was performed. All MODIS products were downloaded from the USGS. The global DMSP-OLS NTL stable light product (from satellite F15) was used not only to generate the EANTLI map, but also to directly estimate ISA% in rural areas. This product can be downloaded from the NOAA website. Google Earth images from 2001-2004 were used to generate the references ISA% for evaluating the method’s performance. The details can be found in Pok et al. [15].
| Number | Dataset | Year | Spatial Resolution | Use |
|---|---|---|---|---|
| 1 | MOD13A2 (16-day Composited NDVI) | 2001 | 1 km | Etimating Non-Vegetation Fraction |
| 2 | MOD13A3 (monthly composited EVI) | 2001 | 1 km | Calculating EANTLI |
| 3 | MOD44W (land Water Mask) | 2001 | 250 m | Removing Water Pixels |
| 4 | DMSP-OLS NTL (stable light product, Ver. 4) | 2001 | 1 km | Calculating EANTLI Estimating ISA% In Rural Areas |
| 5 | Google Earth images | 2001-2004 | 1-2 m | Generating Reference ISA% |
Table 1: Summary of Datasets used in this study.
Development of a New Method
The original Pok17 method
The original Pok17 method contains four steps: (1) generating a fraction image of non-vegetation from MODIS time-series NDVI data (16-day composites) using the TMA method [11]; (2) generating an EANTLI image from yearly MODIS EVI composite data and DMSPOLS NTL data using the method proposed by [16]; (3) building a relationship between ISA% and EANTLI values based on statistically analyzing the above two images, and then estimating the preliminary ISA% for each pixel by applying the relationship; (4) refining the preliminary ISA% values to obtain the final ISA% image. Details of the method can be found in Pok et al. [15].
The cause of the overestimations in the Pok17 method
Pok et al. [15] found that there exist two relationships between ISA % and EANTLI: (1) a natural logarithmic function relationship for ISA% values smaller than 50% (corresponding to EANTLI value of 236); (2) a quadratic polynomial function relationship for ISA% values larger than 50%. The two relationships are given as follows [15]:
ISA%=8.5651 × ln (EANTLI)+1.0063 (if EANTLI<236) (1)
ISA%=-0.00005 × (EANTLI)2+0.1329×EANTLI+19.224 (if EANTLI ≥ 236) (2)
EANTLI can be calculated from DMSP-OLS NTL data and EVI data based on the following equation [16]:
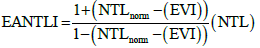 (3)
(3)
where NTLnorm represents the normalized NTL values.
Equations (1) and (2) suggest that the ISA% estimation accuracy should strongly depend on the quality of the EANTLI values. To determine the quality of the EANTLI values, we carried out three simulations using ISA% values of 10%, 40%, and 50%. The results are shown in Table 2. According to the statistical analyses in Pok et al. [15], the ISA% values of 10%, 40%, and 50% correspond to NTL values of 14, 38, and 59, respectively. When we consider a pixel with 10% ISA (Case 1), the remaining 90% of the pixel can reasonably be considered to be covered by vegetation only or by vegetation with different levels of bare soil or by bare soil only. Accordingly, the EVI value of the pixel can rationally vary from 0.9 to 0.1, and thus the relative errors of the calculated EANTLI ranged from 39.3% to 565.4% (Table 2). In contrast, when a pixel has an ISA% that exceeds 40% or 50% (Cases 2 and 3), the probable EVI values will come to lack variety (e.g., they will only vary from 0.1 to 0.5 or 0.6). For these two cases, the relative errors of the calculated EANTLI can be reduced to 22.2%-200.7% for Case 2 and 30.0%-340.6% for Case 3, respectively. In addition, the relative errors of the ISA % estimations for the three cases are 5.2-157.1%, 1.3-19.5%, and 2.4-13.3%, respectively. These findings indicate that the uncertainty of the EANTLI mainly caused larger errors of ISA% estimations in rural areas.
| Corresponding NTL | NTLnorm | Probable EVI | Simulated EANTLI | Relative error* of calculated EANTLI (%) | Estimated ISA% by Eq. (1) | Relative error* of estimated ISA% (%) | |
|---|---|---|---|---|---|---|---|
| Case 1: ISA%=10% | 14 | 0.22 | 0.9 | 2.69 | 9 | 5.2 | |
| 14 | 0.22 | 0.8 | 3.75 | 39.3 | 12 | 23.2 | |
| 14 | 0.22 | 0.7 | 4.95 | 83.9 | 15 | 47 | |
| 14 | 0.22 | 0.6 | 6.32 | 135 | 17 | 68 | |
| 14 | 0.22 | 0.5 | 7.91 | 194.2 | 19 | 87.2 | |
| 14 | 0.22 | 0.4 | 9.77 | 263.3 | 21 | 105.3 | |
| 14 | 0.22 | 0.3 | 11.98 | 345.3 | 22 | 122.8 | |
| 14 | 0.22 | 0.2 | 14.64 | 444.1 | 24 | 139.9 | |
| 14 | 0.22 | 0.1 | 17.9 | 565.4 | 26 | 157.1 | |
| Case 2: ISA%=40% | 38 | 0.6 | 0.6 | 38.24 | 32 | 19.5 | |
| 38 | 0.6 | 0.5 | 46.74 | 22.2 | 34 | 15.2 | |
| 38 | 0.6 | 0.4 | 57.38 | 50 | 36 | 10.8 | |
| 38 | 0.6 | 0.3 | 71.07 | 85.8 | 38 | 6.2 | |
| 38 | 0.6 | 0.2 | 89.34 | 133.6 | 39 | 1.3 | |
| 38 | 0.6 | 0.1 | 114.97 | 200.7 | 42 | 4.1 | |
| Case 3: ISA%=50% | 59 | 0.94 | 0.5 | 150.41 | 44 | 12.1 | |
| 59 | 0.94 | 0.4 | 195.59 | 30 | 46 | 7.6 | |
| 59 | 0.94 | 0.3 | 265.63 | 76.6 | 49 | 2.4 | |
| 59 | 0.94 | 0.2 | 265.63 | 158.5 | 52 | 4.2 | |
| 59 | 0.94 | 0.1 | 662.75 | 340.6 | 57 | 13.3 |
Table 2: Simulated EANTLI values for 3 cases (Data obtained from Pok et al. [15]).
Improving the Pok17 method
Table 3 shows the statistical analysis results obtained in Pok et al. [15]. An NTL value at the 95th percentile was considered to correspond to the ISA% value of each group because these kinds of pixels show minimal effects from bare soil. It can be seen that no saturation problem occurred in the original NTL data in pixels with ISA% values smaller than 40% (i.e., the NTL values still increased with the increasing ISA% in rural areas; see bold NTL values in Table 3). In addition, the blooming effects can also be considered to be weaker in the rural areas. Therefore, by further considering the larger uncertainty of EANTLI and its stronger influence on ISA% estimation in the rural areas, we proposed to use the original NTL data instead of EANTLI data for pixels with NTL value smaller than 38, which corresponds to an ISA% value of 40% (Table 3). For pixels with higher NTL values (i.e., NTL>38), EANTLI is still used (see bold EANTLI values in Table 3) to correct the NTL saturation in urban areas and enhance the light intensity differences between urban centers and suburban regions (i.e., blooming effects correction) [16]. The improved Pok17 method can be expressed as:
| Nighttime light from lower to upper limit | Group based on non-vegetation fraction | |||||||||
|---|---|---|---|---|---|---|---|---|---|---|
| 1-10% | 11-20% | 21-30% | 31-40% | 41-50% | 51-60% | 61-70% | 71-80% | 81-90% | 91-100% | |
| Original NTL data | ||||||||||
| 5th Percentlie | 4 | 4 | 4 | 4 | 4 | 4 | 4 | 4 | 4 | 4 |
| 25th Percentile | 5 | 5 | 5 | 5 | 6 | 6 | 5 | 5 | 4 | 4 |
| 50th Percentile | 6 | 6 | 6 | 7 | 9 | 11 | 11 | 8 | 6 | 6 |
| 75th Percentile | 7 | 8 | 9 | 13 | 23 | 40 | 45 | 42 | 22 | 14 |
| 95th Percentile | 14 | 16 | 23 | 38 | 59 | 63 | 63 | 63 | 63 | 63 |
| EANTLI Data | ||||||||||
| 5th Percentlie | 2 | 2 | 2 | 2 | 2 | 3 | 3 | 3 | 3 | 3 |
| 25th Percentile | 3 | 2 | 3 | 3 | 4 | 4 | 4 | 4 | 4 | 4 |
| 50th Percentile | 3 | 3 | 4 | 5 | 7 | 9 | 10 | 7 | 6 | 6 |
| 75th Percentile | 4 | 5 | 7 | 13 | 38 | 124 | 266 | 389 | 539 | 597 |
| 95th Percentile | 10 | 12 | 22 | 64 | 236 | 358 | 442 | 572 | 693 | 908 |
Table 3: Statistical results of nighttime light for 10 non-vegetation fractions groups obtained from Pok et al. [15].
ISA %=f (NTL) (if NTL ≤ 38) (4)
ISA %=f (EANTLI) (if NTL>38) (5)
Accuracy assessment
We visually interpreted 97 Google Earth image samples (3 km by 3 km) using ArcGIS software to obtain the reference ISA% values, which were used to quantitatively evaluate the estimation accuracy of the improved Pok17 method. The root mean square error (RMSE), system error (SE), and determination coefficient were used for the accuracy assessment. The RMSE and SE are defined as:
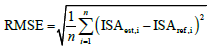 (6)
(6)
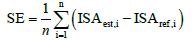 (7)
(7)
where ISAest,i is the estimated ISA% value from the MODIS and DMSP-OLS NTL data for sample i, ISAref,i is the corresponding reference ISA% value, and n is the total number of samples for validation.
Results
The improved Pok17 method
The improved Pok17 method also contains four main steps. Steps 1, 2 and 4 are the same as those in the original Pok17 method. However, in step 3, according to the above findings (i.e., Eqs. 4 and 5), a relationship between ISA% and DMSP-OLS NTL was built, based on statistically analyzing the non-vegetation fraction image and DMSP-OLS NTL image for pixels with NTL values less than 38 (see bold NTL values in Table 3); then, another relationship between ISA% and EANTLI was built based on statistically analyzing the nonvegetation fraction image and EANTLI image for pixels with NTL values larger than 38 (see bold EANTLI values in Table 3). The two new relationships are shown in Figure 2 and are mathematically expressed as:

Figure 2: Relationships between ISA% and NTL (a) or EANTLI (b).
ISA%=1.1056 × NTL-0.1223 (if NTL ≤ 38) (8)
ISA%=0.0755 × EANTLI+34.705 (if NTL>38) (9)
Performance of the improved Pok17 method
Figure 3a shows the results of the accuracy assessment of the improved Pok17 method. The performance of the original Pok17 method is also shown for comparison (Figure 3b). It can be seen that the performance of the improved Pok17 method is better than that of the original Pok17 method, with a slightly increased determination coefficient (0.87 vs. 0.88) and decreased RMSE (11.12% vs. 10.27%) and SE (6.08% vs. 4.28%) values. Especially for samples with reference ISA% values less than 20%, the overestimation was reduced by almost half (with SE values of the improved and original Pok17 method were 3.33% and 6.05%, respectively). In contrast, for the samples with reference ISA% values larger than 20%, the performances of the two methods were similar (with SE values of 5.67% for the original Pok17 method and 6.14% for the improved Pok17 method).

Figure 3: Accuracy of estimated ISA% is assessed by interpreting the corresponding Google Earth images. (a) ISA% estimated using the improved Pok17 method; (b) ISA% estimated using the original Pok 17 method.
Contributions of different ISA% levels
To investigate the ISA contributions at different ISA% levels, we carried out a statistical analysis in the study area. The pixels with estimated ISA% values ranging from 1% to 100% were first divided into 10 levels with a 10% increment. Then, we checked the number of pixels and total ISA area (in km2) for each ISA% level. The results are shown in Figure 4. It can be seen that there is a huge number of pixels at low ISA% levels, and the number dramatically decreased as the ISA% level increased (Figure 4a). The results also show that the pixels with lower ISA% levels contributed most of the ISA area in the study area (Figure 4b). For example, the pixels with ISA% values less than 20% contributed 71% of the total ISA area in the study area.

Figure 4: Statistics for each ISA% level. The pixels with estimated ISA% values ranging from 1% to 100% in the study area were divided into 10 levels with a 10% increment. (a) Number of pixels for each ISA% level; (b) total ISA area for each ISA% level.
By comparing the results from the improved Pok17 method with those from the original Pok17 method, it can be seen that the biggest contributor of ISA area was the first ISA% level (i.e., ISA% of 1-10%) in the former method but the second ISA % level (i.e., ISA% of 11%-20%) in the latter method. In total, the improved Pok17 method estimated an ISA area of 27,144 km2 in the study area, while the original Pok17 method estimated a larger area of 35,696 km2 (about 1.3 times). The pixels with ISA % values less than 20% contributed 67.3% of the total reduction.
Discussion
DMSP-OLS NTL data have been widely used to estimate ISA % values around the world [15,18,19]. However, the saturation problem in urban areas and blooming effects in suburban areas are two obstacles to obtaining accurate ISA% estimations. Many efforts have been made to mitigate the above two problems in the NTL data [16,19-22]. The main approach in these previous studies is to combine a vegetation index with the NTL data. For example, Zhang et al. [20] combined NDVI with NTL data to generate a vegetation-adjusted NTL urban index (VANUI); Zhuo et al. [16] combined EVI with NTL data to generate EANTLI data. Therefore, it can be considered that the quality (or accuracy) of new NTL data such as VANUI or EANTLI data will be strongly influenced not only by the quality of the original NTL data, but also by the quality of the vegetation index data.
In Pok et al. [15], the EANTLI data were used to estimate ISA% in the whole study area [15]. The EANTLI values were calculated from EVI and NTL values using Eq. (3). Generally, the NTL and the EVI values represent the amount of ISA and vegetation in a pixel, respectively. Therefore, in the case of a pixel that is composed of only two land cover types, namely, ISA and vegetation, the value of EANTLI can still accurately represent ISA%. However, in the case of a pixel that includes bare soil, the value of EANTLI will not well represent the ISA% of the pixel because the EANTLI value can vary depending on how the bare soil fraction influences the value of EVI. The existence of bare soil in the rural areas of the study area has been visually confirmed on Google Earth images. Consequently, the uncertainty of the EANTLI values can be considered to be the main reason for the overestimation of the ISA% in rural areas. In this study, we modified the Pok17 method by using the original NTL values instead of EANTLI values for the pixels with lower NTLs (Figure 2a). This improvement allowed us to avoid the use of uncertain EANTLI values and thus promises more accurate ISA% estimation in rural areas (e.g., ISA% values less than 20% in Figure 3). For the pixels with higher ISA% values, the improved Pok17 method gave similar results to those of the original Pok17 method because the EANTLI values were still used for these pixels.
Actually, from the accuracy assessment indices in Figure 3 (i.e., RMSE, SE, and determination coefficient), we did not find a large improvement when comparing the improved and original Pok17 methods. However, when we accumulate these ISA% values in a large-scale area (e.g., on the watershed, national, continental, or global scale), these improvements will become significant because most of the pixels will have ISA% values less than 20% (Figure 4). For example, in our study area, 71% of the total ISA area came from pixels with ISA% values less than 20%.
Although more accurate ISA% estimations in rural areas have been achieved by using original NTL values instead of EANTLI values, overestimations can still be observed in these pixels. This is probably because of the blooming effect in the original NTL data even we considered that blooming effect should be weaker in rural areas. By considering the uncertainty of vegetation index adjusted NTL such as EANTLI or VANUI, more advanced method is necessary to effectively reduce blooming effect in rural areas. For example, the use of land surface temperature in addition to NDVI has shown better performance than VANUI for weakening blooming effect of DMSP-OLS data in four Chinese cities [22]. How the new modified DMSP-OLS NTL data influences ISA% estimation should be further investigated in a future study.
Conclusion
In this study, we found that the uncertainty of EANTLI in rural areas is the main reason for overestimation of ISA% in these areas. Accordingly, we improved the Pok17 method by using a hybrid light data (i.e., original NTL data for rural areas and EANTLI data for urban and suburban areas) instead of only using the EANTLI data for ISA% estimation in the whole study area. This replacement avoided the use of uncertain EANTLI values in rural areas and thus improved ISA% estimation accuracy in these areas. The accuracy assessment results showed that the improved Pok17 method outperformed the original method with an RMSE of 10.3%, an SE of 4.3%, and a determination coefficient of 0.88. A remarkable improvement was found in pixels with ISA% values less than 20%, with the RMSE reduced from 9.7% to 8.1% and the SE reduced from 6.1% to 3.3%. This improvement is significant for evaluating watershed health using accumulated ISA% values, because pixels with lower ISA% values usually account for most of the area in the watershed (e.g., 71% of the total ISA came from pixels with ISA% values less than 20% in our study area).
Acknowledgment
This research was supported by JSPS and LIPI under the JSPS-LIPI Joint Research Program. We would like to appreciate anonymous reviewers for their valuable comments and suggestions for improving the quality of the manuscript.
References
- Sutton PC, Anderson SJ, Elvidge CD, Tuttle BT, Ghosh T (2009) Paving the planet: impervious surface as proxy measure of the human ecological footprint. PPG: Earth and Environment 33: 510-527.
- Klein R (1979) Urbanization and Stream Quality Impairment. J Am Water Resour Assoc 15: 948-963.
- Schueler TR (1994) The Importance of Imperviousness. Watershed Protection Techniques 1: 100-111.
- Arnold CL, Gibbons CJ (1996) Impervious Surface Coverage: The Emergence of a Key Environmental Indicator. J Am Plann Assoc 62: 243-258.
- Weng Q (2012) Remote sensing of impervious surfaces in the urban areas: Requirements, methods, and trends. Remote Sens Environ 117: 34-49.
- Wu C, Murray AT (2003) Estimating impervious surface distribution by spectral mixture analysis. Remote Sens Environ 84: 493-505.
- Wu C (2004) Normalized spectral mixture analysis for monitoring urban composition using ETM+ imagery. Remote Sens Environ 93: 480-492.
- Powell RL, Roberts DA, Dennison PE, Hess LL (2007) Sub-pixel mapping of urban land cover using multiple endmember spectral mixture analysis: Manaus, Brazil. Remote Sens Environ 106: 253-267.
- Yang F, Matsushita B, Fukushima T (2010) A pre-screened and normalized multiple endmember spectral mixture analysis for mapping impervious surface area in Lake Kasumigaura Basin, Japan. ISPRS J Photogramm Remote Sens 65: 479-490.
- Knight J, Voth M (2011) Mapping Impervious Cover Using Multi-Temporal MODIS NDVI Data. IEEE J Sel Top Appl Earth Obs Remote Sens 4: 303-309.
- Yang F, Matsushita B, Fukushima T, Yang W (2012) Temporal mixture analysis for estimating impervious surface area from multi-temporal MODIS NDVI data in Japan. ISPRS J Photogramm Remote Sens 72: 90-98.
- Yang F, Matsushita B, Yang W, Fukushima T (2014) Mapping the human footprint from satellite measurements in Japan. ISPRS J Photogramm Remote Sens 88: 80-90.
- Li W, Wu C (2015) Incorporating land use land cover probability information into endmember class selections for temporal mixture analysis. ISPRS J Photogramm Remote Sens 101: 163-173.
- Nemani R, Running S (1997) Land cover characterization using multitemporal red, near-IR, and thermal-IR data from NOAA/AVHRR. Ecol Appl 7: 79–90.
- Pok S, Matsushita B, Fukushima T (2017) An easily implemented method to estimate impervious surface area on a large scale from MODIS time-series and improved DMSP-OLS nighttime light data. ISPRS J Photogramm Remote Sens 133: 104-115.
- Zhuo L, Zheng J, Zhang X, Li J, Liu L (2015) An improved method of night-time light saturation reduction based on EVI. Int J Remote Sens 36: 4114-4130.
- MRC (Mekong River Commission) (2011) Planning Atlas of the Lower Mekong River Basin.
- Elvidge DC, Tuttle TB, Sutton CP, Baugh EK, Howard TA, et al. (2007) Global Distribution and Density of Constructed Impervious Surfaces. Sensors (Basel) 7: 1962–1979.
- Lu D, Tian H, Zhou G, Ge H (2008) Regional mapping of human settlements in southeastern China with multisensor remotely sensed data. Remote Sens Environ 112: 3668-3679.
- Zhang Q, Schaaf C, Seto KC (2013) The Vegetation Adjusted NTL Urban Index: A new approach to reduce saturation and increase variation in nighttime luminosity. Remote Sens Environ 129: 32-41.
- Liu X, Hu G, Ai B, Li X, Shi Q (2015) A Normalized Urban Areas Composite Index (NUACI) Based on Combination of DMSP-OLS and MODIS for Mapping Impervious Surface Area. Remote Sens 7: 17168-17189.
- Hao R, Yu D, Sun Y, Cao Q, Liu Y, et al. (2015) Integrating multiple source data to enhance variation and weaken the blooming effect of DMSP-OLS light. Remote Sens 7: 1422-1440.

