 Spanish
  Chinese
  Russian
  German
  French
  Japanese
  Portuguese
  Hindi
Hindi Special Issue Article, Geoinfor Geostat An Overview Vol: 0 Issue: 0
An Integrated GIS for Wastewater Management
Giungato G*, Mariella L and Pellegrino D
Universita` del Salento, Dip.to di Scienze dell'Economia, Complesso Ecotekne, Via per Monteroni, 73100 Lecce, Italy
*Corresponding Author: Giungato G
Università del Salento, Dip.to di Scienze dell'Economia, Complesso Ecotekne, Via per Monteroni, 73100 Lecce, Italy
Tel: +(39) 0832 298741
E-mail: giungato.giuseppina@unisalento.it
Received: July 02, 2019 Accepted: July 22, 2019 Published: July 30, 2019
Citation: Giungato G, Mariella L, Pellegrino D (2019) An Integrated GIS for Wastewater Management. Geoinfor Geostat: An Overview S2.
Abstract
Recently, several studies have discussed and analyzed the quality of groundwater in the Apulia Region (Italy). Housing and industries, which are only partially connected to the sewer system and the wastewater treatment plant, particularly represent a primary source of groundwater pollution with serious consequences for the ecosystem. The aim of this paper is to propose an integrated Geographic Information System (GIS) for the water and sewer networks of a pilot municipality in the province of Lecce (Italy) as a useful tool to support territorial management and planning policies. Furthermore, some statistical indicators are discussed and implemented into the integrated GIS, in order to monitor the water and sewer networks in the pilot area. Finally, the results concerning the water quality analysis for some public wells sampled over the municipality under study are added in the GIS project.
Keywords: Sewer network, Territorial planning policies, Water quality assessment
Introduction
Water resources management and protection, which is included in the societal challenges of Horizon 2020 (European Commission [1]), represent not only one of the world's biggest environmental issues, but also a driver of sustainable economic and social growth. A right balance between the growing demand of water for different uses and the maintenance of the functionality of the ecosystems must be reached for a sustainable governance of the water resources. Safe water supplies, hygienic measures for sanitation and good water management are essential in order to improve health conditions, to provide economic benefits and to contribute to the society development (World Health Organization [2]). In the last decades, community, national and local regulations regarding the rational use of water and pollution prevention have been introduced. In Italy, the Environmental Code (Legislative Decree 152/2006), Legislative Decrees 152/1999 and 258/2000 represent relevant normative references.
Furthermore, the first report concerning the water quality and management, which was published in 2002, has pointed out 8 issues relating to water management, among which the following are worth highlighting: a) lack of knowledge about water quality; b) irregularity and deficiency of access to drinking water for many citizens; c) water pollution and extreme depletion of national water resources; d) water management fragmentation and increase of conflicts in its management, both at national and local levels. The integrated water cycle management, with reference to supply, potabilization, distribution, collection and purification of wastewater, represents one of the Apulian Region's priorities, for civil, agricultural, industrial and energy uses. The Apulian Aqueduct Company (AAC) manages the integrated water cycle; in particular, it provides the capture, the adduction, the water purification, the distribution of water for civil uses, as well as the sewerage management and the wastewater purification services for the Apulia Region and for some municipalities of other regions. In water services management, the main problems concern network losses and urban wastewater treatment capacity. Generally, the network losses depend on a set of events which occur in the various phases of the integrated water cycle, from the procurement to the distribution of water resources to end users. The AAC ensures daily control of losses through the following activities: network monitoring by using acoustic techniques (geophones, correlators and noise loggers), control of network pressures, quick and quality repairs, and scheduled maintenance of water infrastructure. As regards to water quality, the AAC is equipped with qualified technicians, who perform daily checks at every stage of the production and distribution cycle. They usually collect water samples from sources, reservoirs, wells and public fountains, which are analyzed in chemical and microbiological (central and peripheral) laboratories, as well as in laboratories located in the potabilization plants.
In this context, the management of the water and sewer networks can be supported by an integrated GIS based on georeferenced data concerning the area of interest.
In the literature, several definitions of GIS have been provided [3-7]. As well known, a GIS is a computerized system designed to support the management of territorial and environmental issues through the analysis of georeferenced data [8-11]. In a GIS project the geographic data are organized into informative layers or thematic levels [12-14], linked to alphanumeric attributes saved in relational databases.
In the last decades, several studies have shown the importance of applying GIS to environmental and resource economics [15]. The GIS represents a very useful tool in order to support environmental monitoring, assessment and management [16,17]. Foster and McDonald [18] described the use of GIS techniques in the formulation of a raw water monitoring program to assist in the intake operation and land-use planning in the catchment; Zhao et al. [19] developed an eco-suitability evaluation method based on GIS technology, and Shomar et al. [20] proposed a GIS tool to construct thematic maps for groundwater quality in the Gaza strip, since they considered these maps as a baseline for water planners and policy makers.
Moreover, the integration between GIS and geostatistical tools can help the researcher to analyse the spatial and/or spatiotemporal distribution of the selected variable. Note that GIS and Geostatistics integration has been of interest since the early 1990s, when the potential benefits of a close link between information systems and spatial analysis were examined [21,22]. Recently, some contributions have shown the usefulness of the integration between GIS and Geostatistics in specific environmental sectors [23-29]. In this paper an integrated GIS for the water and sewer networks in a municipality of Lecce Province (Italy) is proposed. Furthermore, some statistical indicators regarding the water and sewer networks are described. Finally, the results concerning water quality analysis for some public wells sampled in the municipality of interest are integrated in the GIS project and discussed.
Integrated GIS for the Water and Sewer Networks
Generally, the main steps to implement an integrated GIS involve database design, data collection, integration of data from different sources, loading geographic and alphanumeric data into a GIS software and the development of final user application.
The proposed GIS uses a complex and structured computerized database for the acquisition of new data and integration of existing data which come from different sources (Municipal Registry, AAC, Territorial Agency of Lecce). The heterogeneity in data sources and format requires the conversion and manipulation of data, which should be characterized by the same unit of measure and geographic reference system, in order to obtain a unified databases management.
This integrated GIS is a very useful tool to: a) quickly manage a large amount of georeferenced and alphanumeric data; b) perform a search both in tabular and graphic form through interactive thematic maps; c) plan the extension of the water-sewer networks in the areas of expansion of a municipality; d) support the analysis of environmental impact; e) identify scenarios of deep groundwater pollution risk deriving from possible abuse.
In the GIS developed herein, the following geographic elements are implemented for the municipality under study: administrative limits and urban centre (UC) limits; road network graph; Water Network (WN) and Sewer Network (SN) graphs; a map of cadastral parcels. The databases integrated into the GIS project must be able to provide the following information: resident households for each street of the urban area under study; contracts for connection to the water and sewer networks; cadastral parcels and buildings.
For the selected municipality, the administrative limits and the urban centre (UC) limits are available as a vector theme of a polygonal type, in shapefile format (.shp), as described in Figure 1. Instead, the graph of the road network is a linear theme, in shapefile format (.shp), which includes state, provincial and municipal roads (Figure 2). Finally, the graphs of the WN and SN are linear themes, provided in .dwg format and successively converted into a shapefile format (.shp), which include all the streets, with the corresponding name, where water and sewer networks have been realized (Figure 3). The map of the cadastral parcels, provided by the observed municipality in .dxf format, contains the parcels, buildings and fiducial points graphs with the corresponding reference labels (Figure 4).

Figure 1: (a) Administrative limits (b) UC limits of the selected municipality.

Figure 2: Road network graph of the selected municipality.

Figure 3: Graphs of the municipal (a) WN and (b) SN.

Figure 4: Map of the cadastral parcels of the selected municipality.
Table 1 shows the information and the corresponding fields (identifiers) stored into the integrated GIS project, provided by the reference sources, such as the Municipal Registry, the AAC and the Territorial Agency of Lecce. More specifically, the data provided by the Registry of the municipality under study refer to the head of the household (name and surname), the residence and the number of members of the family. The AAC has provided a detailed list of all the contracts stipulated (agreements signed) for the connections to the WN or SN with the following information: contract number, status (terminated, paid, request), typology (agricultural use, commercial use, domestic use, industrial use, occasional and temporary use, public use), and plant location. Furthermore, the data referring to the cadastral parcels and buildings, provided by the Territorial Agency of Lecce, and stored into the geodatabase, include, for each building, the information regarding the cadastral sheet and the parcel number, category, class, consistency, rent of the property, date of the building construction, cadastral area, address and description.
| Database source | Field | Information |
|---|---|---|
| Municipal registry | Surname | Surname of the head of the family |
| Name | Name of the head of the family | |
| Address | Street name where the family resides | |
| Street nr. | House number where the family resides | |
| Membersfam nr. | Number of family members | |
| AAC | Contract | Contract Nr. |
| Status | Status of the relationship between user and AAC | |
| Tipology | Use for which the contract is stipulated | |
| Ulm | House identification code | |
| Sewer connection | Link between a water contract and a sewer con- tract |
|
| Plant location | Address (street name and house number) where the contract was signed | |
| Lecce territorial agency | Sheet | Number of the cadastral sheet |
| Parcel | Number of parcel containing the building | |
| Category | Identification code of the typology of building (stately, civil,· · · ) | |
| Class | Value associated with the building class | |
| Consistency | Building width in m2, m3 or Number of rooms | |
| Rent | Value of the building | |
| Date class | Date of the building construction | |
| Cadastral area | Cadastral area occupied by the building | |
| Address | Street name and house number of the building | |
| Description | Any modification made to the building |
Table 1: Tabular databases stored into the integrated GIS for the water-sewer networks.
The database of the Municipal Registry
The Registry of the selected municipality has provided a database containing information on the 5,133 families residing in the area under study. Note that the fields “Surname” and “Name” contain, respectively, the surname and the name of the head of the family; whereas, the “Address” and “Street Nr.” fields include, respectively, the road name and the house number regarding the family's residence. Finally, the “Membersfam Nr.” field indicates the number of family members.
The AAC database
With reference to the data regarding the connections to the WN and SN, the AAC provided a detailed list of all the contracts stipulated in the municipality. Some fields of the AAC database are described as follows.
The contract number, defined in the “Contract” field, is filled in the form “1997 C 839711”, where the first number refers to the subscription year and the second one is an identifier of the contract. The field “Status” admits the following methods of insertion: “Paid”, when the water supply and/or sewer contract is already active; “Ceased”, if the water supply and/or sewer contract is terminated; “Request” and “Request for termination” if there are, respectively, a request for connection to the water and/or sewer network or a request for recession from the supply contract. Some of the specific types of contract, contained in the “Typology” field, are the following: “Sewer connection”, relating to sewer service contracts associated with a water service record; “Agricultural use”, related to water service contracts stipulated for agricultural purposes; “Domestic use”, “Domestic use (divisional)”, “Domestic use (sum)”, referred to water service contracts stipulated for domestic use; “Commercial use”, “Commercial use (divisional)” and “Industrial use”, regarding the water service contracts stipulated for commercial and industrial activities; “Public use” and “Public use with hydrometric lens”, related to water service contracts stipulated by public bodies; “Occasional and temporary use”, relating to contracts stipulated for a non-permanent use of service (usually, these types of contract are exclusively of water type). In the “Sewer connection” field, the contracts are registered with different status, i.e. “Disconnected”, for contracts stipulated in order to obtain only the water supply service, “Direct sewer”, for contracts stipulated for the simultaneous use of both water and sewer services (in this case there is a single discharge for removal), “Indirect sewer”, for contracts stipulated to take advantage simultaneously of both water and sewer services (in this case there are more drain pipes which flow into a single well). The “Plant location” field contains the address (street and house number) where the contract was signed.
The database of the Lecce Territorial Agency
The database provided by the Territorial Agency of Lecce contains information about the buildings located in the studied municipality. It particularly collects detailed information for each cadastral parcel, which is a continuous portion of land or building, belonging to the same owner and characterized by the same designated use.
The “Sheet” and “Parcel” fields identify a cadastral parcel by a sheet number of the cadastral map and a parcel number, respectively. The “Category” field contains the identification code of the building typology.
Different identification codes are grouped as follows: group A, for residential units and offices; group B, for public use units; group C, for commercial use units and outbuildings; group D, for industrial and special commercial units, including factories, hotels, pensions, hospitals; group E, for community interest units, including stations for land, sea or air transport services, municipal and provincial bridges subject to tolls. The houses of an economic type, identified by the code A/3, correspond to 3,236 units and represent the most widespread typology of building. Furthermore, it is possible to identify 2,056 type C/6 buildings, for example stalls, stables, depots and garages; 1,673 cheap dwellinghouses (A/4) and 801 well finished dwelling-houses (A/2). The “Consistency” field stores the size of the building. According to national regulations (D.P.R. 138/1998) the consistency is calculated with different criteria based on the reference group. The consistency is expressed in number of main rooms for units listed in group A; for units listed in group B, it is expressed in cubic meters (m3), while for units listed in group C it is expressed in square meters (m2) of the net area. In the “Rent” field, the Territorial Agency stores the cadastral value of the building, assigned for tax purposes based on estimate tariffs, established taking into account different parameters, such as the municipality of reference, the census zone, the category and the typology of the building. In the database, information about the rent for buildings used as a public place of cult (E/7) is omitted. Further information stored in the database concerns the date of construction, entered in the “Date Class” field, and the street name and the house number, which are stored in the “Address” field. Finally, the “Cadastral area” field records the value of the cadastral area occupied by the building, while the “Description” field holds information relating to any modification made to the property of reference, for example changes in class, annuity, ownership of the building.
Implementation of the integrated GIS
The alphanumeric attributes stored in the AAC, Lecce Territorial Agency and municipality databases can be georeferenced, namely each datum can be associated to the corresponding geographic entity (Figure 5). As shown in Figure 5, the “join” and “relate” operations realize the links between the attributes and the geographical elements. Note that the “join” operation between the cadastral map and the cadastral database is realized through the “Parcel” field. Instead, the “relate” operation between the cadastral database, the Municipal Registry and the AAC database is applied by using the road name field.

Figure 5: Links and relationships among different databases.
The information provided by the Registry of the analyzed municipality, the AAC and the Territorial Agency has been implemented in the proposed GIS by using the ArcGIS 9.2 software of ESRI (Environmental Systems Research Institute). In order to facilitate the territorial analysis, it is possible, for example, to select in the GIS a cadastral parcel and, by linking the tables, it is easy to find a building over the selected parcel. Furthermore, through the query tool, the user can obtain detailed information about:
• the selected building (Territorial Agency database);
• the presence or absence of the connection to the WN and/or SN (AAC database);
• data regarding the people living in the selected house (Municipal Registry database).
Statistical Indicators
The administrative and urban centre limits, the road network and the WN and SN of the municipality under study are shown in Figure 6, with the number of families and the number of residents in the municipality, in the urban center and in the area served by the SN (SN area).

Figure 6: WN, SN, administrative and urban center limits, of the selected municipality.
In the municipality under study, characterized by 5,133 resident families, the number of connections to the WN and SN are 3,835 and 956, respectively.
In order to monitor the water and sewer networks in the pilot area, some statistical indicators have been developed by using quantitative data saved into the GIS project (Table 2).
| Statistical indicator | Description | Value |
|---|---|---|
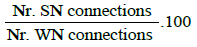 |
Nr. of SN connections per 100 WN connections | 24.18 |
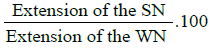 |
Extension in meters of the SN per 100 meters of WN | 63.97 |
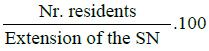 |
Nr. of residents per 100 m of SN | 39 |
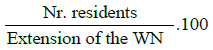 |
Nr. of residents per 100 m of WN | 25 |
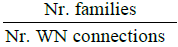 |
Nr. of families for each connection to the WN | 1.56 |
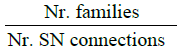 |
Nr. of families for each connection to the SN | 6.45 |
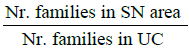 |
Nr. of families resident in the SN area per UC family | 0.81 |
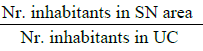 |
Nr. of residents in the SN area per UC resident | 0.79 |
Table 2: Statistical indicators and the corresponding values, for the selected municipality.
It is evident that in the area under study, there are 24 SN connections per 100 connections to the WN and there are about 64 m of SN for every 100 m of WN. Nevertheless, for every 100 m of WN and SN, there are approximately 39 and 25 inhabitants potentially served by WN and SN, respectively. In the selected municipality, there are about 2 families per each WN connection, on average, while approximately 6 families are recorded per each SN connection. Finally, the ratio between the number of families present on the SN area and the number of UC families is equal to 0.81 and the ratio between the number of residents on the SN area and the number of UC residents is equal to 0.79. Note that the values of these last two indicators highlight that, in the UC of the municipality under study, there are inhabitants without an SN connection, who evidently use different forms of wastewater treatment.
Results and Discussion
Water quality analysis
Water quality monitoring activities represent an effective tool to control the level of water pollution and are a valid support to the territorial planning. These activities have been established by Legislative Decrees 152/1999 and 31/2001 which regulate water pollution prevention and the quality of water intended for human consumption, respectively. Water from lakes and rivers, as well as groundwater often contain dangerous concentrations of viruses, bacteria and chemicals from industrial waste, sewers, landfills or agricultural crops subjected to irrational fertilization based on pesticides and herbicides. Therefore, in order to assess compliance with water quality standards established by current legislation, it is advisable to monitor the qualitative status of this water by carrying out laboratory tests on water samples taken from the various sources of supply (wells, springs, etc.). In this context, the water of three public wells, named P1, P2, P3, located in the territory of reference, has been analyzed by evaluating: a) chemical-physical parameters (pH, conductivity at 20°C, hardness, fixed residue at 180°C, alkalinity); b) anions or non-metallic inorganic compounds (chloride, fluoride, nitrate, nitrite and ammonium ions); c) metals (calcium, magnesium, sodium, potassium); d) microbiological parameters (fecal coliforms and total coliforms).
The P3 well (Sport facilities) is located in the urban center of the municipality, served by public sewers. On the other hand, the other two wells, P2 (Municipal deposit) and P1 (Sports field), located outside the urban centre, are without sewage systems.
The empirical results of the water quality analysis are summarized in Table 3 which indicates the observed values for each quality parameter and for each sampled well.
| Quality parameter | Parameter type | Unit of measure | Observed parameter value | ||
|---|---|---|---|---|---|
| P1 | P2 | P3 | |||
| PH | Chemical-physical | pH units | 7.79 | 7.37 | 7.68 |
| Conductivity at 20◦C | Chemical-physical | µS/cm | 1,159 | 1,083 | 705 |
| Hardness | Chemical-physical | ◦F | 42.8 | 39.6 | 30 |
| Fixed residue at 180◦C | Chemical-physical | mg/l | 695.4 | 631 | 428 |
| Alkalinity | Chemical-physical | mg CaCO3/l | 300 | 300 | 200 |
| Chloride | Anions | mg/l | 124.55 | 89.41 | 46.47 |
| Sulfate | Anions | mg/l | 32.19 | 38.38 | 23.7 |
| Fluoride | Anions | mg/l | 0 | 0.16 | 0.22 |
| Nitrate | Anions | mg/l | 36.6 | 81.47 | 60.19 |
| Nitrite | Anions | mg/l | 0 | 0 | 0 |
| Ammonium ion | Anions | mg/l | 0.1 | 0.14 | 0.1 |
| Calcium | Metals | mg/l | 318 | 294 | 228 |
| Magnesium | Metals | mg/l | 4 | 3.9 | 3.7 |
| Sodium | Metals | mg/l | 75 | 98 | 60 |
| Potassium | Metals | mg/l | 0.92 | 0.89 | 0.45 |
| Fecal coliforms | Microbiological | N r./100 ml | 10 | 50 | 20 |
| E. coli | Microbiological | N r./100 ml | 1 | 15 | 13 |
| Enterococci | Microbiological | N r./100 ml | 1 | 4 | 60 |
| Total colifors | Microbiological | N r./100 ml | 20 | 65 | 30 |
| Colony count at 22◦C | Microbiological | N r./ml | 102 | 152 | 134 |
| Colony count at 36◦C | Microbiological | N r./ml | 53 | 93 | 79 |
Table 3: Observed values for each quality parameter and for each sampled well.
It has been noted that water sampled at the three wells was basic, since the pH assumed values higher than 7; in addition, water from the wells located at the sports field and the municipal depot had a high hardness, with values exceeding 30°F. It is well known that the hardness causes limescale deposits in the pipes, especially in heating systems. Regarding the anions or the inorganic compounds, the values observed for these parameters fell within the regulatory limits, with the exception of the nitrate concentrations detected in the water of the municipal depot well (P2) and the sport facilities well (P3), which exceed the regulatory limits. It is worth noting that high levels of the nitrates concentration in water are often due to agricultural activity, for example, the use of nitrogen fertilizers.
With reference to metals, the measured values were within the limits established by law. However, the detected microbiological parameters did not meet the legal requirements. In particular, the values of fecal (E. coli and enterococci) and total coliforms were very high in the wells P3 and P2. The presence of E. coli and Enterococci in water, especially in drinking water, must be reported to the local health authority and indicated as non-observance of the parametric value. In this case, the analyzed water is exclusively for agricultural use, therefore there is no risk to human health. However, it is necessary to ascertain the causes that have determined this state of water non-compliance with current regulatory values in order to adopt corrective measures aimed at restoring the conditions of good water quality.
The results of the water quality analysis have been implemented into the integrated GIS. This integration between SN and WN georeferenced data, as well as sample information recorded for some wells of the analyzed municipality, can provide the policy makers with interesting hints that assist them in planning strategic actions, aimed at environment and water resources protection.
Conclusion
In this paper an integrated GIS for the WN and SN of a pilot area located in the south of the Apulia Region (Italy), was proposed. The developed GIS was based on a huge amount of georeferenced data integrated with some statistical indicators concerning the comparison of the WN and SN of the area under study.
Furthermore, the results regarding the analysis of water quality for three public wells, located in the municipality of reference, were added in the GIS project, since the quality of surface and groundwater represent an important aspect, related to the protection and management of water resources.
This territorial information system enables an assessment of possible improvements to the water-sewer service, with benefits for users and represents a useful tool to support territorial management and planning policies.
The originality of the developed GIS project is clearly derived from the integration of the descriptive analysis about the watersewer networks with the water quality analysis in the pilot area. The proposed statistical indicators and the methodology applied in this paper represent a very useful tool in planning strategic actions aimed at a sustainable governance of the water resources.
A new goal in water and sewer management could be represented by the integration of GIS tools with geostatistical techniques, which can certainly support the evaluation of alternative scenarios and possible strategies for a sustainable development.
References
- European Commission (2016) Horizon 2020 Annual Monitoring Report 2015.
- World Health Organization (2018) A global overview of national regulations and standards for drinking-water quality.
- Bateman IJ, Jones AP, Lovett AA, Lake IR, Day BH (2002) Applying geographical information systems (GIS) to environmental and resource economics. Environ Resour Econ 22: 219-269.
- Arono S (1989) Geographic information systems. A management perspective. Geocarto Int 4: 58.
- Cowen DJ (1988) GIS versus CAD versus DBMS: What are the differences? Photogramm Eng Remote Sens 54: 1551-1555.
- Longley P, Goodchild M, Maguire D, Rhind D (1990) Geographic information Systems: Principles, techniques, applications and management. Wiley, New York.
- Ozemoy VM, Smith DR, Sicherman A (1981) Evaluating computerized geographic information systems using decision analysis. Interfaces 11: 92-100.
- Burrough PA (1986) Principles of geographical information systems for land resources assessment, monographs on soil and resources survey. Geocarto Int 1: 54.
- Bolstad P (2005) GIS fundamentals, A first text on geographic information systems. Eider Press, Minnesota.
- Chrisman N (2002) Exploring geographic information systems. John Wiley and Sons, Toronto.
- Lo CP, Yeung AKW (2007) Concepts and techniques of geographic information systems. Pearson Education Canada Inc, Toronto.
- Star J, Estes J (1990) Geographic information systems: An introduction. Geocarto Int 6: 46.
- Maguire DJ, Goodchild MF, Batty M (2005) GIS, spatial analysis, and modeling. ESRI Press, California.
- Rana S, Sharma J (2006) Frontiers of geographic information technology. Springer, Berlin.
- Wong DWS, Lee J (2005) Statistical analysis of geographic information with ArcView GIS and ArcGis. J Wiley & Sons, Toronto.
- Tsou M (2004) Integrated mobile GIS and wireless internet map servers for environmental monitoring and management. Cartog Geogr Inf Sci 31: 153-165.
- Gonzàlez Del Campo A (2012) GIS in environmental assessment: A review of current issues and future needs. J Environ Assess Policy and Manag 14: 1-23.
- Foster JA, McDonald AT (2000) Assessing pollution risks to water supply intakes using geographical information systems (GIS). Environ Model Softw 15: 225-234.
- Zhao YW, Qin Y, Chen B, Zhao X, Li Y, et al. (2009) GIS-based optimization for the locations of sewage treatment plants and sewage outfalls - A case study of Nansha District in Guangzhou City, China. Commun Nonlinear Sci Numer Simul 14: 1746-1757.
- Shomar B, Fakher SA, Yahya A (2010) Assessment of groundwater quality in the Gaza Strip, Palestine using GIS mapping. J Water Resour Prot 2: 93-104.
- Anselin L (1992) Spatial data analysis with GIS. National Center for Geographic In- formation and Analysis, University of California, USA.
- Goodchild MF (1987) A spatial analytical perspective on geographical information systems. Int J Geogr Inf Sci 1: 327-334.
- Boots B (2000) Using GIS to promote spatial analysis. J Geogrl Syst 2: 17-21.
- Burrough PA (2001) GIS and geostatistics: Essential partners for spatial analysis. Environ Ecol Stat 8: 361-377.
- Wise S, Haining R, Ma J (2001) Providing spatial statistical data analysis functionality for the GIS User: The SAGE project. Int J Geogr Inf Sci 15: 239-254.
- Maggio S, Cappello C, Pellegrino D (2013) GIS and geostatistics for supporting environmental analyses in space-time, contributions to statistics, In: Montrone S, Perchinunno P (eds.) Statistical methods for spatial planning and monitoring. Springer, Verlag, pp: 77-92.
- De Iaco S, Distefano V, Posa D (2013) Geostatistica e GIS, Tecniche e strumenti per il monitoraggio ambientale. In: Guido G, Massari S (eds.) Lo sviluppo sostenibile, Ambiente, Risorse, Innovazione, Qualità. Franco Angeli Editore, Italy, pp: 137-152.
- De Iaco S, Distefano V, Maggio S, Palma M, Spennato A (2015) Radon risk analysis through geostatistical tools implemented in a WebGIS, In: Farhad N (ed) Current air quality issues. Intech, Capitolo, pp: 397-417.
- De Iaco, S, Maggio S, Palma M (2017) Radon predictions with GIS covariates: From spatial sampling to modeling. Geogr Anal 49: 215-235.

