Research Article, J Nucl Ene Sci Power Generat Technol Vol: 11 Issue: 1
Design and Analysis of Suspension Test Rig
Prasanna Mishra*, V. M. Murugesan, G. Anand Raj
Department of Automobile Engineering, PSG College of Technology, Coimbatore,Tamil Nadu, India
*Corresponding Author: Prasanna Mishra
Department of Automobile Engineering, PSG College of Technology, Coimbatore, Tamil Nadu, India
Tel: 9490303888;
E-mail: prasannamishra234@gmail.com
Received date: 29 December, 2021, Manuscript No. JNPGT-21-45672;
Editor assigned date: 31 December, 2021, PreQC No. JNPGT-21-45672(PQ);
Reviewed date: 14 January, 2022, QC No. JNPGT-21-45672;
Revised date: 21 January, 2022, Manuscript No. JNPGT-21-45672(R);
Published date: 24 January, 2022, DOI: 10.4172/2325-9809.1000252
Citation: Mishra P, Murugesan VM, Raj GA (2021) Design and Analysis of Suspension Test Rig. J Nucl Ene Sci Power Generat Technol 11:1.
Abstract
The automobile suspension system is intended to provide a good road holding characteristic to ensure maximum traction at all road conditions and a good ride comfort to the passengers by absorbing a part of the vibrations induced by the road profile. It is primary that the above two functions of the suspension system are satisfied and therefore during the design phase several simulations and testing are carried out extensively. Here, an attempt has been made to design and analysis of quarter car suspension test rig that can be used to study the behavior of a given suspension system for a given sprung mass in a dynamic environment. The test rig offers higher flexibility to incorporate different types of suspension systems at a lower cost. The test rig can induce the road profile and measure the system responses such as sprung and unsprung mass vibrations and the test rig can load external body forces such as aerodynamic forces and vehicle roll induced moment forces by using actuator acting over the sprung mass. The system design of the suspension system was performed using MATLAB Simulink environment. The structure of the test rig was built using CATIA V5 software and the same was analyzed in ANSYS Workbench. The test rig employs the use of hydraulic systems in order to actuate the quarter car system model.
Keywords: Automobile; Quarter car model; Suspension system; Suspension test rig
Introduction
HEN it comes to designing a new automobile, suspension system design is one of the most crucial aspects, for a lot of the vehicle’s attributes depend on it. One key element in optimizing the suspension system characteristics is extensive testing. A vehicle’s suspension system must be tested thoroughly to ensure optimal performance, safety, and occupant comfort, in any driving condition. M. Senthil Kumar et al., (2007) have discussed the various parameters employed to test a suspension setup in their paper, which were used to optimize its performance for improved ride comfort [1]. Also, the vehicle parameters specified in this paper were used in the test rig simulations performed in this project work. J.B. Ashtekar et al., (2014) have explained the various aspects of developing a model of a suspension system and suspension test rig using SIMULINK and validating the results [2]. Mahmoud Omar et al., (2017) explain the development of a set of experimental quarter-car test rigs to test fully active and passive suspension systems [5]. Christopher Lauwerys et al., (2004) detailed the development of a robust linear controller for an active suspension system mounted on a quarter-car test rig, which achieves the desired performance in both simulation and experimental test-rig [7].
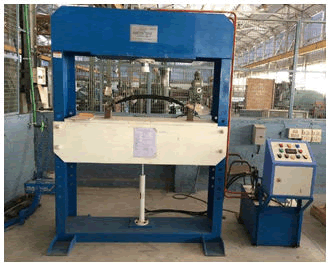
Figure 1:Existing suspension test rig.
The existing suspension test rig shown is in Figure 1which can be used to perform tests on leaf springs and with some special attachments for coil springs and dampers to determine their parameters. The measurements are to be manually carried out since the machine doesn’t have sensors incorporated in it to measure the test results. Therefore, the test results are subjected to human errors that make the results invalid. Further, the existing test rig is manually operated, and it cannot be used to study the entire suspension system behavior. The specifications of the existing suspension system are briefed in Table 1.
Table 1: Specifications of existing test rig.
System Design
Road inputs
Shaker test rig is actuated by providing road profiles and external body forces that were recorded during road tests of the vehicle for standard testing and evaluation of the suspension system. The results obtained from the road tests and shaker test rigs are then convolved together. Shaker test rigs include 4-post, 7-post and 8-post test rigs that are able to load an entire vehicle whose suspension system is tested and evaluated. For quarter car test rigs however, road inputs are specified by a sine wave, bump input or Power Spectral Density (PSD). Roads can be approximated into a sine wave of low amplitude and low frequency wave. The drawback of this type of characterization is that only paved roads can be realized, off-road conditions cannot be characterized since it is of more irregular nature. Bump inputs are more common types of road profile that is generally specified by a sine wave spanning form 0 rad to π rad, whose amplitude denotes the bump height and half of its wavelength represents the base length of the bump. Power spectral density function is an efficient method used to characterize road profiles as it accommodates randomly occurring large irregularities like that of potholes and bumps on roads. PSD uses only few parameters and simple functions that can produce different types of road profiles both on and off-road conditions. The road profile used for the simulation of suspension system here is a bump input which is represented.
Where h is the bump height, v is the vehicle velocity, t is the simulation time, d is the length of bump and l is the longitudinal length travelled by the wheel.
Model development
Here the simulation is carried out for a Quarter Car Model with sprung and unsprung mass modelled together as two degrees of freedom using spring mass damper system. In this model, the tire has been replaced by a spring of stiffness ‘Kt’ and tire damping coefficient ‘Ct’. For this quarter car model, two equations of motion are derived by using Newton’s second law of motion. Table 2 shows the nomenclature of all the parameters and its corresponding values.
Table 2: Nomenclature of parameters.
The governing equations are derived from D’Alembert’s principle and are expressed in. From the governing equations described above the objective functions can be derived. Ride comfort can be measured by the sprung mass acceleration and road holding can be measured using the difference of unsprung mass displacement and road displacement as described by equations.
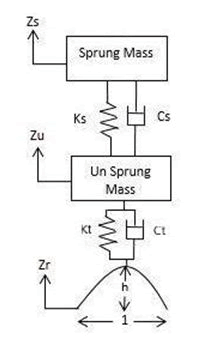
Figure 2:Quarter car model.
The quarter car model was created from the governing equations using MATLAB SIMULINK and the model is as shown in Figure 3.
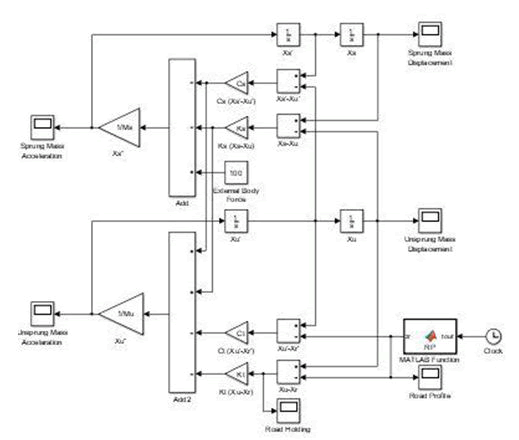
Figure 3:Simulink model of 2 DOF quarter car model.
General description: The quarter car model test rig is designed to simulate the response of one corner of the vehicle. The test rig employs a hydraulic system that actuates the road profiles and external body forces on the quarter car model installed on the test rig. The test rig consists of the frame, sprung mass connected to the adapter plate which is connected to the frame by means of a linear guide to facilitate the vertical reciprocating motion. CATIA V5 is the CAD software package used for modeling the entire hardware systems. The full assembled view of the test rig is as shown in the Figure 4.
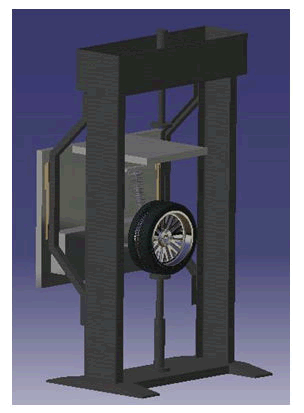
Figure 4:Fully assembled model of suspension test rig.
Frame: The frame is an existing piece of hardware that was used for testing of leaf springs. This frame was to be modified to install the quarter car model. The frame must be designed to make it rigid and absorb all vibrations. This is important so that the sensors mounted over it will not be induced from external noises. Frame must be withstood all the forces generated by the hydraulic system and suspension system and safely transmit the loads to the ground. The frame is about 2 m tall and has a foot span of 1.7 m × 0.4 m length by width. The base of the frame is shaped to minimize the space requirements. The frame consists of two rails on either side which connects with the adapter plate and sprung mass through the linear guide. The rails were designed to withstand bending loads that are induced from the suspension system [8].
Sprung mass and adapter plates: The adapter plate supports the McPherson strut suspension suspension system through its lower control arm assembly with an attachment which holds the strut and coil spring of the suspension system. The adapter plate is designed to withstand the loads exerted by the suspension system during excitation of the road profile from the test rig actuators and during application of external load which is applied through the adapter plate to the suspension by means of hydraulic cylinder which when applies vertical force through the adapter plate, it must safely transmit the force to the quarter car model through the suspension strut. The adapter plate connects with the linear guides so that it it can reciprocate vertically realizing the sprung mass vibrations [9].
Linear guides: Linear guide selected for the application is a TLC series Compact Rail of Rollon linear guides. This component offers load carrying capacity of 10000 N and 15000 N in the axial and radial direction respectively. It is suitable to work under dirty environments and requires low maintenance. The linear guide rails are attached to the rails of the frame and the roller assembly is connected to the sprung mass that reciprocates vertically based on the excitation provided to the suspension system. The guide is capable of translate with a maximum velocity of 9 m/s and maximum acceleration of 20 m/s2.
Hydraulic system: The hydraulic circuit of the quarter car model suspension test rig is intended to control the two hydraulic cylinders (actuators) in which one of them controls the road profile which may be a bump input, sinusoidal wave or the road profile maybe characterized by power spectral density parameters. The other actuator exerts the external body force, and it is applied by means of input from a load cell and the control system actuates the hydraulic cylinder in order to maintain a constant load over the sprung mass. The hydraulic cylinders are selected based on Euler’s buckling criterion for columns and cylinder bore diameter of 80 mm and piston diameter of 60 mm for both hydraulic cylinders. Solenoid operated spring-loaded directional control valves were used to direct the flow of hydraulic fluid. A positive displacement pump of 0.22 l/s displacement was used to pump the fluid throughout the circuit. The hydraulic fluid is petroleum based mineral oil of HL series which is selected to make it compatible with accumulator and pump. The accumulator selected was a bladder type accumulator of capacity 0.35 l. The accumulator serves as an auxiliary unit to compensate the flow of hydraulic fluid to maintain constant load at the hydraulic cylinder over the vibrating sprung mass [10].
Results
The 2 DOF model when excited by a bump input (Figure 5) and for an external body force of 100N which constitutes the aerodynamic downforce and vehicle roll over moment force produces a vibration of the sprung mass as shown in the Figure. The bump input excitation is given at 0.25 s from the start of simulation time. The sprung mass has a maximum acceleration of 6 m/s2 in the negative direction and the unsprung mass displaces 0.007 m from the ground. The response of the system decays after 1 seconds.
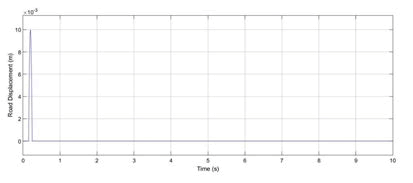
Figure 5:Bump input from the road surface.
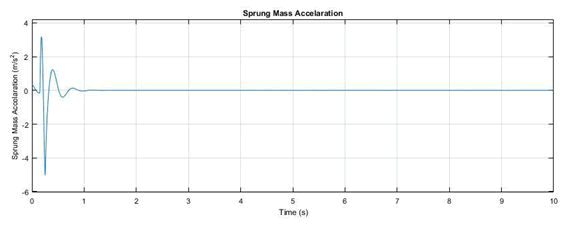
Figure 6:Sprung mass acceleration or ride comfort.
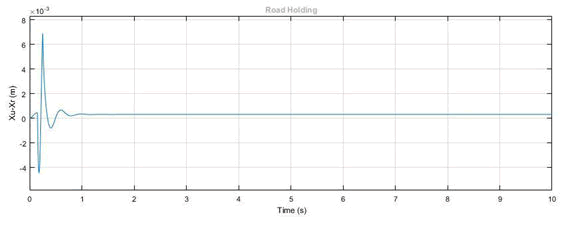
Figure 7:Road holding.
Further increasing the external body force acting on the sprung mass, the peak of sprung mass acceleration is also increasing in the positive direction. However, the road holding characteristics remains almost constant and no changes were observed for increasing the external force. By varying the suspension stiffness and suspension damping coefficient however the sprung mass acceleration characteristics were also varied. By increasing the damping coefficient, the peak of sprung mass acceleration was considerably decreased and by increasing the suspension stiffness the frequency of the sprung mass vibration was varied. The mass of the adapter plate must be necessarily minimized for easy handling such as to facilitate easy change of suspension, and for other maintenance purposes. The sprung mass that is to be simulated by the test rig is realized by a series of circular discs with a concentric hole at the center having a mass of about 15 kg that is added one by one to the adapter plate on its rear side on the cantilever beam provided. The total sprung mass that can be simulated on the test rig varies between 200 kg and 300 kg. This is realized by the mass of the adapter plate and the mass of the circular discs attached on to the adapter plate. The adapter plate was analysed in ANSYS Workbench for structural strength and the results are as shown in Figure 8.
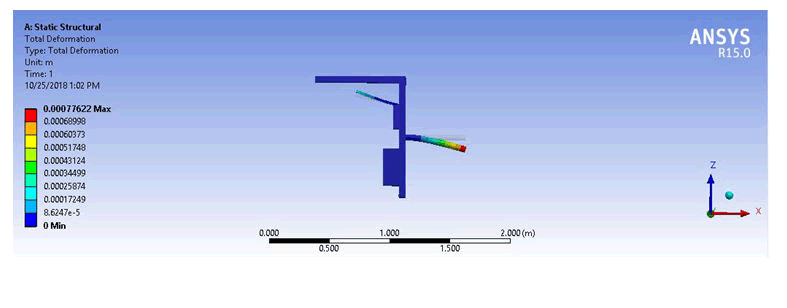
Figure 8: Deformation of adapter plate is shown in this figure in exaggerated mode and the maximum deformation occurs at the loading point of the sprung mass which is used to adjust the sprung mass values to suit different loading conditions.
Conclusion
The test rig developed can test the quarter car model. The hardware designed is capable of testing McPherson strut suspension system. With special attachments on the adapter plate the test rig can test other types of suspension systems as well. The designed test rig can be used to study the suspension system behavior and determine the measure of ride comfort and road holding capabilities of the suspension system under test. The test rig is expected to be operated in fully automatic mode with a suitable controller.
References
- Kumar MS, Vijayarangan S (2007) Analytical and experimental studies on active suspension system of light passenger vehicle to improve ride comfort. Mechanics 65: 34-41.
- Ashtekar JB, Thakur AG (2014) Simulink model of suspension system and it's validation on suspension test rig. Int J Mech Eng Robot Res 3: 811-818.
- Omar M, El-Kassaby MM, Abdelghaffar W (2017) A universal suspension test rig for electrohydraulic active and passive automotive suspension system. Alexandr Eng J 56: 359-370.
- Lauwerys C, Swevers J, Sas P (2005) Robust linear control of an active suspension on a quarter car test-rig. Control Eng Pract 13: 577-586.
- Niresh J, Archana N, Raj GA (2019) Optimisation of linear passive suspension system using MOPSO and design of predictive tool with artificial neural network. Stud Informat Control 28: 105-110.
- Olma S, Kohlstedt A, Traphoner P, Jaker KP, Trachtler A (2016) Substructuring and control strategies for hardware-in-the-loop simulations of multiaxial suspension test rigs. IFAC-Papers OnLine 49: 141-148.
- Heidrich L, Shyrokau B, Savitski D, Ivanov V, Augsburg K, et al. (2013) Hardware-in-the-loop test rig for integrated vehicle control systems. IFAC Proceed Vol 46: 683-688.
- Mitra AC, Soni T, Kiranchand GR, Khan S, Banerjee N (2015) Experimental design and optimization of vehicle suspension system. Materials Today: Proceed 2: 2453-2462.
- Mitra AC, Kiranchand GR, Soni T, Banerjee N (2016) Design of experiments for optimization of automotive suspension system using quarter car test rig. Proced Eng 144: 1102-1109.
- Olma S, Traphoner P, Kohlstedt A, Jaker KP, Trachtler A (2016) Model-based method for the accuracy analysis of Hardware-in-the-Loop test rigs for mechatronic vehicle axles. Proced Technol 26: 105-112.
 Spanish
  Chinese
  Russian
  German
  French
  Japanese
  Portuguese
  Hindi
Hindi 