Spanish
  Chinese
  Russian
  German
  French
  Japanese
  Portuguese
  Hindi
Hindi Research Article, J Nanomater Mol Nanotechnol Vol: 12 Issue: 1
Estimation of Calcium Ion Diffusion Coefficient in Cement Hydrated Silicate Gel (C-S-H) under Different Compressive Stresses by Molecular Dynamics Simulation
Seyedeh Maryam Bozorgirad*, Ali Jahandoust and Amir Tarighat
Department of Civil Engineering, Shahid Rajaee Teacher Training University, Tehran, Iran
*Corresponding Author: Seyedeh Maryam Bozorgirad, Department of Civil Engineering, Shahid Rajaee Teacher Training University, Lavizan, Tehran, Iran, Tel: + 989393516216; E-mail: maryambozorgirad124@yahoo.com
Received date: 25 July, 2022, Manuscript No. JNMN-22-70230; Editor assigned date: 28 July, 2022, PreQC No. JNMN-22-70230 (PQ); Reviewed date: 11 August, 2022, QC No. JNMN-22-70230; Revised date: O4 October, 2022, Manuscript No. JNMN-22-70230 (R); Published date: 11 October, 2022, DOI: 10.4172/2324-8777.1000347
Citation: Bozorgirad SM, Jahandoust A, Tarighat A (2022) Estimation of Calcium Ion Diffusion Coefficient in Cement Hydrated Silicate Gel (C-S-H) under Different Compressive Stresses by Molecular Dynamics Simulation. J Nanomater Mol Nanotechnol 11:7.
Abstract
The transfer of water and ions in the hydrate of cement determines the durability of cementitious materials. Due to its structural similarity, tobermorite which is an important mineral analog of the main phase of cement hydrate was used to investigate the transfer behavior at the molecular level. In this study, the diffusion coefficient of calcium ions in hydrated cement paste was investigated by the Molecular Dynamics (MD) simulation method. There are pores with a width of 59.82 A° between two substrates made of tobermorite crystals. The thickness of the tobermorite layer on each side was considered to be 27.98 A°. Initially, no ions were added to the two layer structure of tobermorite and modeled water between the two layers, but after obtaining the results in another step to bond calcium ion and chloride ion and evaluate the diffusion process, 24 chloride ions were randomly added to the tobermorite structure on both sides. For this modeling, BIOVIA materials studio 2017 software was used to perform MD simulations.
Keywords: MD simulation, Tobermorite, Diffusion coefficient, C-S-H
Introduction
The most essential product in cement paste which has a great effect on its mechanical properties is C-S-H gel. The properties of hardened cement paste depend to a large extent on the structure of C-S-H gel, which is relatively high in cement paste [1]. Therefore, it is necessary to study the structure of C-S-H. Despite the importance of C-S-H and its role in determining the properties of cement hydration products, its structure is still not fully understood and relevant experimental and theoretical studies are being conducted in this regard. Existing literature have focused on the study of minerals with similar C-S-H structures. In terms of crystal structure, Tobermorite 14 A°, Tobermorite 11 A° and Jennite are very similar to C-S-H gel.
The release of water and ions in the C-S-H gel affects the properties such as strength, creep, shrinkage and chemical and physical reactions of cementitious materials. On the one hand, environmental changes such as temperature, humidity and load can change the amount of water in the C-S-H gel and on the other hand, the interaction between water and C-S-H gel can significantly affect the adhesion force [2].
Furthermore, in an aggressive environment such as seawater, chlorine ions can penetrate the cement paste and lead to reinforcement corrosion and have destructive effects on the durability of the structure [3,4]. To interpret the diffusion mechanism at different longitudinal scales, it is necessary to investigate the origin of the properties at the molecular level. The properties of water trapped in gel pores or the vicinity of the C-S-H surface have been studied by various experimental techniques.
Using 1H Nuclear Magnetic Resonance (NMR), the water in C-S-H gels was distinguished into three types including chemically confined water incorporated into the structure and form a strong chemical with a calcium silicate structure, physically confined water that is deep near the surface and capillary water that is absorbed unbound and freely released into the capillary pores [5,6]. In addition, different types of water can be identified numerically using the Quasi-Elastic Neutron Scattering (QENS) method [7]. Nowadays, a Proton Field Cycle Calorimetric (PFCR) approach has been developed to investigate the dynamic properties of water molecules attached to the C-S-H surface [8]. It is massive (0.4 1010 m2/s). In addition, due to the interaction between ions and the C-S-H surface, 35 Cl NMR relaxation methods and a two-site exchange model have been proposed to study the structural and dynamic properties at the molecular scale at the chloride bond molecular scale at C-S-H [9].
Inorganic analogs are in contact with aqueous chloride solutions. The low binding fraction of chloride ions on the surface means poor bonding capacity of chlorine ions at the C-S-H level.
Materials and Methods
Calcium silicate hydrates are the main binding phase in hardened cement paste. However, after a few decades of studying the exact compositional and microstructural nature of C-S-H, it is still unclear. One of the main solutions to this problem is that the formation of phase C-S-H is generally influenced by many factors such as cement composition, water to cement ratio (W⁄C), degree of hydration and sintering temperature. These influencing factors can accumulate and lead to dramatic changes in phase composition, nanostructure and morphology. For this reason, basic research into the chemistry of C-S-H usually begins with pure compounds. Bernal found that C-S-H formed in hydrated C3S pastes was much more amorphous than C-S-H (I) and C-S-H (II) prepared in dilute suspensions with low and high Ca/ Si ratios. C-S-H (I) has a fibrous structure and resembles tobermorite, a rare crystalline C-S-H with a chemically defined structure Ca5Si6O16 (OH)2.4-H2O with a Ca/Si ratio of 0.83. The tobermorite contains "dreierketten" linear silicate chains in which the quadrilateral aligns its silicate with Ca(2+) ions in a twisted pattern for all three quadrilaterals based on a comparison of C-S-H mineral suggested that the ratio Ca/Si could reach above 0.83 [10]. However, tobermorite, with its structural similarity to C-S-H (I), has been used mainly as a basic structure for modeling C-S-H phases of hydrated cement [11].
Starting with dreierketten silicate chains as observed in tobermorite, various models have subsequently been proposed for C-S-H.
Depending on the approaches adopted, these models are divided into two general groups to increase the Ca/Si ratio to the amount that is observed experimentally in ordinary cement paste, namely 1.7-1.8.
The first group of C-S-H models, also known as T⁄CHmodels, consists of basal tobermorite structures with calcium hydroxide layers. The second group of models, known as T/J models, includes the main structure of the Jennite with tobermorite [12]. Also based on dreierketten silicate chains, Jennite is a crystalline C-S-H that has the basic formula Ca9Si6O18 (OH)68H2O and a Ca/Si ratio of 1.5.
Compared to tobermorite, the Jennite has a higher Ca/Si ratio (1.5) and the central Ca–O portion is striped. Starting from the T/CH and T/J perspectives, more comprehensive models have recently been developed to describe the C-S-H phase of hydrated cement [13].
Richardson and Groves proposed a model that starts with the general form of calcium silicate hydrate, consisting of isolated silicate chains of different lengths and with a variable number of hydroxyl groups attached to Si atoms. Taking into account the value of the variable Ca(OH)2, this model incorporates both the T/CH and T/J perspectives and shows the applicability for interpreting a wider range of experimental results. Other C-S-H models based on T/CH and/or T/J are consistent with those of Richardson and Groves [14,15].
C-S-H gels are usually modeled on crystalline minerals [16-20].
The structure of tobermorite is a monoclinic network in four infrastructures: 9-angstrom tobermorite (riverside) with chemical formula, clinotobermorite, 11-angstrom tobermorite and 14-angstrom tobermorite (plumberite).
Numbers next to different tobermorite crystals indicate the base distance between two adjacent layers. Different basal intervals, which correspond to the degrees of tobermorite phases, may be classified based on their hydration. Riverside, more commonly called 9- angstrom tobermorite, has the chemical formula Ca5Si6O16(OH)2.
Tobermorite 11-angstrom is more hydrated, with a chemical composition of Ca5Si6O175H2 to Ca4Si6O15(OH)25H2O; Finally, 14- angstrom tobermorite, also known as Plombierite, is the most hydrated phase of the group with this chemical formula: Ca5Si6O16 (OH)27H2O. These three different phases are characterized by basal distances of 9.3, 11.3 and 14 angstroms, respectively.
For this study, 14 angstrom tobermorite has been selected because in previous research conducted by Banakarsi in which different types of tobermorite were modeled, tobermorite 14 angstrom was more hydrated than other types of tobermorite and the results obtained from simulation of 14 angstrom tobermorite are more closely related to laboratory results than other types.
Molecular dynamics method
In this study, the molecular dynamics method is chosen to perform the simulation. The basics of molecular dynamics analysis are that each of the three MD simulations has two main components including the potential function component for determining the intersection forces between atoms/ions and the classical mechanics component for calculating instantaneous acceleration and velocity. Atoms/ions are used to calculate the path and update the potential between atoms/ions using an integration algorithm. In addition, each model has a statistical mechanical component for calculating macroscopically observable thermodynamic observations so that MD simulations can be performed under a controlled thermodynamic condition. The potential function and classical mechanics components used in this study for modeling chloride transfer in C-S-H are given below.
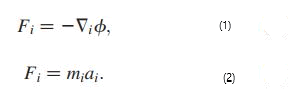
Classic mechanics: In MD analysis, the interaction forces between atoms/ions were determined using the Coulomb and Leonard-Jones potential combination function according to equation, while the acceleration of separate organisms according to Newton's second law as presented in equation has been determined [21]. Equation [11] is where Fi is the force exerted on atom i, mi is the mass of particle i and ai is the acceleration of atom i.
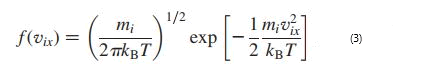
To calculate the path of atoms/ions, the initial positions and initial velocities of atoms/ions are needed. The initial positions of the atoms/ ions in this study were determined based on the density of each substance in the thermodynamic state determined by the simulation, while the initial velocities were randomly selected using the Maxwell- Boltzmann distribution according to equation (3) which determines the probability that atom i has velocity vix in the x direction at a given temperature T. In relation, f (vix) represents the probability density function, mi is the atomic mass of atom i and kB is the Boltzmann constant.
Mean Square Displacement (MSD)
MSD can be obtained directly from the particle position in an MD simulation, as shown in Equation.
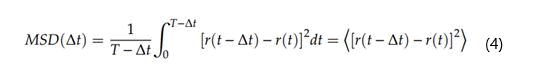
Where,
T is the total simulation time,
r (t) is the position at time t,
r (t+Dt) is the position of an interval and
Dt is the dimension.
[r(t+Dt)-r(t)]2 is the displacement of the particle squared along with that interval.
If the particle is propagated, the MSD becomes linear in time and determines the slope of the diffusion coefficient Da, as shown in equation.
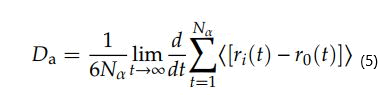
Where D is the diffusion coefficient and N is the number of diffusion atoms in the system [22,23]. The linear y=ax+b was obtained by the linear region of the MSD curves. The term differential in the above equation can be replaced by the ratio of MSD curves, which is the slope of time-dependent MSD curves. Since the value of MSD is divided by the number of diffusion atoms, the formula is simplified as follows:
Computational details
According to previous researchers including Banakarsi a 14 A° tobermorite unit cell has been selected for modeling. The modeling details are shown in Figure 1. As shown in Figure 1, there are pores with a width of 59.82 A° between two substrates made of Tobermorite crystals. Each of the two substrates was created by 1 × 2 × 1 tobermorite 14 A°cells that were placed side to side. According to the study done by Mindes modeling a specific size for nanopores that is larger than 5 A° and smaller than 100 A°, the modeled nanopores can be considered as a gel pore. Additionally, according to the study done by Mindes, the size of the nanopore should be less than 10 nm to properly study the diffusion of chloride ions in cement hydrates. The thickness of the tobermorite layer on each side was considered to be 27.98 A°. After testing different sizes, this size was selected by trial and error to achieve an answer with the least error. To evaluate the diffusion process, an aqueous solution must be modeled in the pores.
According to the study done by Hu the density of this aqueous solution should be considered around 1 gr⁄cm3 in order to meet environmental conditions [24]. To achieve this goal, 200 molecules of water in the super cell were simulated for the middle layer between the two layers of tobermorite. After several stages of trial and error, this number of water molecules was selected by the authors of the article for simulation to reach the optimal box. Initially, no ions were added to the two-layer structure of tobermorite and modeled water between the two layers, but after obtaining the results in another step to bond calcium ion and chloride ion and evaluate the diffusion process, 24 chloride ions were randomly added to each structure of tobermorite.
So, two sides were added. The reason for the addition of chloride ions was that the authors of this article speculated that the negative charge of chloride ions could release some of the calcium ions from being trapped by sodium ions and make the movement and release of calcium ions easier.

Figure 1: The structure of the C-S-H model is shown by a tobermorite 14 A°angstrom in perspective (a) and (b) lateral view. (C) Intralayer calcium bonding geometries, interlayer calcium and bridging geometry. The atoms O, H, Si and Ca are represented by red, white, blue and light blue spheres using the ball and stick model. The length of the selective bond and the dimensions of the unit cell are shown where d1=2.57 Å 57 Å, d2=2.38 Å 38 Å, d3=2.42 Å 42 Å, d4=2.30 Å 30 Å, d5=2.45 Å 45 Å, d5=2.45 Å 45 Å, d6=Å 45 Å 45 Å, d6=Å 6 Å 45 Å, d6=Å 6 Å 45 Å, d6=Å 6 Å 45 Å, d6=Å 6Å 6Å 6Å 6Å 6Å 6Å 6Å 6Å, b=7.36 Å 36 Å, 2c=28.01 Å 01 Å
For this modeling, BIOVIA materials studio 2017 software was used to perform MD simulations. The force field used was the force field of the campus. Condensed phase Optimized Molecular Potentials for Atomistic Simulation Studies (COMPASS) whose force parameters are mainly derived from initial calculations were applied to each simulation of this study. It is very important to describe the forces and potentials between the atoms of a molecule or a group of molecules with a set of functions and parameters in molecular dynamics. Additionally, previous researches have used this force field in the simulation of cement-based materials as well as hydrated cement paste and obtained good and logical results and this force field was also used in this study [25-27].
COMPASS force field (Condensed phase Optimized Molecular Potentials for Atomistic Simulation Studies) is used to describe the hydration of cement, aqueous solution and various ions. Due to its good ability to simulate the potential between different atoms in aluminosilicates, it can be used in the simulation of running cement hydrate(s) [28]. Here, the potential of Lennard-Johns 9-6 (LJ 9-6) shows the van der Waals interaction. According to previous studies, this potential has a good ability in simulating the potential between different atoms in hydrated cement. After several trials and errors, the best values for cut-off distance, spline width and buffer width were obtained at 12.5, 1 and 0.5 A°, respectively and these values were considered in the simulation. To reduce the simulation error, as in the previous studies of researchers, when each simulation was repeated several times, each simulation was repeated five times (Figure 2).

Figure 2: Simulation model and finite water in Nano-cavities between tobermorite substrates. Silicate chains are in red/yellow lines (silicon in yellow and oxygen in red), water molecules in white/red lines (hydrogen in white and oxygen in red) and calcium atoms in green balls.
The Ca/Si ratio is assumed to be one. Supercell with dimensions c=115.794 A° b=14.85 A° a=6.73 A° and with angles, α=β=γ, and the total number of atoms in the simulation box 2096 is the number of atoms (Figure 3).

Figure 3: Simulation model and finite water in the nano-cavity between the tobermorite substrates, 24 chlorine ions are randomly added to the tobermorite layers on each side. Silicate chains in red/ yellow lines (silicon in yellow and oxygen in red), water molecules in white/red lines (hydrogen in white and oxygen in red), chlorine atoms in silver balls and calcium atoms in green balls.
The simulation time step was initially selected as 1 fs, 10 fs and 100 fs, but after viewing the temperature and energy balance diagrams, the best simulation time step of 1 fs was selected so that the temperature and energy balance could be as good as possible. There is a thermostat that exchanges energy for exothermic processes. The thermostat used is the velocity scale thermostat and the barostat used is Souza-Martins.
The simulation was performed at a temperature of 300 K. During the simulation process, the thermodynamic properties of the system such as pressure, temperature and total energy were carefully investigated. The simulation process goes through the following steps:
First, to minimize the energy of the system, to save time in the simulation and to prepare the system for the simulation operation, the whole structure must be frozen and the energy of the whole system must be minimized, because otherwise the simulation time may be multiplied so that first the whole structure is frozen and the whole system energy is reduced to the minimum and then the whole system is relaxed. It was subjected to NVT ensemble at T=300 K. After several trials and errors of different values to balance the thermodynamic properties, a duration equal to 3000 ps was selected for simulation time, which is the optimal and sufficient time to balance all the thermodynamic properties of the system. The equilibrium sample from the previous step was then subjected to the following compressive stresses using the NPT ensemble at P=1 atm and T=300 K for 2000 ps.
The sample was constrained in directions a and b and subjected to compressive stress in direction c, so that the compressive stress started from 0 MPa and increased by 2 MPa in each stage under compressive stresses of 2, 4, 6, 8 and 10 MPa.
Among all the methods adopted in calculating the calcium ion diffusion coefficient, due to its simplicity, low computational costs and statistical reliability, here the MSD method, which stands for Mean Squared Displacement, was used for ion analysis and molecule transfer. Water is used. This method uses particle displacement data in the calculation.
Albert Einstein first discovered the mathematical description of Brownian motion in 1905, in which he found the relationship between the diffusion coefficient of particles with a microscopically observable size in a liquid and their mean square displacement was inspired by the molecular motions of heat. It should be noted that the results obtained from this method are guaranteed when the simulation converges. Simulation convergence can be found by plotting the loglog
diagram for MSD versus the time step. When this graph is linear, the results will be reliable [29]. In the graph for MSD versus time step, when the displacement between atomic positions at time intervals is calculated as t and all possible points are considered, each time step value (t) corresponds to the value of MSD. As the time source, if t and N are the time intervals between two consecutive data sets and the number of data sets, the time step values for calculating MSD can be selected from t to N. Due to numerical problems, only a part of the time step values (t to N/2) can be applied to calculate the MSD to find the diffusion coefficient. Other time phase values (N/2 to N) have very little time source for calculating MSD. As a result, the output is not valuable. Thus, the slope of the trend line in the first half of the MSD diagram is opposite to the 2 dD time step, where d and D are the system dimensions and diffusion coefficient, respectively. This method must be repeated for each particle in the model to calculate the diffusion coefficients of ions and water molecules at a specific temperature.
Results
In this study, the diffusion coefficients of calcium ions are obtained using MSD diagrams. The MSD diagrams for loads from zero to ten MPa are as follows. To be more sure, each operation was performed three times and averaging was performed. Graphs include MSD diagrams on the vertical axis in angstrom squares and the horizontal axis in time in femtoseconds. As can be seen in the diagrams, in almost all diagrams in the first thousand femtoseconds the diagram is almost linear (Figures 4-10).

Figure 4: MSD diagram related to 0 MPa.

Figure 5: MSD diagram related to 2 MPa.

Figure 6: MSD diagram related to 4 MPa.

Figure 7: MSD diagram related to 6 MPa.

Figure 8: MSD diagram related to 8 MPa.

Figure 9: MSD diagram related to 10 MPa.

Figure 10: Average of MSD diagrams in one graph.
As explained in the displacement mean square section, the calculation of the emission coefficient of an ion based on the MSD diagram of that ion is equal to one-sixth of the slope of the linear part of its MSD diagram.
The diffusion coefficients obtained from the MSD diagrams for different loads are given in Table 1. Note that to reduce the computational error, the simulation was repeated three times for each compressive stress, so in the table below, for example, for compressive stress of 2 MPa, there are three numbers for three simulations with the same conditions, plus one as the numerical mean of these three numbers. And another number is given as the average of the curves for these three numbers, so for each compressive force, there are five numbers in the table below. The average diffusion coefficients of calcium ions are plotted in Figures 11-13.
Table 1: Calcium ion diffusion coefficients obtained for zero loads of 10 MPa.

Figure 11: Mean diffusion coefficients of calcium ions for 0 to 10 MPa before the addition of chloride ions.

Figure 12: Mean diffusion coefficients of calcium ions for 0 TO 10 MPa after the addition of chloride ions.

Figure 13: Comparison of average calcium ion diffusion coefficients for 0 to 10 MPa for normal and modified modes.
Interpretation
In this study, using the molecular dynamics simulation method, the phenomenon of calcium ion diffusion in hydrated cement paste at the nanoscale has been investigated, which is a new and different approach to the diffusion problem. For this purpose, 14 angstrom tobermorite has been simulated in the materials studio software. By setting the initial assumptions, the dimensions of the sample are selected appropriately to achieve acceptable results with the least computational cost. So the results obtained in this study are more accurate than the results of the previous studies. The present study on the diffusion coefficient of calcium ions in hydrated cement paste is quite new and based on the previous researches; very few researches were conducted in this field at the nanoscale. In the following, the results obtained in this research are stated first and at the end, suggestions for future work in this field are presented.
MSD diagrams for calcium ions are plotted under different charges and then diffusion coefficients for calcium ions are calculated. Several chloride ions have been added to the structure to change the attraction and repulsion of calcium ions with other ions. According to the following figures, it can be seen that the addition of chloride ions has a positive effect on the release of calcium ions (Tables 2-4). The addition of chloride ions has been able to release some of the calcium ions that were gravitationally trapped by sodium ions, making them easier and freer to move, thus allowing them to diffuse more easily. In this way, the addition of chloride ions has been able to help calcium ions to diffuse more easily and play a positive role in this regard (Figures 14 and 15).

Figure 14: Simulation box (modified state) before the release of calcium ions.

Figure 15: Simulation box (modified state) after the release of calcium ions.
Table 2: Calcium ion diffusion coefficient in previous studies.
Table 3: Calcium ion diffusion coefficient in this study before adding chloride ions.
Table 4: Calcium ion diffusion coefficient in this study after the addition of chloride ions.
Discussion
As can be seen from the table above, the results obtained for the calcium ion diffusion coefficient are consistent with previous studies and this means that the molecular dynamics simulation method for obtaining the calcium ion diffusion coefficient in the C-S-H gel is efficient. In the following part, the results obtained in this research are expressed first and at the end, suggestions for future work in this field are presented. The molecular dynamics method has been a suitable and efficient method for calculating the ion diffusion coefficient. The results obtained from this method were consistent with the results obtained in previous studies. Due to the high accuracy of this method and the possibility of trial and error and testing this method several times in a computer simulation environment, this method can be used as a reasonable method for calculating the ion diffusion coefficient in hydrated cement paste. According to the results of the force field used in this research, the force field (COMPASS) is a suitable force field for simulating hydrated cement paste and it models the relationships between atoms and ions and monitors the interaction between them.
Conclusion
The diffusion coefficient of calcium ions in the modified state, i.e. after the addition of chloride ions, is higher than the normal state, before the addition of chloride ions. The reason for the increase in the diffusion coefficient of calcium ions in the modified state can be attributed to the negative electric charge of chloride ions. The negative charge of chloride ions can cause calcium cations to move and to some extent free them from being trapped by sodium ions. Also, after adding chloride ions, with increasing pressure, a decrease in the diffusion coefficient of calcium ions is seen, which is a logical trend because previous studies have demonstrated that with increasing pressure, the diffusion coefficient decreases. The results of the diffusion coefficient in the model made of Tobermorite 14 A° are closer to the laboratory values. As a result, the Tobermorite model of 14 A° is more suitable for simulating the diffusion of calcium ions by molecular dynamics. Because the subject of this study is new in the technical literature, there are many areas for further researches, which can be mentioned as follows; considering that in this study the values of diffusion coefficient for calcium ions in the structure of hydrated cement paste have been obtained, in the continuation of this study, the electrical conductivity of hydrated cement paste can also be obtained and there can be a research on the piezoelectric properties of hydrated cement paste. These further researches can be done in the continuation of this research.
References
- Pellenq RJ, Kushima A, Shahsavari R, Van Vliet KJ, Buehler MJ, et al. (2009) A realistic molecular model of cement hydrates. Proc Natl Acad Sci USA 106:16102-16107.
[Crossref] [Googlescholar] [Indexed]
- Hou D, Ma H, Zhu Y, Li Z (2014) Calcium silicate hydrate from dry to saturated state: Structure, dynamics and mechanical properties. Acta Materialia, 2014. 67:81-94.
- Hou D, Li Z (2014) Molecular dynamics study of water and ions transported during the nanopore calcium silicate phase: Case study of jennite. J Mater Civ Eng 26:930-940.
- Ma H, Li Z (2013) Realistic pore structure of Portland cement paste: Experimental study and numerical simulation. Comput Concr 11:317-336.
- Taylor H, Howison J (1956) Relationships between calcium silicates and clay minerals. Clay Miner Bull 1956. 3:98-111.
- Bernal J, Jeffery J, Taylor J (1952) Crystallographic research on the hydration of Portland cement. A first report on investigations in progress. Mag Concr Res 4:49-54.
- Bordallo HN, Aldridge LP, Desmedt A (2006) Water dynamics in hardened ordinary portland cement paste or concrete: from quasielastic neutron scattering. J Phys Chem B 110:17966-17976.
- Korb JP, Monteilhet L, McDonald PJ, Mitchell J (2007) Microstructure and texture of hydrated cement-based materials: A proton field cycling relaxometry approach. Cem Concr Res 37:295-302.
- Chen JJ, Thomas JJ, Taylor HF, Jennings HM (2004) Solubility and structure of calcium silicate hydrate. Cem Concr Res 34:1499-1519.
- Megaw HD, Kelsey C (1956) Crystal structure of tobermorite. Nature 177:390-391.
- Pan T, Xia K, Wang L (2010) Chloride binding to Calcium Silicate Hydrates (CSH) in cement paste: A molecular dynamics analysis. Int J Pavement Eng 11:367-379.
- Taylor HF (1986) Proposed structure for calcium silicate hydrate gel. J Am Ceram Soc 6:464-467.
- Richardson I, Groves G (1992) Models for the composition and structure of Calcium Silicate Hydrate (C-S-H) gel in hardened tricalcium silicate pastes. Cem Concr Res 22:1001-1010.
- Kirkpatrick RJ, Yarger JL, McMillan PF, Ping Y, Cong X (1997) Raman spectroscopy of CSH, tobermorite and jennite. Adv Cem Based Mater 5:93-99.
- Cong X, Kirkpatrick RJ (1996) 29Si MAS NMR study of the structure of calcium silicate hydrate. Adv Cem Based Mater 3:144-156.
- Murray SJ, Subramani VJ, Selvam RP, Hall KD (2010) Molecular dynamics to understand the mechanical behavior of cement paste. Transp Res Rec 2142:75-82.
- Shahsavari R, Pellenq RJM, Ulm FJ (2011) Empirical force fields for complex hydrated calcio-silicate layered materials. Phys Chem Phys 13:1002-1011.
[Crossref][Googlescholar] [Indexed]
- Qomi MJA, Krakowiak KJ, Bauchy M, Stewart KL, Shahsavari R, et al. (2014) Combinatorial molecular optimization of cement hydrates. Nat Commun 5:1-10.
- Hou D, Zhu Y, Lu Y, Li Z (2014 Mechanical properties of Calcium Silicate Hydrate (C–S–H) at nano-scale: A molecular dynamics study. Mater Chem Phys 146:503-511.
- Glasser LD, Lachowski EE, Mohan K, Taylor HF (1978) A multi-method study of C3S hydration. Cem Concr Res 8:733-739.
- Cao Q, Xu Y, Fang J, Song Y, Wang Y, et al. (2020) Influence of pore size and fatigue loading on NaCl transport properties in CSH nanopores: A molecular dynamics simulation. Mater 13:700.
- Ni F, Wang G, Zhao H (2017) Molecular and condition parameters dependent diffusion coefficient of water in poly (vinyl alcohol): A molecular dynamics simulation study. Colloid Polym Sci 295:859-868.
- Hou D, Li Z (2014) Molecular dynamics study of water and ions transport in nano-pore of layered structure: A case study of tobermorite. Microporous Mesoporous Mater 195:9-20.
- Zehtab B, Tarighat A (2018) Molecular dynamics simulation to assess the effect of temperature on diffusion coefficients of different ions and water molecules in CSH. Mech Time-Depend Mater 22:483-497.
- Tarighat A, Zehtab B (2016) Structural reliability of reinforced concrete beams/columns under simultaneous static loads and steel reinforcement corrosion. Arab J Sci Eng 41:3945-3958.
- Tarighat A, Zehtab B, Tavakoli D (2016) An introductory review of simulation methods for the structure of cementitious material hydrates at different length scales. Pertanika J Sci Technol 24:27-39.
- Al-Ostaz A, Wu W, Cheng AD, Song CR (2010) A molecular dynamics and microporomechanics study on the mechanical properties of major constituents of hydrated cement. Composit Part B: Eng 2010. 41:543-549.
- Yang JZ, Liu QL, Wang HT (2007) Analyzing adsorption and diffusion behaviors of ethanol/water through silicalite membranes by molecular simulation. J Membr Sci 2007. 291:1-9.
- Amrani ES, Kolb M (1993) Molecular dynamics simulations in zeolites: From deterministic to random motion. J Chem Phys 98:1509-1513.