 Spanish
  Chinese
  Russian
  German
  French
  Japanese
  Portuguese
  Hindi
Hindi Research Article, Geoinfor Geostat An Overview Vol: 5 Issue: 2
Fugitive Methane and the Role of Atmospheric Half-Life
Richard A Muller1* and Elizabeth A Muller2
1Berkeley Earth and University of California at Berkeley, USA
*Corresponding Author : Richard A Muller
Berkeley Earth and University of California
2831 Garber St., Berkeley CA 94705, USA
Tel: 510 735 6877
E-mail: rich@berkeleyearth.org
Received: April 20, 2017 Accepted: May 16, 2017 Published: May 22, 2017
Citation: Muller RA, Muller EA (2017) Fugitive Methane and the Role of Atmospheric Half-Life. Geoinfor Geostat: An Overview 5:3. doi: 10.4172/2327-4581.1000162
Abstract
Because methane has an initial GWP (global warming potential) 120x that of carbon dioxide, concern about leaked “fugitive” methane often dominates discussions of natural gas policy. But this high GWP can easily be misinterpreted to conclude that natural gas is a much greater greenhouse danger when used for electric power generation vs. coal. In determining policy, particularly with regard to legacy issues (global warming for future generations) it is essential to take full account of the short 8.6-year lifetime of methane in the atmosphere. Moreover, the Intergovernmental Panel on Climate Change use of time “horizon” must be understood properly; it refers to an average from the present, not a time that lies in the future. The IPCC GWP value cannot be used directly to estimate the effect unless careful account is taken of the lighter weight of the methane molecule compared to that of carbon dioxide. We discusses severalways to take these issues into account, and show that for a wide range of leakages and legacy goals, fugitive methane is typically not a critical issue, and that even with a few percent leakage, natural gas is preferable to coal for legacy global warming considerations.
Keywords: Global warming; Natural gas; IPCC; Hydraulic fracturing, Fracking, Legacy effect, Global warming potential, Methane, Fugitive methane
Abbreviations
IPCC: The Intergovernmental Panel on Climate Change; GWP: Global warming potential; AGWP: Absolute Global Warming Potential
Introduction
When it leaks into the atmosphere, methane has a “Global Warming Potential” or GWP of 120 [1]. That means it is 120 times as potent in causing greenhouse warming as is an equal mass of carbon dioxide. About 70% of atmospheric methane currently comes from anthropogenic sources (farming, ranching, landfills and fuel), but the rapid growth of shale gas exploitation suggests a new danger: fugitive methane, meaning methane that leaks from the wells, the processing, the delivery and the use of natural gas.
The high GWP value of 120 has led to the fear that leakage of methane is such a severe problem that we should avoid building new natural gas based power plants. An analysis by Alvarez et al. [2] argued that that the maximum allowed leakage from methane use should be 3.2%; higher leakage would negate any advantage over coal. Observations reported by Karion et al. [3] of atmospheric concentrations above some drilling sites indicate that methane leakage can be far higher than this number; their results ranged from 6.2% to 11.7%. These results suggest that substitution of natural gas for coal could, in principle, lead to more rapid greenhouse warming, and led some organizations to oppose a shift from coal to natural gas.
In this paper, our goal is to elucidate the relative threats to global warming from coal and natural gas use in the generation of electric power. We transform the IPCC global warming potential, based on equal weights of CH4 and CO2, into one based on the assumption that the goal of consuming the two fuels is to produce equivalent electric power. This approach was previously used by Cathles et al. [4] and by Busch and Gimon [5] who calculate the value of substitution of natural gas for coal plants for several scenarios. In this paper we focus on a particular scenario, in which a modern combined cycle natural gas replaces today’s average coal plants. Busch and Gimon report their results in terms of the average effects over the standard periods used by the IPCC: 0-20 years and 0-100 years. In our work we add to these results by discussing the effects at 20 and 100 years. This is important since the half-life of CH4 in the atmosphere is so short, 8.6 years, that most of the contribution to warming occurs in the first few years of the average time interval. It turns out, for example, that 3/4 of the 0-100 year average warming occurs only in the first 17.2 years, and then fades; there is very little global warming legacy effect remaining at 100 years, that is, 100 years after the pulse has been emitted.
Part of the reason for confusion among policy makers is that the IPCC typically refers to the average GWP for 0 to 20 years (or 0 to 100 years) as the Global Warming Potential with a 20 (or 100) year horizon, designated as GWP20 or GWP100. Missing is any reminder that the value is an average, from the present to the horizon, with most of the effect (especially for the 100 year value) taking place in the initial part of the time span.
To keep our results simple and transparent, and to illustrate the key roles played by atmospheric lifetime, we confine our analysis to a single but plausible and important model: replacement of today’s average coal electric power plants with modern combined cycle natural gas plants. To keep the analysis clear, we also purposefully ignore some small effects, such as the emission of methane during coal mining, and the fact that most natural gas is not pure methane. The hydrocarbon content of coal is taken into account by our use of the CO2 production ratios of Hayhoe et al. [6]. The calculations we present can be readily duplicated on a spreadsheet; they don’t require large computer simulations and computations.
Atmospheric Lifetime
In their analysis, Alvarez et al. [2] emphasized that their 3.2% limit was for immediate effect only, and did not take into account the short lifetime of methane in the atmosphere. In this paper, we emphasize the important effect that the short lifetime. Methane is removed from the atmosphere by chemical reactions, primarily with the hydroxyl radical and by chemical reactivity with soil. The net effect is an exponential rate of reduction with a half-life of 8.6 years [7]. The contrast with carbon dioxide is important. For CO2, the primary mechanisms for removal from the atmosphere involve absorption into the oceans and biomass. A relatively simple formula for the decay for the period 0 to 1000 years was published by the IPCC 2007 [8] based on a revised version of the Bern Carbon Cycle Model [9]. This equation gives CO2(t), the fraction of carbon dioxide remaining in the atmosphere at a time t after its injection, as
 (1)
(1)
In Figure 1 we plot this equation for carbon dioxide, along with the exponential decay for methane, and also the ratio of the two. There are several features to note. The peak at early times (ratio above 1 for the first 3.3 years) represents the feature of Equation (1) that the initial decline of carbon dioxide exceeds that of methane. Note also that the CO2, despite its initial steep decline, has long time persistence. In Equation (1) this is represented by the constant term, reflecting the result from models that show that even after a thousand years, over 20% of emitted carbon dioxide remains in the atmosphere. This long persistence of the carbon dioxide has given rise to concern over the legacy of current-day burning of fossil fuel; one fifth of the carbon dioxide we produce today remains in the atmosphere and contributes to global warming for the conceivable future.

Figure 1: The persistence of carbon dioxide and methane in the atmosphere as a function of time. The chart begins when a pulse of the gas is injected into the atmosphere. The legacy effect of methane is miniscule compared to that of carbon dioxide.
In contrast, the drop in methane is fast. After 100 years, the fraction of remaining methane has dropped to 0.000009. There is still a long term legacy, not from the methane, but from the CO2 that is produced when methane oxidizes. We’ll include that effect in our estimates of methane’s effect on global warming.
The rapid elimination of methane from the atmosphere appears, at first sight, to be at odds with IPCC statements about the long-term effects of methane. For example, the IPCC (2013) states that averaged over 100 years, the global warming potential of methane is 34 times greater than that of carbon dioxide. Yet there is no true contradiction; the IPCC value of 34 describes the average effect over the period 0 to 100 years. Because of its exponential decay, half of that average effect comes in the first 8.6 years, and 3/4 from the first 17.2 years. At 100 years, the direct effect of the methane on global warming has dropped to a negligible level. This aspect of the short half-life is easily missed when the key numbers reported are averages over extended times; for that reason, in the current paper, in addition to values for averages, we include values for specific times.
The IPCC standard GWP of methane per kilogram is potentially misleading in yet another way. The GWP(t) does not describe the greenhouse warming of methane as a function of time; rather it describes the relative greenhouse warming of methane compared to that of a constantly decreasing level of carbon dioxide. Thus the IPCC average value of 34 for the first 100 years from methane is larger than it would be if we measured the net greenhouse effect of that methane, because it is relative to reducing concentration of CO2. Over 100 years, the average CO2 is 47% of its original value. We’ll discuss this effect in the next section.
Global Warming Potential per Megawatt-hour
The GWP of methane published by the IPCC represents the greenhouse heating caused by a kilogram of methane compared to that of a kilogram of carbon dioxide. But methane is much lighter than carbon dioxide, it produces more heat energy per kilogram, and electric generators for methane are more efficient at turning that heat into electricity. That means that fewer kilograms of methane are used for the same electric energy produced.
First we calculate the CO2 produced by a combined cycle natural gas plant compared to the CO2 produced by an average US/European coal power plant. According to Hayhoe et al. [6] for equal heat energy, burning coal produces on average 1.67 times as much CO2 as does burning natural gas. Combined cycle natural gas plants convert this heat to electricity with 54% efficiency, whereas the average coal plants they are replacing have 33% efficiency. (The natural gas efficiency is sometimes stated as 60%, but that is calculated using the lower heating value. For a fair comparison, we use the higher heating value consistently for both coal and natural gas, and that reduces the efficiency from 60% to 54%.) Thus for equal megawatt-hours of electric energy, a coal plant produces 1.67x54/33 = 2.73 more CO2 than does the natural gas plant.
Let us now calculate what happens when a portion of that CO2 is replaced by leaked unburned methane. The leaked methane weighs less than does the CO2 it replaces, by the ratio of the molecular weights: CO2/CH4 = 44/16 = 2.75. So to apply the GWP per kilogram, we must take into account the fact that the mass of methane that leaks is reduced (compared to CO2 produced in a coal plant) by both the efficiency of electric power generation, a factor of 2.73, and by the fact that the CH4 weighs less than the CO2 it replaces, by a factor of 2.75. Thus, for equal MWh, the leaked CH4 weighs less than the CO2 released from the coal plant by a combined factor of 2.73 x 2.75 = 7.51. We can then calculate the GWP per MWh as the GWP per kg divided by 7.51. Table 1 gives some typical values.
| Global Warming Potential of methane | at 0 yr | 0 to 20 yr average | At 20 yr | 0 to 100 yr average | at 100 yr |
|---|---|---|---|---|---|
| 1. Relative, compared to CO2(t) per kg | 120* | 86* | 45 | 34* | 1.8 |
| 2. Absolute, compared to CO2(0) per kg | 120 | 58 | 25 | 10 | 0.7 |
| 3. Relative, compared to CO2(t) per mole | 44 | 31 | 16 | 12 | 0.7 |
| 4. Relative, compared to CO2(t) per MWh | 16 | 11.5 | 6.0 | 4.5 | 0.2 |
| 5. Absolute, compared to CO2(0) per MWh | 16 | 8.2 | 2.2 | 1.3 | 0.004 |
| 6. Absolute, compared to CO2(0) per BTU | 26 | 13.4 | 3.7 | 2.1 | 0.006 |
Table 1: Global Warming Potential of methane assuming equal weights, equal moles, power plants with equal electric energy produced, and power plants with equal heat energy produced. The conventional definition of GWP (first row) contains the highest numbers, and can lead to a misimpression of the legacy effects of methane. Similarly, columns 2 and 4 can be misleading when they are referred to as the “20 year GWP” and the “100 year GWP” without mention that they are averages, with more than half of the value coming from the first decade. Row 5 indicates the cogent global warming effects for fugitive methane used for electric power production.
Here is another way to look at the perhaps surprising reduction in GWP when calculated per MWh. The GWP of methane per molecule is not 120 but 44, because it weighs less. (Values per mole are given in the 3rd row.) For electricity, since natural gas plants handle only 37% as many carbon atoms for equal electrical energy (they create 37% as much CO2 when fully burned), the initial GWP per MWh is 44 x 37% = 16. If used for heating, we lose the methane combined cycle efficiency advantage, and the natural gas GWP per BTU (or per megajoule) is 16 x 54/33 = 26 at t = 0.
In summary, the high GWP of methane compared to CO2 per kg of was partially an artifact of methane’s light weight, 36% that CO2. Moreover, methane plants handle only 37% as much carbon because of their efficiency (this is the factor 1/2.71). Combine these factors and the GWP per kg of 120 is reduced to a GWP per MWh of 16.
If you are considering replacing coal with natural gas for electric energy, the GWP value at 0 years of 120 is intimidatingly large. It seems to suggest that leakage must be kept well below 1%. The corresponding number for fixed MWh, 16, is large but something that can be handled by keeping leakage in a relatively easy to achieve range. Thus although the numerical analysis can use either value, the perception of danger may be reduced when using the (more relevant) GWP per MWh.
Table 1 includes two important time columns that, to our knowledge, have not been previously published. These are estimates of GWP at 20 years and at 100 years. We calculated these by assuming that the GWP was proportional to atmospheric concentration; this is a reasonable first-order approximation, although not as detailed as done by the full IPCC model. Then we added to the GWP of methane the effects of the CO2 that is produced (and subsequently decays) when methane is destroyed; we estimate that for every kg of such methane, 1.5 kg of is produced. That gave us a GWP for methane vs time. We normalized this curve for the 0 to 20 year average, 86; the value at 20 years was then the final value in this interval. For the 100- year number, we used the IPCC value for the GWP in the 20 to 100 year average, 21, calculated by subtracting the weighted average from 0-20 years (86) from the average 0-100 years (34).
Note that the IPCC numbers have substantial uncertainties; for example, the nominal value 86 is given uncertainty limits by the IPCC (2013) of 84-87 and the 100 year nominal value of 34 is given uncertainty limits of 28-36.
When thinking qualitatively about methane danger compared to coal, it is conceptually more useful not to use the standard GWP numbers (first row) but to think in terms of the GWP per megawatthour of electricity produced, row 4. The column of choice depends on the issue that your policy is designed to address. If you are most interested in the average value over the next 20 years from emissions today, then the most useful global warming potential for leaked methane is 11.5. On the other hand, if you are concerned with relative legacy effects, the global warming that will exist in 100 years due to emissions today, then the relevant global warming potential is 0.24. In other words, for long-term legacy concerns, the far bigger issue is carbon dioxide, not leaked methane.
If you are concerned about global warming itself, not about the relative merits of coal and natural gas, then it makes sense to normalize the numbers to the initial value, and not to the time varying values. To show this, such values are given in rows 2, 5, and 6 of Table 1. These rows more clearly show the decreasing global warming effect of the fugitive methane as a function of time. For fugitive methane, row 5 (not row 1) gives the most straightforward indication of the legacy effects.
Leaked Methane
When natural gas is used for fuel to produce electricity, and a fraction f of that gas leaks, how does that affect greenhouse warming? In this section we will derive the appropriate equation, and then apply it to our scenario in which we are considering replacing average coal plants with new natural gas ones.
We will write our equations in terms of the global warming potential GWP per kilogram, since this is the more commonly known and applied number. Let us assume that 1 kg of natural gas is used by the power plant. To consider the worst-case scenario, we assume that the natural gas is pure methane. Let f be the fraction that leaks. The mass of the methane that leaks is f kg, and the mass of the methane that will burn to produce electricity is (1–f) kg. Each atom of the burned methane will produce one molecule of CO2. Using the approximate molecular weight of CO2 and CH4 to be 44 and 16, respectively, the use of one kg of CH4 will result in (44/16)(1–f) = 2.75 (1–f) kg of CO2. CO2, by definition, has a global warming potential per kilogram of 1. In addition to this produced CO2, the leaked methane has a CO2 equivalent of GWP f, where GWP is the global warming potential of methane per kilogram . The total global warming potential equivalent for the 1 kg of methane burned and leaked is equal to the sum of these two terms: 2.75 (1–f) + f GWP.
For the same electrical energy generated, an average coal plant emits 2.78 times as much CO2 as does the natural gas plant; this factor was calculated in previous section. The number of kilograms of CO2 emitted by the natural gas plant was (2.75) (1–f). Therefore the CO2 emitted by the coal plant is (2.73)(2.75) (1–f) = 7.51 (1–f) for the same electrical energy produced.
Let A be the ratio of global warming produced by coal to that produced by methane, including leakage f. We can call this the “natural gas advantage factor” A, and it is given by the ratio of the two terms:
 (2)
(2)
Example values of A are shown in Table 2.
| Leakage | at 0 yr | 0 to 20 yr average | at 20 yr | 0 to 100 yr average | at 100 yr |
|---|---|---|---|---|---|
| 10% | 0.5 | 0.6 | 0.97 | 1.2 | 2.5 |
| 7.9% | 0.6 | 0.7 | 1.14 | 1.3 | 2.6 |
| 6% | 0.7 | 0.9 | 1.3 | 1.5 | 2.6 |
| 4% | 0.97 | 1.2 | 1.6 | 1.8 | 2.7 |
| 3.2% | 1.2 | 1.4 | 1.8 | 2.0 | 2.7 |
| 2% | 1.4 | 1.7 | 2.0 | 2.2 | 2.7 |
| 1% | 1.9 | 2.1 | 2.3 | 2.4 | 2.7 |
| no leakage | 2.7 | 2.7 | 2.7 | 2.7 | 2.8 |
Table 2: Global warming advantage A of natural gas vs. coal electrical plants at different leakage rates and over different time horizons. The numbers in bold indicate the values for which coal produces less global warming than does natural gas.
If A is greater than 1, then the natural gas plant produces less greenhouse warming than does a coal plant that produces equal electric energy. Table 2 shows A, the global warming advantage for production of electricity from methane vs coal, for selected values of methane leakage and time periods.
We illustrate one value in the table in Figure 2, the advantage factor of 1.14 for leakage of 7.9 percent evaluated 20 years after the leakage. This diagram shows the flow of carbon, carbon dioxide, and methane for 7.9% fugitive methane evaluated at 20 years after the leakage.

Figure 2: The flow of carbon, CO2, and CH4 for equal electric energy production, for the special case of 7.9% leakage. The value of 1000 moles of CO2 from the coal plant is arbitrary, but based on the results of Hayloe et al., that value determines the ratio of the CO2 outputs from the two plants to be 1000:365. All of the other numbers in the chart follow from the GWPs in Table 1 and our assumptions of electric generation efficiencies of 33% and 54% for coal and natural gas. Note that even with 7.9% leakage, natural gas produces less greenhouse warming 20 years after the release. The advantage continues to grow as time passes, as shown in Table 2.
We now calculate fe, the leakage f that would render natural gas and coal use equivalent for greenhouse warming; more specifically, it is the leakage level that would result in a natural gas power plant having no greenhouse advantage compared to that of a coal plant, for the same MWh of electricity production. To do this, we set A = 1 in the equation for A, and solve for f.
This gives
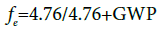 (3)
(3)
We present some numerical results in Table 3, using the values for GWP per kg from Table 1.
| at 0 yr | 0 to 20 year average | at 20 years | 0 to 100 yr average | at 100 years | |
|---|---|---|---|---|---|
| % leakage for coal equivalence | 3.8% | 4.6% | 8.4% | 10.8% | 70% |
Table 3: Methane leakage that would negate any greenhouse minimization advantage of a natural gas power plant compared to a coal power plant, for the same electric energy produced.
So, for example, if you are concerned with the first 20 years after emission, then methane for your power plant would have to leak at the rate of 4.6% for it to lose its advantage over coal. If, on the other hand, you are concerned about the legacy effect at 20 years, then the leakage would have to be greater than 8.4% to make coal a better choice. At 100 years, an absurd 70% of the methane would have to leak (in the pulse at t = 0) to negate its advantage over coal. Of course we are not arguing that such leakages are acceptable. We are simply saying that such a switch to a power plant burning natural gas would cause as much greenhouse warming as would remaining with coal generation.
Fugitive Methane Estimates
There have been a large number of estimates of the fractional leakage of methane in recent years, and we will not attempt a review; rather, we will look at a few publications that have been influential to policy makers, and illustrate how our computations affect the climate change significance of these numbers.
Howarth et al. [10] estimated that natural gas obtained by hydraulic fracturing (“fracking”) might be accompanied by a leakage rate as high as 7.9%. (Because of the attention given this value we included it explicitly in Table 2.) They obtained this number by taking the highest known number for a conventional well, 6%, and adding to it an additional 1.9% that would occur if the methane produced during the flowback period were vented to the atmosphere rather than flared (burned). Venting at natural gas fields is becoming less common, and would essentially disappear if legislation required flaring (burning) at the well. Flared natural gas is nearly 100% carbon dioxide, so it reduces the greenhouse warming by a factor of the GWP per mole. (Per kg, in this paper we used GWPs of 120, 86, 45, 34, and 1.8 for various time periods; per mole, these values become 44, 31, 16, 12, and 0.7.) Thus flaring essentially drastically reduces the greenhouse effect, except (ironically) at 100 years and beyond, when the methane would have vanished from the atmosphere, but the produced carbon dioxide persists.
At the time the Howarth et al. [10] paper was published, it was widely perceived as showing a catastrophic leakage rate under present-day practice, given the high values for GWP per kg. However, as we explained, that interpretation does not take into account the two key facts that mitigate the danger of methane: it uses fewer kilograms for the same electrical energy output, and it produces less CO2 per kilogram since much of the energy comes from the extra hydrogen in the CH4 molecule. From Table 3, we see that for the 20-year average, such leaky use of natural gas does negate all global warming value compared to coal since the advantage factor A is 0.7, a value less than one, but not catastrophically. Indeed, the effect at 20 years (vs. the effect averaged over 20 years) is slightly advantageous for natural gas (A = 1.1) even at the high leakage rate of 7.9%. For the 100 year average, natural gas has an advantage factor of 1.3, and at 100 years, the advantage is a substantially higher 2.6. This reflects the fact that at 100 years, virtually all the methane has been removed from at the atmosphere, although some has been converted to carbon dioxide.
This analysis should not be interpreted as giving permission for such high leakages. A 7.9% leakage rate is indefensible, not only because of its short-term global warming effect, but also because it implies wasted energy; stockholders should not tolerate such levels. And, of course, the 7.9% value was somewhat artificial, given the way it was computed.
Brandt et al. [11] published a review of leakage studies. They began with leakage rates based on inventories; these averaged 1.5% leakage. However, they argued that overall US CH4 inventories from all sources are underestimated by 1.25x to 1.75x. The implied leakage rates depend on where the excess methane is coming from. You get 1.9% to 2.6% if you assume that the excess methane is distributed proportionately across known sources. There is evidence mentioned by Brandt that other sources (e.g. livestock) are also significantly underestimated. For additional analysis, see [12]. A similar result was published by K. Larsen et al. of the Environmental Defense Fund Rhodium Group. They estimated that world-wide leakage to be about 3%. Peischi et al. [13] used measurements made from airplanes flying above the Marcellus. They report leakage from this highly fracked region, ranging from 0.18% to 2.8%. The low levels may indicate what can be obtained by using best practice, although it is also possible that other effects contributed, such as the reduced need for liquid unloading in the relative dry Marcellus formation.
Acceptable Limits
Alvarez et al. [2] argued that the maximum acceptable leakage of methane was 3.2%. This value has been widely used by policymakers, and for that reason we include it explicitly in Table 2. This number is reasonably close to our value of 3.8% found in Table 3 for the immediate 0-year effect, given the differences in the models. Alvarez et al. took the efficiency of coal power generation to be 39%, a reasonable value for new coal plants. We used 33%, the current average in the US and Europe, since we focused on the potential value of replacing existing coal with new natural gas plants. Alvarez et al. assumed 50% efficiency for natural gas, and we took a higher level of 54%, to indicate what could be achieve if the global warming considerations were taken to be important in the choice of design. Alvarez et al. also used a more complex model for coal, including leakage of methane that occurs during mining and other factors. Our goal was not to try to keep the model simple in order to maximize transparency of our computations and make them easy to apply for policy decisions.
Policy makers can look at our Table 2 and 3, and take into account differing goal that depend on time period of concern. If they are primarily worried about immediate effects, then they can focus on the first three columns, representing 0 yr, 0-20 yr averages, and the effect at 20 years. If they are more concerned about long-term legacy, then they can focus on the residual effect at 100 years, which gives natural gas an advantage over coal by a factor of 2.6 to 2.8, for all realistic leakage rates.
Alvarez et al. also give the leakages that would achieve coal / natural gas equivalence for longer periods. In their Figure 2C, they show that a 7% pulse of leakage would achieve equivalence to coal in about 45 years. It is important to recognize that what they mean by this result is that the average over 45 years is equal to that of coal. After 45 years (over 5 half-lives) 97% of the leaked methane is gone. It is easy to misread the Alvarez et al. results to think that methane leaked today has a long legacy. It does not; it only adds slightly to the CO2 produced by the burned methane. In contrast, as shown in Figure 1, the carbon dioxide emitted in more abundance by the coal burning plant does indeed have a long-term legacy, lasting thousands of years.
If the primary consideration is the legacy effect in 50 to 100 years, then all of the leakages in Table 2, from 0% up to 10%, indicate that natural gas replacement of coal is preferable. Of course a 10% leakage is inexcusable; although its greenhouse effect is still preferable to coal, it still produces more warming than lower emissions. And it makes no sense to the plant operators and owners; such “super emitters” should be improved for all concerned including investors. We simply point out that even at those enormous leakage rates, natural gas still has GWP advantage over coal for legacy effects.
Conclusions and Policy Implications
The large value of the GWP of methane, 120 per kg at t = 0, is partially an artifact of the light weight of methane; molecule per molecule the GWP is 44, still high, but not as frightening. Moreover, the short 8.6-year half-life of methane in the atmosphere rapidly mitigates its effect as a cause of global warming. When normalized to equal electric energy produced (replacement of US/European average coal plants by modern natural gas plants) the impact is reduced further. The most direct way to include these effects is to focus on the numbers in row 4 of Table 1, which shows that the value 16 for the relative GWP per MWh at t = 0 and drop further with time. In our experience, many non-specialists are surprised at the difference between the standard GWP value of 120 and this substantially lower (and arguably more relevant) value of 16. The global warming effect diminishes even more rapidly when it is examined in absolute terms, rather than referenced to the also diminishing effects of carbon dioxide.
At all plausible leakage rates, with a focus on legacy warming, it is preferable to produce electricity from modern natural gas generators rather than from the current average coal plants.
The fact that the standard GWP is a ratio, not an absolute measure of warming, leads to to some peculiar and non-physical anomalies. Thus, for example, if you look at Figure 1 you will see that the ratio of CH4 to CO2, and thus also the GWP of methane, actually rises for the first few years, while its concentration is dropping exponentially. This rise does not reflect an increasing addition to global warming; it is an artifact of the rapid drop in CO2. Similarly, the relatively high GWP of methane for the 20 year average; the standard GWP gives it as 86, but compared to its starting value, it is 58. In the same way, of GWP per kg for the 100 year average is 10, not 34, when referenced to its effect at t = 0.
Many policy makers have been confused and misled by overly simple back-of-the-envelope estimates. Even scientists make similar errors. The naive and incorrect argument goes as follows: “Methane has 86x the greenhouse potency of carbon dioxide. That seems to suggest that even 1% leakage would make natural gas power plant disadvantageous for global warming; a 3% leak would be disastrous.” The quick rejoinder to that mistaken calculation is that it misuses GWP per kilogram, when the key number is the GWP per MWh. In an informal survey of scientists who had read about the high methane GWP (86 for the first 20 years, 34 for 100 years) we discovered that most of them did not know that the published GWP values were per kilogram, and they didn’t take into account the efficiency of power production, or that the numbers were averages, with most of the methane effect coming in the first two decades.
In this paper, we ignored two important effects. The first is the fact that natural gas production is not a one-time event; that when we build a natural gas infrastructure, we intend to continue to use it for many decades. On the other hand, it is also plausible that a high rate of leakage today would be reduced as time goes on. Much of the methane today is emitted by a few super-emitters, and those could be made cleaner or shut down. Second, we do not take into account the delay in the development and deployment of cleaner generating plants, such as solar, wind, and nuclear, that widespread use of natural gas could delay. This issue has been examined in detail by Hausfather [14] who concludes that the advantages of natural gas are substantial even if they do cause such a delay.
Because of its short lifetime in the atmosphere, the climate threat of fugitive methane is concentrated in the near term. It is currently a significant contributor to global warming, and if a natural gas economy spreads rapidly around the world, then there is a danger that its global warming contribution will rise. This is offset by the fact that high leakage of natural gas is unprofitable; the cost of reducing leakage, particularly at the “super sites” that have levels of 7% and higher, is far less than the value obtained by capturing that natural gas and using it as fuel.
When concerned about legacy effects of methane, the standard GWP per kg numbers can be misleading for three reasons. First, they are all presented as averages that combined short term effects with true legacy effects. Secondly, when presented per kilogram, they don’t take in account the light weight of methane (compared to carbon dioxide) and the high efficiency for production of electricity from modern natural gas turbines and generators. And finally, by comparing the effect to a constantly dropping carbon dioxide value, they give the impression that long term greenhouse gas warming is larger than it actually is. In this paper we discussed many approaches that take these into account, and they give some surprising and non-intuitive results. Perhaps the most surprising is one example we presented explicitly: a modern natural gas generator with a 7.9% level of fugitive methane, after a delay of 20 years, will contribute less to global warming that an average coal plant that delivered equal electric energy. That result seems incompatible with the well-known IPCC number that the 20 year GWP of methane is 86 times greater than that of carbon dioxide. Of course, the two numbers are both correct, but naive use of the 86 numbers can mislead the non-expert to a mistaken conclusion.
The legacy effects of methane, when properly calculated, are far less than many government officials currently believe. It is critical for them to use the proper numbers when deciding policy; these can be calculated using the standard IPCC numbers (used in Equations 1 and 2) but they can be understood more intuitively by looking at the tabulation of other forms of the GWP, including GWP in terms of MWh, and for specific times, e.g. at 100 years rather than averaged over the period 100 years. In this paper we analyzed a specific issue, the replacement of the current coal based electric power plants with modern combined cycle natural gas plants, and we showed that except for extraordinarily high leakage (8.4% and higher; see Table 3) the greenhouse legacy effect 20 years after the emission argues favorably for natural gas replacement of coal.
Acknowledgements
We thank Zeke Hausfather, Robert Rohde, and Steven Mosher for helpful and enlightening discussions.
Funding sources
This research was funded by Berkeley Earth, a non-profit scientific research organization, and it did not receive any specific grant from funding agencies in the public, commercial, or not-for- profit sectors. This paper was not reviewed by any of the Berkeley Earth funding sources prior to submission. The funding sources for Berkeley Earth can be found at http://BerkeleyEarth.org.
References
- IPCC (2013) AR5 WG. "Climate Change 2013: The Physical Science Basis - Anthropogenic and Natural Radiative Forcing Supplementary Material". Cambridge University Press.
- Alvarez RA, Pacala SW, Winebrake JJ, Chameides WL, Hamburg SP (2012) Greater focus needed on methane leakage from natural gas infrastructure, Proc. Natl. Acad. Sci 109: 6435-6440
- Karion A, Sweeney C, Pétron G, Frost G, Hardesty RM, et al. (2013) Methane emissions estimate from airborne measurements over a western United States natural gas field, Geophys. Res. Lett 40: 4393-4397.
- Cathles L, Brown L, Taam M, Hunter A (2011) A commentary on ‘‘the greenhouse-gas footprint of natural gas in shaleformation’’ by Howarth, Santoro, and Ingraffea. Clim Change.
- Busch C, Gimor E (2014) Natural Gas versus Coal: Is Natural Gas Better for the Climate? The Electricity Journal 27: 97-111.
- Hayhoe K, Kheshgi HS, Jain AK, Wuebbles DJ (2002) Substitution of natural gas for coal: climatic effects of utility sector emissions. Clim. Chang 54: 107-139
- IPPC (2001) AR WG1. Trace Gases: Current Observations, Trends, and Budgets". Climate Change 2001
- IPCC 2007, AR4 WG1. Climate Change 2007: The Physical Science Basis. Contribution of Working Group I to the Fourth Assessment Report of the Intergovernmental Panel on Climate Change.
- Joos F, Prentice C, Sitch S, Meyer R, Hooss G, et al. (2001) Global warming feedbacks on terrestrial carbon uptake under the Intergovernmental Panel on Climate Change (IPCC) emission scenarios. Global Biogeochem. Cycles 15: 891-908.
- Howarth RW, Santoro R, Ingraffea A (2011) Methane and the greenhouse-gas footprint of natural gas from shale formations. Climatic Change 106: 679-690
- Brandt AR, Heath GA, Kort EA, Sullivan FO, Petron G (2014) Methane leaks from North American natural gas systems, Science 343: 733-735
- Hausfather Z (2015A) Natural Gas Leakage in Brandt et al., Berkeley Earth memo.
- Peischl J, Ryerson TB, Aikin KC, de Gouw JA, Gilman JB, et al. (2014) Quantifying atmospheric methane emissions from the Haynesville, Fayetteville, and northeastern Marcellus shale gas production regions, JGR Atmospheres 120: 2119-2139
- Hausfather Z (2015B) Bounding the climate viability of natural gas as a bridge fuel to displace coal, Energy Policy 86: 286-294

