 Spanish
  Chinese
  Russian
  German
  French
  Japanese
  Portuguese
  Hindi
Hindi Research Article, Geoinfor Geostat An Overview S Vol: 0 Issue: 0
Landsat Evaluation of Land Cover Composition and its Impacts on Urban Thermal Environment: A Case Study on the Fast-growing Shanghai Metropolitan Area from 2000 to 2015
1Graduate School of Life and Environmental Sciences, University of Tsukuba, Tennodai, Tsukuba, Ibaraki, Japan
2Faculty of Life and Environmental Sciences, University of Tsukuba, Tennodai, Tsukuba, Ibaraki, Japan
*Corresponding Author: Fei Liu
Graduate School of Life and Environmental Sciences, University of Tsukuba, Tennodai, Tsukuba, Ibaraki, Japan
E-mail: rscugliufei@gmail.com
Received: September 17, 2018 Accepted: November 14, 2018 Published: November 24, 2018
Citation: Liu F, Murayama Y (2018) Landsat Evaluation of Land Cover Composition and its Impacts on Urban Thermal Environment: A Case Study on the Fast-growing Shanghai Metropolitan Area from 2000 to 2015. Geoinfor Geostat: An Overview S3:006. doi: 10.4172/2327-4581.S3-006
Abstract
Land surface temperature (LST) is an important yardstick of evaluating urban thermal effect. Researches on how the LST spatiotemporally respond to land use/cover (LUC) change can better understand the mechanism of urban heat island (UHI) formation, quantitatively examine the thermal contribution of urban biophysical components, and further ease the negative influence of accelerating urbanization. Using Landsat data, this study attempts to evaluate the spatial changes in land cover and its impacts on the urban thermal environment in the fastgrowing Shanghai metropolitan area (SMA). Based on the results of LUC classification and LST retrieval, we estimated the contribution proportion of different land cover on the thermal environment. Then, we performed the spatial concentric zone analysis and profile analysis according to the, urban-rural gradient theory. During the years from 2000 to 2015, the changes in observed values and trend of UHI over time, were highly co-related with the urban expansion of SMA. The results indicated that the UHI zone was gradually expanding between these 15 years, whereas the UHI intensity of the inner city in SMA was declining. The relative difference of thermal effect between the downtown and the outskirts was also decreasing. Additionally, we identified that the land cover composition has notably affected the urban thermal environment. In SMA, the substantial expansion of impervious surface (IS) has heavily influenced the urban thermal effect; in contrast, the spatial adjustments of urban greenspace infrastructure including vegetation and water, effectively relieve UHI phenomenon and enhance the effect of urban greenspace cooling island (UGCI). The finding is expected to provide references and clues for the decision-makers for optimizing and creating appropriate sustainable urban development strategies.
Keywords: Land cover composition; Urban greenspace cooling island (UGCI); Urban heat island (UHI); Urban thermal contribution; Urban thermal environment
Introduction
Rapid urbanization and urban expansion have been accompanied by a substantial increase in impervious surfaces and the corresponding decrease in natural lands. These changes have exerted crucial influences on the urban environment and urban ecosystem [1-8]. The phenomenon of urban heat island (UHI), generally described by temperature differences of higher temperature in densely urbanized areas and lower temperature in the surroundings, has always been a significant topic in urban environmental problems [3-10].
The urban ecosystem has a distinct characteristic which is intensely dominated by human activities, notably different from other ecosystems. The changes and patterns of urban land cover composition have given rise to complicated ecological processes including ecological effects, environmental effects, and socio-economic effects. It is widely noted that natural landscapes are replaced by anthropogenic landscapes in the process of urbanization, where a sequence of land cover conversions and transitions generate a mass of fluctuations in surface heat radiation, heat storage, and heat transmission [3,8,9].
Simultaneously, the anthropogenic heat release and transmission caused by a dense population, energy consumption and other changes are also manifested through the urban thermal effect [8,9]. In a nutshell, there is a final heat balance, regardless of the sensible heat flux and heat transfer mode caused by the change in surface emissivity, or spatial configuration change of artificial heat. Therefore, the best index characterizing this balance is undoubtedly land surface temperature. The dynamic urban thermal environment provides a comprehensive perspective for reflecting the complex urban ecological and environmental effect.
It is well recognized from a substantial number of UHI studies that the UHI phenomenon can be grouped into the three categories: boundary UHI, canopy UHI and surface UHI (SUHI) [6,9]. This study focuses the SUHI estimation on the ground of land surface temperature (LST). Various existing studies have provided an in-depth understanding for measuring and deriving LST based on the advanced methodologies of thermal infrared remote sensing [1-10]. Although plenty of previous studies have concentrated on deriving land cover indices or land cover/use (LUC) changes associated with the UHI effect [4-10], whereas the quantitative investigations of the linkages between the UHI and urban biophysical parameters have been always significant and valuable with the unceasing upgrading of technology and methodology [3-8,10-13].
Beside this, different behaviors of land cover have diversely affected the urban thermal environment. Notably, the changes in the heat flux caused by the conversion of the impervious surface and vegetation are critical for the thermal effect [9,14]. The increasing accumulation of impervious surface is regarded as the major contributor to UHI effects due to the high thermal storage capacity, whereas the vegetation and water are the promising and practical options for the mitigation of adverse UHI effects and the reinforcement of urban cooling island (UCI) [6]. Hence, we still need the synthetic assessment research, which comprehends and addresses how urban land cover composition and distribution affect the urban thermal effect. This would provide valuable clues and distinct insights to improve urban planning and management.
Along with the rapid urbanization on both global and national scales at the beginning of the 21st century, the urbanization has increasingly sprawled, and urban and rural areas have been gradually mixed and integrated as the Shanghai metropolitan area (SMA). Drastic changes in urban land cover and landscape have induced a series of urban environmental effects [1,15-18]. Therefore, taking Shanghai as a case study, it is a great significance to investigate the urbanization-induced land cover dynamics and their impact on the urban thermal environment (Figure 1).

Figure 1: The location map of study area.
Thus, the chief objective of this study was to evaluate the spatiotemporal layouts and changes in land cover and its impacts on the urban thermal environment in the fast-growing SMA using satellite Landsat data. Specifically, we initially examined the spatiotemporal evolution of thermal environment under the land development scenario; subsequently, we investigated how the different land cover features and their spatial configuration affect UHI in different years; then, we estimated the contribution of different land covers on the thermal environment; finally, the spatiotemporal differentials in the thermal effect was measured and identified based on the urban-rural gradient analysis.
Materials and Methodology
Study area and data description
Study area: We define the Shanghai People's Square as the city center, the location of Shanghai Municipal Government and central business district (CBD). The study area covers most of city proper, urban fringe, and its surrounding rural area in SMA with an 80 km × 80 km landscape. SMA is suitable for evaluating the dynamics of the UHI effect due to its rapid industrialization, drastic urbanization, highly developing economy, and dense population. The SMA is the most prosperous and highly developed area at the national and global scale. Shanghai, Alpha++ Global City, is also served as the most critical megacity and port in the initiative of "One Belt, One Road" by the Chinese government [19,20].
Geographically, SMA is located on the estuary of Yangtze River in the middle portion of Chinese north-south coastline as the most significant center and hub for trade, economy, finance, culture, and transportation. Most terrain areas lay on a flat plain with the elevation of approximately 4.5 m. Additionally, the Huangpu River goes through the whole SMA from north to south.
From a climatic viewpoint, SMA is located in the zone of humid subtropical monsoon climate. The annual average temperature is approximately 17.1°C, with the utmost highest air temperature at 38.5°C in summer (August), and the utmost lowest air temperature at 4.8°C in winter (January and February); additionally, the annual average evaporation is 984.4 mm, and the annual average precipitation is 1,649.1 mm [21].
The UHI phenomenon is affected not only by topography and climate, but by the human migration and economic growth. SMA experienced an increase in the resident population from 16.09 million to 24.15 million during the 2000-2015 period. The population density increased from 2,537 per km2 to 3,089 per km2 in this period. Furthermore, the GDP in SMA increased from 481.2 billion yuan to 2,564.3 billion yuan with the per capita GDP increase from 30,307 yuan to 105,944 yuan [21].
Datasets and preprocessing: To estimate the LST in SMA and detect the impact of land cover dynamics and related anthropogenic activities, we adopted Level-1 GeoTIFF Landsat satellite imageries in the U.S. Geological Survey (USGS, https://earthexplorer.usgs.gov/). All the imageries with cloud cover less than 10%, were captured with the minimal seasonality effect, giving priority to the month from June to September.
We used the spatial enhancement images stemmed from the fusion of 30 m spatial resolution multispectral bands and 15 m panchromatic band images using the Gram-Schmidt (GS) Pan Sharpening approach. Subsequently, the spatial enhancement images and Google Earth historical satellite imageries were employed for validation and accuracy assessment of urban LUC classification (Table 1).
| Spacecraft Sensor | Acquisition Date | Scene Center Time (GMT) | Path/Row | Scene Center Latitude | Scene Center Longitude |
|---|---|---|---|---|---|
| Landsat ETM+ | 18. Sep. 2000 | 2:15:31 | 118/38 | 31°45'N | 121°54'E |
| 18. Sep. 2000 | 2:15:55 | 118/39 | 30°18'N | 121°32'E | |
| Landsat OLI/TIRS | 03. Aug. 2015 | 2:24:37 | 118/38 | 31°45'N | 121°54'E |
| 03. Aug. 2015 | 2:25:01 | 118/39 | 30°18'N | 121°32'E |
Table 1: Basic information on the Landsat imagery data.
Methods
LST retrieval and grading: Thermal images from Landsat spacecraft were used for the retrieval of LST by the Radiative Transfer Equation (RTE). The thermal infrared band (ETM+sensor Band 6, OLI/TIRS sensor Band 10) was processed for measuring the accurate LST values. The following six procedures were conducted in this analysis [22-26]:
1. Initially, we merged two images and clipped the research area as the prioritized steps. Subsequently, the at-sensor radiance (L λ) was estimated by Eqn. (1) [23-25]:
Lλ =[εB (TS)+(1-ε )L↓]τ +L↑ Eqn. (1)
Where τ is representative of the total atmospheric transmissivity between the land surface and Landsat sensor, ε is the land surface emissivity, B(T S) is the blackbody radiance given by the Plank’s law, T S is the emissivity-corrected LST, L↓ is the effective bandpass upwelling atmospheric radiance, and L↑ is the effective bandpass upwelling atmospheric radiance.
2. Secondly, the land surface emissivity (ε ) was estimated using Eqn. (2) [5,7,8,10,25]:
ε =0.004Pv+0.986 Eqn. (2)
Pv representing the vegetation proportion is derived by Eqs. (3) and (4) [6,10]:
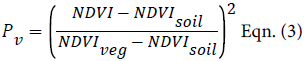
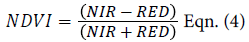
Where NDVI, the abbreviation of the normalized difference vegetation index, is obtained using Landsat Red band and NIR band Eqn.(4). NDVIsoil is considered as the minimum value of NDVI of no vegetation or entirely soil. NDVIveg is the maximum value of NDVI where the area was completely covered by vegetation [5,7,8,10].
3. Thirdly, the blackbody radiance (B(TS)) is obtained as shown in Eqn. (5):
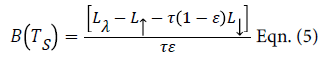
The atmospheric transmissivity, upwelling atmospheric radiance, and downwelling atmospheric radiance are generated by an atmospheric correction parameter calculator provided by the National Centers for Environmental Prediction (NCEP) in NASA (https://atmcorr.gsfc.nasa.gov/) [26]. The band average atmospheric transmissions in SMA between 2000 and 2015 were 0.84 and 0.46, respectively; the effective bandpass upwelling radiance were  respectively; and the effective bandpass downwelling radiances were in
 respectively.
4. Further, the emissivity-corrected LST (TS) is calculated based on the Plank’s radiance function using Eqn. (6) [10,22-28]:
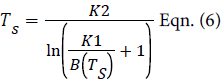
For Landsat ETM+Band 6,
 [17]
[17]
For Landsat 8 OLI/TIRS Band 10,
 [28].
[28].
5. Finally, we estimated the SUHI based on LST. It is essential to exclude the influence of the seasonality, atmospheric conditions background and local climate characteristics. As it is unsuitable to compare LST values or analyze the difference directly, we need to analyze the LST using an ideal background and the same standard. Thus, LST is normalized as NDLSTi in a range from the value of 0-1 [2,29,30]:
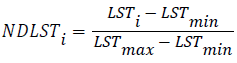
Where LSTi is the LST of pixel i , and LSTmax and LSTmin are the maximum and minimum LST in the considered area. NDLSTi is the normalized LST index for pixel i, with the range of 0-1.
Owing to the superiority for capturing the spatial differentials of LST regardless of the actual air temperature in the different situations, the thermal landscape in the urban and suburban areas was divided into five categories using the LST mean-standard deviation method: 1) very high temperature (VHT) zone, 2) high temperature (HT) zone, 3) moderate (M) zone, 4) low temperature (LT) zone, and 5) very low temperature (VLT) zone [31-33].
Land cover classification strategies: In this study, the LUC maps of 2000 and 2015 in SMA were produced by interactive supervised maximum likelihood classification method. According to the urban setting and typical characteristics of land cover, the classification scheme was composed of four categories, i.e. impervious surfaces (IS) (e.g. high and low albedo IS, transportation infrastructure and other artificial facilities), vegetation (e.g. green space, forest, grassland, and agricultural lands), water, and others (e.g. bare soil, fallow land, construction and excavation land, open space, and the remaining land cover types).
Furthermore, the final classification outputs were evaluated using Google Earth historical images and the spatial enhanced Landsat fusion data of 15 m resolution. 100 samples for each category (the 400 samples in total) were employed to assess the accuracy of LUC classification maps. As a result, the overall accuracies of the 2000 and 2015 classified outputs were 91% and 90%, respectively (Table 2). The Kappa coefficients in 2000 and 2015 were 87.99% and 86.66%, respectively. The results of the accuracy assessment revealed that the classified LUC maps met the analysis standard.
| Thermal effect category (LST Grade) | Criterion/Division |
|---|---|
| Very high temperature (VHT) | NDLSTi > NDLSTmean + NDLSTstd |
| High temperature (HT) | NDLSTmean + 0.5NDLSTstd < NDLSTi ≤ NDLSTmean + NDLSTstd |
| Moderate (M) | NDLSTmean-0.5NDLSTstd ≤ NDLSTi ≤ NDLSTmean +NDLSTstd |
| Low temperature (LT) | NDLSTmean-NDLSTstd ≤ NDLSTi < NDLSTmean -0.5NDLSTstd |
| Very low temperature (VLT) | NDLSTi < NDLSTmean - NDLSTstd |
Table 2: Classification scheme of the thermal effect using the mean-standard deviation method.
The SUHI profiling strategies: In an urban land-cover model, urban or IS expansion from the urban center to the suburban area is assumed to follow a concentric circle structure. In those multiple concentric rings, the innermost ring denotes the IS expands outward along the rings to the farther outskirts [3,7]. Therefore, spatial concentric zone analysis and profile analysis were conducted for characterizing the dynamics of the urban thermal environment and spatial pattern of land cover composition from the CBD to the outwards. We created a total of 40 concentric circles along the distance from the urban center in SMA to our predetermined 40 km radial area; the width of each zone was 1 km.
The analysis was primarily applied for quantifying the change pattern and tendency between the proportion of land cover and normalized LST based on urban-rural gradient theory. Based on spatial concentric zone analysis, we drew eight diagonal and orthogonal profile lines, namely North (N), East (E), South (S), West (W), Northeast (NE), Southeast (SE), Southwest (SW), and Northwest (NW). The profile line analysis was used to collect and identify the angular and directional details information of LST and land cover. Furthermore, the heat contributions of each land cover type were estimated by the heat contribution index [34].
Results
Urban land cover and LST in SMA
Figure 2 shows the spatial patterns and changes in land cover and urban thermal environment from 2000 to 2015. The areas of IS, vegetation, water and others (proportion in the total area) in 2000 were 1,218.04 km2 (19%), 3,697.03 km2 (57%), 1,156.31 km2 (18%), and 421.64 km2 (6%), respectively. However, the areas of IS, vegetation, water and others in 2015 were 2,653.62 km2 (41%), 2,234.79 km2 (35%), 1,063.91 km2 (16%) and 540.68 km2 (8%), respectively.

Figure 2: Maps for LUC classification and the distribution of thermal effects: (a) 2000 LUC, (b) 2015 LUC, (c) 2000 SUHI, and (d) 2015 SUHI.
For LST retrieval results, the VHT zone and HT zone increased from 1,634.10 km2 (25%) to 2,209.47 km2 (34%), the moderate zone increased from 2,430.04 km2 (40%) to 2,615.32 km2 (37%), whereas, the VLT and LT zone decreased from 2,428.87 km2 (38%) to 1,668.22 km2 (26%) between 2000 and 2015. Those changes indicate that the urban thermal environment has been heavily influenced by the sharp expansion of impervious surface and the great loss of natural landscape.
Figure 3 shows the impact of urban thermal environment in SMA. In 2000, the contribution of IS on the thermal environment was mainly reflected in VHT zone (90.61%), HT zone (37.86%), and moderate zone (4.16%); vegetation had greatly influenced the LT zone (89.87%), moderate zone (86.39%) and HT zone (38.83%); the contribution of water was dominant in the VLT zone (98.15%); the contribution of other land types was in the moderate zone (8.23%) and HT zone (22.92%).

Figure 3: The contribution of land cover types to the urban thermal environment in SMA in 2000 and 2015.
However, in 2015, the contribution of IS on VHT zone, HT zone, and moderate zone increased to 95%, 79.71%, and 27.41%, respectively; the contribution of vegetation on LT zone and moderate zone changed to 82.39% and 58.61%, respectively; the contribution of water was still dominated in the VLT zone (95.11%); the contribution of other land cover types was mainly concentrated in the moderate zone (12.36%) and VHT zone (12.07%).
Based on the LUC classification maps and urban thermal effect maps, it is noteworthy that the amount of IS occupied a significant proportion in the area of VHT zone and HT zone in both 2000 and 2015, whereas water and vegetation had been exerting an enormous impact on the urban greenspace cooling island (UGCI). Obviously, rapid urbanization-induced land cover changes especially the rapid sprawls of IS, exacerbate urban thermal effects, while to some extent, the vegetation and water play a crucial role in controlling and mitigating the urban thermal effect.
The Land cover and LST profiling
The SUHI monitoring based on urban-rural gradient: According to the results of spatial concentric zone analysis (Figure 4), the spatial pattern and change tendency of mean NDLST values were in accordance with the urban or IS expansions across the period between 2000 and 2015. The mean NDLST value gradually decreased from the downtown to the outskirt. More specifically, as indicated in Figure 4, the peak of the mean NDLST value was located within 1 km from the urban center. The lowest mean NDLST value existed in the location of approximately 34 km away from the downtown due to the dominant vegetation and water.

Figure 4: The result of spatial concentric zone analysis in 2000 and 2015.
The performance of SUHI in different directions: To further investigate the spatial changes in the pattern and composition of land cover on the urban thermal effect in SMA, we conducted profile line analysis and obtained detailed information about the land cover composition response to the mean NDLST value in different directions (Figure 5).

Figure 5: The result of profile line analysis ordered by N, NE, E, SE, S, SW, W, and NW in 2000 and 2015.
In terms of N direction, the temperature in 2015 within the distance range from the urban center to 23 km was higher than that in 2000 due to the expansion of IS. In the location of 29 km and 30 km away from the urban center, the land cover changes were the greatest in temperature. In the NE direction, we can observe a higher temperature in the interval of 11-19 km away from the urban center in 2015 because of IS growth. For the profile line of E, we can see the prominent UGCI effect in 2015 from the distance range of 29 km to 40 km with the changes in vegetation and water. In the SE direction, the temperature changed steadily with the increase of IS.
In terms of the S direction, the temperature in 2015 was lower than that in 2000 within the 16-22 km owing to the variation of vegetation and water, while the temperature varied strongly within the 25-40 km. In the profile line of SW, W, and NW, the temperature changed with the substantial increase of IS. In the direction of SW and W, IS drastically increased from the distance of 16 km, and IS showed a considerable amount of increase from 13 km, while the temperature correspondingly changed as well.
Discussion
In the context of local, regional and global warming, anthropogenic climate fluctuations caused by changing land surface biophysical properties increasingly affect the balance of terrestrial ecosystem [35]. As carried out in previous studies, the formation of expanding differences in surface temperature between urban and rural depends upon various factors and behaviors, including the local climatic characteristics, biophysical properties of the land surface, topographic features, industrial structure, the scope of population, energy consumption, and anthropogenic activities [6,11,14]. In the synthesis consideration of incorporating these complicated and diverse natural and artificial processes, we hypothesize the underlying causes and effects of UHI phenomenon stemed from the transformations and configuration of land cover. Therefore, our focus is on the spatial evolution of the urban thermal environment associated with LUC change.
For Shanghai, the image of the leading metropolis at both national and global scale was to be impressive, with the field of finance, trade, commerce, industry, science, and technology [1,15-18]. Striding into the 21st century, under the traction of various urban development strategies and proposals, especially the national initiative of ‘opening the Pudong New Area to the world’ and ‘urban-rural integration’[36], SMA experienced profound and tempestuously urban sprawl. As evidenced by the booming development of urban artificial surface and sharp downswing in natural land cover, over the time period of 2000-2015, the expansion rate of IS in SMA reached by 117.86%, the decreasing rate of vegetated cover and water bodies were approximately 39.55% and 7.99%, respectively. Moreover, in combination with the results of LUC change and LST retrieval, the contribution of land cover on the thermal environment revealed that there was a large amount of area expanding in the VHT zone and HT zone of SMA.
The result of profiling monitoring in the land cover and NDLST at both holistic scale and different directions indicated the spatial difference and urban-rural gradient pattern for the temperature shift and the contributed proportion of land cover. Therefore, we can observe from the spatiotemporal layout of land cover and LST in SMA, the intensity of UHI was higher overall, and there was a remarkable difference in temperature in different directions, and high LST and low LST alternately appeared. It is noteworthy that there was a distinct character of asymmetry about the spatial evolution of urban thermal effect in the direction of east-west and north-south. Coordinated consideration from Figures 3 and 4 shows that the spatial pattern of urban thermal effect and mean NDLST value was lower to the east of Huangpu River and higher in the west to Huangpu River owing to the short period of Pudong development. The higher temperature area in the northern part was in the Yangtze River estuary, whereas the lower temperature area was in the southern rural area.
With the implementation of urban-rural integration policies and urban renewal strategies in these 15 years [36-39], the urban facility construction has shifted from the downtown to suburban area in order to balance and coordinate the urban-suburban-rural development. The city proper in SMA was positioned as a synthetic aggregation for commerce, social services, public administrative management, and residential settlement, whereas the suburban and urban fringe area were oriented as the base for manufacture, industry, and emerging technology [36-39]. Due to these measures and efforts for propelling urban regeneration, optimizing the urban structure, and upgrading the industrial layout [38,39], the density of IS in the suburban and rural area drastically increased, while the intensity of UHI in the CBD area gradually decentralized and decreased (Figures 2 and 3). Consequently, the UHI intensity or LST difference between urban and its surrounding rural area in SMA was gradually decreasing.
Specifically, many old residences in the inner city of SMA were demolished and replaced by commercial facilities and real estates; The population was also migrated and resettled by the government from the populated downtown area to the urban fringe and its surrounding satellite towns [15,32,36-39]. Simultaneously, numerous traditional industry transfer and the key manufacturing base within the inner city have shut down or relocated to suburban industrial parks [36-39]. These anthropogenic alterations of land cover, including in-filling redevelopment, the demolishing of old residence to reconstruct commercial or industrial facilities, inevitably stimulated the explosive development of the impervious surface cover with high-heat capacity. Meanwhile, the significant loss of water bodies and vegetation also brought about considerable variation in the surface energy balance and heat flux. The spatial pattern of the urban thermal environment became much complicated.
Besides this, in the inner city, the green space (e.g. urban green park, urban forest, etc.) and water bodies exhibited a small increase due to the growing public attention and great efforts for the urban environment. The growth of urban greenspace infrastructure was effectively alleviating the UHI effect. The UGCI effect was gradually increasing in the inner city of SMA.
As mentioned above all, we can point two distinct characteristics in the urban thermal environment in SMA. Firstly, the extent of UHI zone was gradually expanding; overall, the observed increasing magnitude and trend of UHI were highly consistent with the urban expansion. Secondly, the UHI intensity of the inner city was declining, and the relative difference of thermal effect between the downtown and the outskirts was also gradually decreasing. IS and other types of land cover (e.g. bare land) obviously strengthened the urban thermal effect in SMA, and vegetation and water largely weakened the urban thermal effect in SMA.
Accompanied by the growing urban carbon footprints and exacerbating heat waves, the phenomenon of UHI caused by rapid urbanization have negatively induced the significant variabilities in urban environmental quality and human well-being. Until the present, investigations and discussions of the formation mechanism of UHI and related mitigation strategies have been pressingly needed and concerned among various scholarly researches due to different demands and methodologies. In Shanghai or any another megacity of China [36-40], the dominated strategies for adapting to climate change and mitigating UHI effects have been roughly and manifested on reducing energy consumption, curtailing pollutants concentration and emissions, maintaining ecosystem balance, developing green infrastructures and reinforcing environmental management. Although the specific official policies or regulations for coping with the increasingly aggravated local climatic problem have been in a vague and upward situation, the implementation of developing greenspace infrastructures and regulating the expansion of impervious surfaces would be currently served as the most appropriate and effective approach for abating adverse effects of urban climate [41].
As pointed out in this study, biophysical properties and layouts of land cover play a crucial role in the formation and mechanism of the UHI effect. Therefore, great efforts could be made to control and mitigate the urban thermal effect by changing the spatiotemporal extent and layout of the different urban land cover in SMA. Varying land cover presented the differential thermal behaviors due to differential thermal properties. Impervious surfaces dominate contributing to LST and consequently UHI effect; vegetations, in contrary with impervious surface, facilitate the cooling effect and relief the UHI effect. Not only as revealed in this study, but also as presented in other recent literature [6,41], the emerging greenspace infrastructures in the populated downtown area have promoted to the alleviation of adverse UHI effects and diminishment of the urban heat release. However, on account of shortage resource, heavy population pressure, and intense development competition, it is arduous to implement the green strategies in the dense urban area to counteract the adverse effects of urban climate.
Thus, it is urgent and critical that local government in SMA and policy-makers prudently reconsider and formulate relevant strategies and regulations for the climate change mitigation and adaptation base on in-depth knowledge and studies on the mechanisms and formation of UHI associated with different land development scenarios.
Furthermore, the current study has synthetically investigated that the spatial arrangement and variations of the urban land cover have affected the spatial evolution of the urban thermal environment based on the remote sensing techniques and geospatial analysis. However, because of the data unavailability and inaccessibility, there are some limitations. The more precise LST retrieval and monitoring result should be obtained by considering and aggregating the atmospheric condition parameter and local climate characteristics. The socioeconomic data was also not applied in this study to assist LST and LUC analysis. Hence, population data and other socioeconomic data should be considered and applied in a suitable method as possible. In addition, multiscale analysis and spatial landscape analysis should be integrated into further LST studies.
Conclusion
Shanghai, which is one of the most representative and prosperous cities, has not only witnessed the unprecedented urbanization development in Chinese cities, but also raised many environmental consequences by the substantial increase in IS, i.e., UHI effects. The rapid expansion of IS has given rise to drastic variation in the spatial layouts of the urban thermal environment since the beginning of the 21st century.
In this study, we investigated the spatiotemporal dynamics and layouts of land cover in SMA and their impacts on the urban thermal environment between 2000 and 2015 based on Landsat data. The result revealed that the UHI zone increased with the rapid urban expansion during the 15 years from a holistic perspective, and this also implied that the spatial variation and pattern of the urban environment in SMA profoundly influenced the formation of urban thermal effect. The overall tendency of the mean NDLST value and urban thermal effect has shown consistency with the fluctuation trend of land cover types, namely the increase of high-temperature zone with the substantial expansion of IS and the massive loss of vegetation and water.
We quantified the contributions of various land cover types to the urban heat effect. We observed that urban land cover composition and their variations significantly affect the urban thermal environment. For IS, their proportion and amounts heavily promote the thermal effect, in contrast, a substantial increase in the vegetation and water would effectively relieve UHI phenomenon and enhance the UGCI effect.
During the years from 2000 to 2015, driven by urban-rural development policies and strategies, the temperatures in the downtown of SMA have been a stable or small increasing situation; however, in the urban fringe and its surrounding outskirts, the temperatures have kept a sharply increasing trend. Thus, it is concluded that the UHI intensity or LST difference between urban and its surrounding rural area in SMA was gradually shrinking. Besides this, the expansion outwards of impervious surfaces in the city proper was regulated; meanwhile, the potentials of greenspace infrastructures in the city proper can conduce to UHI adaptions and mitigations. The implementation of green strategies by enhancing urban green spaces and water-covered areas can moderate adverse UHI effect induced by a large number of impervious surfaces.
These findings provide valuable and available references for decision-makers of the urban planning and management to optimize urban land use pattern and achieve sustainable urban development.
Acknowledgement
This study was supported by the Japan Society for the Promotion of Science (JSPS) through Grant-in-Aid for Challenging Exploratory Research 16K12816 and Scientific Research (B) 18H00763.
References
- Li J, Wang XR, Wang X, Ma WC, Zhang H (2009) Remote sensing evaluation of urban heat island and its spatial pattern of the Shanghai metropolitan area, China. Ecological Complexity 6: 413-420.
- Xiong Y, Huang S, Chen F, Ye H, Wang C, et al. (2012) The impacts of rapid urbanization on the thermal environment: A remote sensing study of Guangzhou, South China. Remote Sens 4: 2033-2056.
- Estoque RC, Murayama Y, Myint SW (2017) Effects of landscape composition and pattern on land surface temperature: An urban heat island study in the megacities of Southeast Asia. Sci Tot Environ 577: 349-359.
- Chen XL, Zhao HM, Li PX, Yin ZY (2006) Remote sensing image-based analysis of the relationship between urban heat island and land use/cover changes. Rem Sens Environ 104: 133-146.
- Zhang X, Estoque RC, Murayama Y (2017) An urban heat island study in Nanchang City, China based on land surface temperature and social-ecological variables. Sus Cities Society 32: 557-568.
- Deilami K, Kamruzzaman M, Liu Y (2018) Urban heat island effect: A systematic review of spatio-temporal factors, data, methods, and mitigation measures. Int J App Earth Obs Geoinfor 67: 30-42.
- Ranagalage M, Dissanayake DMSLB, Murayama Y, Zhang X, Estoque R, et al. (2018) Quantifying Surface Urban Heat Island Formation in the World Heritage Tropical Mountain City of Sri Lanka . ISPRS Int J Geo-Inf 7: 341.
- Ranagalage M, Estoque RC, Murayama Y (2017) An urban heat island study of the Colombo metropolitan area, Sri Lanka, based on Landsat data (1997-2017). ISPRS Int J Geo-Inf 6: 189.
- Memon RA, Leung DY, Liu CH (2009) An investigation of urban heat island intensity (UHII) as an indicator of urban heating. Atmos Res 94: 491-500.
- Estoque RC, Murayama Y (2017) Monitoring surface urban heat island formation in a tropical mountain city using Landsat data (1987-2015). ISPRS J Photogrammetry Remote Sens 133: 18-29.
- Taha H (1997) Urban climates and heat islands: Albedo, evapotranspiration, and anthropogenic heat. Energy and Buildings 25: 99-103.
- Bokaie M, Zarkesh MK, Arasteh PD, Hosseini A (2016) Assessment of urban heat island based on the relationship between land surface temperature and land use/land cover in Tehran. Sus Cities Soc 23: 94-104.
- Song J, Du S, Feng X, Guo L (2014) The relationships between landscape compositions and land surface temperature: Quantifying their resolution sensitivity with spatial regression models. Landscape Urban Plan 123: 145-157.
- Oke TR (1982) The energetic basis of the urban heat island. Quar J Royal Meteorological Soc 108: 1-24.
- Li J, Nin YM (2007) Population spatial change and urban spatial restructuring in Shanghai since the 1990s. Urban Planning Forum 2: 20-24.
- Dai X, Guo Z, Zhang L, Li D (2010) Spatio-temporal exploratory analysis of urban surface temperature field in Shanghai, China. Stochastic Environ Res Risk Assess 24: 247-257.
- Ding JC, Zhou HM, Ye QX (2002) Importance of city green by investigation on evolution of heat island in Shanghai City. Meteorological Monthly 28: 22-24.
- Ge WQ, Zhou HM, Tu DJ (2005) The surveying on thermal influence area of Shanghai urban greenbelt. Remote Sens Technol Appl 20: 496-500.
- Belt and Road Portal (2018).
- Hales M, Pena AM, Peterson ER, Dessibourg N (2018) Learning from the East: Insights from China's Urban Success, Global Cities Report, China.
- Statistics Bureau of Shanghai (2016) Shanghai statistic yearbook, China.
- Ferrelli F, Cisneros MAH, Delgado AL, Piccolo MC (2018) Spatial and temporal analysis of the LST-NDVI relationship for the study of land cover changes and their contribution to urban planning in Monte Hermoso, Argentina . D'anàlisi Geogràfica 64: 25-47.
- Yu X, Guo X, Wu Z (2014) Land surface temperature retrieval from Landsat 8 TIRS—Comparison between radiative transfer equation-based method, split window algorithm and single channel method. Remote Sens, 6: 9829-9852.
- Keeratikasikorn C, Bonafoni S (2018) Urban heat island analysis over the land use zoning plan of Bangkok by means of Landsat 8 imagery. Remote Sens 10: 440.
- Sobrino JA, Jimenez-Munoz JC, Paolini L (2004) Land surface temperature retrieval from LANDSAT TM 5. Remote Sens Environ 90: 434-440.
- Barsi JA, Barker JL, Schott JR (2003) An atmospheric correction parameter calculator for a single thermal band earth-sensing instrument. Geoscience Remote Sens 5: 3014-3016.
- USGS (2017) Landsat 7 (L7) data users’ handbook. Landsat Science Official Website.
- USGS (2015) Landsat 8 (L8) data users’ handbook. Landsat Science Official Website.
- Li YB, Shi T, Yang YJ, Wu BW, Wang LB, et al. (2015) Satellite-based investigation and evaluation of the observational environment of meteorological stations in Anhui province, China. Pure Applied Geophysics 172: 1735-1749.
- Shi T, Huang Y, Wang H, Shi CE, Yang YJ (2015) Influence of urbanization on the thermal environment of meteorological station: Satellite-observed evidence. Adv Clim Change Res 6: 7-15.
- Sun Q, Tan J, Xu Y (2010) An ERDAS image processing method for retrieving LST and describing urban heat evolution: a case study in the Pearl River Delta Region in South China. Environ Earth Sci 59: 1047-1055.
- Zhang H, Qi ZF, Ye XY, Cai YB, Ma WC, et al. (2013) Analysis of land use/land cover change, population shift, and their effects on spatiotemporal patterns of urban heat islands in metropolitan Shanghai, China. Applied Geo 44: 121-133.
- Chen L, Jiang R, Xiang WN (2016) Surface heat island in Shanghai and its relationship with urban development from 1989 to 2013. Advances in Meteorology 2016: 1-15.
- Lu D, Song K, Zang S, Jia, M, Du J, et al. (2015) The effect of urban expansion on urban surface temperature in Shenyang, China: An analysis with Landsat imagery. Environ Modeling Assessment 20: 197-210.
- Turner BLII, Lambin EF, Reenberg A (2007) The emergence of land change science for global environmental change and sustainability. PNAS 104: 20666-20671.
- Shanghai Municipal Commission of Economy and Information (2018) Annual report for industrial development in Shanghai: 2000-2015.
- Shanghai Municipal Government (2000) Master plan of Shanghai city.
- Shanghai Municipal Government (2012) Shanghai’s 12th five-year action plan for energy saving and adaptation to climate change.
- Shanghai Municipal Government (2017) Shanghai’s 13th five-year action plan for energy saving and adaptation to climate change.
- He Q, Jiang X, Gouldson A, Sudmant A, Guan D, et al. (2016) Climate change mitigation in Chinese megacities: A measures-based analysis of opportunities in the residential sector. Applied Energy 184: 769-778.
- Gunawardena KR, Wells MJ, Kershaw T (2017) Utilising green and bluespace to mitigate urban heat island intensity. Sci Total Environ 584: 1040-1055.

