Research Article, Geoinfor Geostat An Overview Vol: 6 Issue: 3
Spatial Distribution of Malaria Incidence in Sabah from 2012 to 2016
Pahrol MA1*, Noraishah MS1 and Nasir RA2
1Environmental Health Research Centre, Institute for Medical Research, Jalan Pahang, Kuala Lumpur, Malaysia
2Faculty of Architecture, Planning and Surveying, Centre of Studies Park and Amenity Management, University Technology MARA, Shah Alam, Selangor, Malaysia
*Corresponding Author : Pahrol MA
Medical Officer, Environmental Health Research Centre, Institute of Medical Research, Jalan Pahang, Kuala Lumpur
Tel: +603-26162313
E-mail: muhammad.alfatih@imr.gov.my
Received: May 17, 2018 Accepted: June 06, 2018 Published: June 13, 2018
Citation: Pahrol MA, Noraishah MS, Nasir RA (2018) Spatial Distribution of Malaria Incidence in Sabah from 2012 to 2016. Geoinfor Geostat: An Overview 6:3. doi: 10.4172/2327-4581.1000184
Abstract
Objective: Malaria is a significant public health problem in developing countries. Spatial pattern of malaria was developed by geospatial tools from other countries were proven as an effective ways in malaria control programme especially to curb the disease spread. This study aims to observe spatial distribution and patterns
explicitly in Sabah from year 2012 to 2016. From this we can provide explanation on malaria patterns and its spatial variations.
Methods: Yearly dataset on malaria cases was used in this study from 2012 to 2016 which was compiled by Sabah Health State Department, Ministry of Health Malaysia. Kriging interpolation method in Geographical Information System (GIS) was applied to analyze the 5-year study period. Moran’s I was used to determine
the spatial autocorrelation between districts in Sabah.
Results: The incidence rate of malaria in Sabah shows reducing trend during the 5-year study period. The highest incidence rate involved the central and western of Sabah with more than 200 per 100,000 populations. Moran’s I statistics for all the years indicates that incidence of malaria is clustered (p-value<0.05).
Conclusion: Geospatial analysis is a useful tool in order to investigate the relationship between malaria incidences and shows spatial variations. This information helps the health authorities to emphasize the specific area in intervening malaria problem.
Keywords: Malaria; Sabah; GIS; Moran’s I; Kriging
Introduction
Malaria remains an endemic incidence and a significant public health problem in many developing countries [1,2]. There is much significant development made in reducing malaria morbidity and mortality through the increase of malaria control programs [3,4]. For instance, an estimated 300 million new cases of malaria were reported in 2017 [5]. Malaria is a disease that is caused by a protozoan named Plasmodium. There are four species of Plasmodium, namely Plasmodium falciparum, Plasmodium vivax, Plasmodium malaria and Plasmodium ovale. In Malaysia, the incidence of malaria is increasing despite reducing the trend of Plasmodium falciparum and Plasmodium vivax incidence because of increasing incidence of Plasmodium knowlesi in East Malaysia. Malaria notifications in Sabah have shown reducing trend in 20 years study from 1992 to 2011 [6,7]. However, a study was done by Yusof et al. observed the trend between 2012 and 2013 have found that Sabah contributed the highest incidence of Plasmodium knowlesi widespread in Malaysia with 73% of 115 mixed cases involved with mixed Plasmodium knowlesi and Plasmodium vivax [8].
Malaysia is one of the countries that focus on eliminating malaria towards the year 2020. Over a decade, Malaysia has accomplished a remarkable success in reducing malaria trends between years 2000 to 2010. One of the significant achievements is 92% reduction of total malaria cases in 2015 from 2014 which 3,147 cases to 242 cases regarding autochthonous malaria [5]. Currently there are 25 countries undertaking malaria-elimination program to reduce total malaria cases. There were 17 countries reported reducing total malaria cases and more than 90% reduction which majority located in the Middle East, Europe and Central Asia [5,8].
There were studies in Malaysia on malaria cases which focused to the species components [1,6,9]. However, the utilisation of geospatial tools such as Geographic Information System (GIS) in order to distinguish spatial patterns of malaria is needed [1,9,10]. Hence, it is critical to adopt effective ways to predict malaria occurrence based on GIS as to control its spread.
GIS has been used in healthcare settings to make spatial analysis resourceful [11]. Studies regarding spatial or disease epidemiology involving the analysis of geographical health data with associated demographics, environment, socioeconomic and associated risk factors have been reviewed [12-14]. This information was helpful for healthcare authorities to determine disease patterns [1], investigate the hotspots area for appropriate management in a high-risk area [10]. GIS provided spatial information about the disease and translated into a map with information to better understand the geographic pattern, change and relationship [15]. For example, in South Africa, GIS has been used to display malaria incidence at the administrative level to provide data for specific malaria control activities from the national level to the village or settlement level [10].
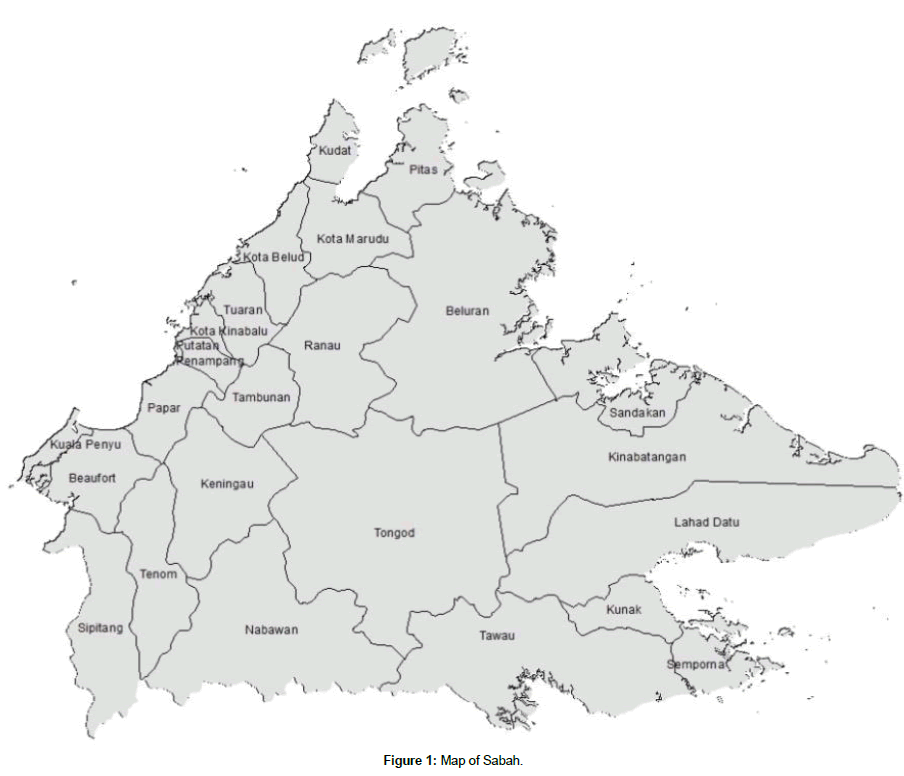
Sabah has the highest risk of malaria disease based on a study that used relative risk estimation model on disease mapping [16]. Therefore, the primary aim of this study is to describe the spatial distribution of malaria incidence in over a five year period. The developed maps from this study will help the health authorities to recognize and identify the risk of current malaria areas and hot spots. Thus, an appropriate plan for vector control programme can be initiated or implemented to curb the disease (Figure 1).
Methodology
This study was done in Sabah state which is located on the north part of the Borneo Island with a total land area of 73,904 square kilometres. It is located in a tropical geography with warm and humid climate with an average temperature of 27°C to 34°C with average rainfall of 1,800 millimetres to 4,000 millimetres. Sabah consists of five divisions and divided into 25 districts with a total population of 3,206,742 (Department of Statistic Malaysia). This study was retrospectively conducted by using secondary data from the Annual Malaria Report compiled by Sabah State Health Department.
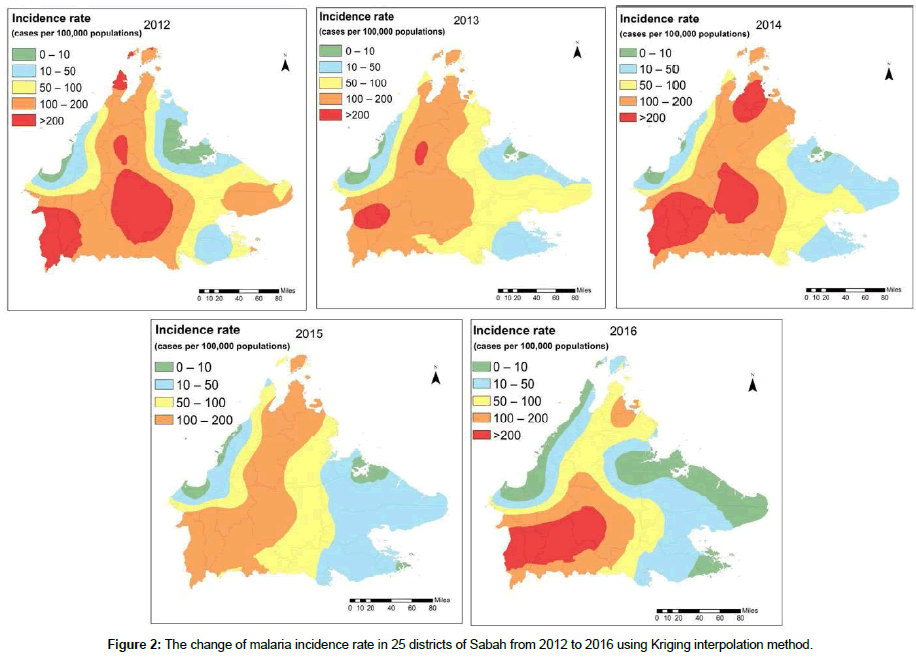
GIS is a computer-based system that has the ability to capture, retrieve, manage, display and conduct analysis of spatial and temporal data geographically. The spatial interpolation tool used to predict values using data from a limited number of sample points incorporated into the area map. In this study, we used Kriging interpolation method to examine trends and pattern from malaria incidence data. Kriging interpolation method is based on spatial statistics and weighting of each point in matrix form. We classified malaria incidence rate data by using colour ranges to indicate the incidence rate level from very low (green), low (blue), moderate (yellow), high (orange) and very high (red) respectively.
Results
The incidence of malaria in Sabah showed a reducing trend as shown in Table 1. In the 5 years period, the incidence reduces about 65% in which total cases of 2,057 in 2012 to 717 cases in 2016. In 2012, the highest contribution of malaria cases was in Tongod district with the incidence rate of 323 in every 100,000 population. The incidence rate of Tongod reduces by nearly 50% in 2016 from the year 2012. Kuala Penyu and Putatan have no cases for 3 to 4 years with zero incidence rates. In Nabawan district, the incidence rate showed increasing trend and the highest was in the year 2016 at 235 per 100,000 populations.
| District | Incidence rate by each year (per 100,000 population) | Population | ||||
|---|---|---|---|---|---|---|
| 2012 | 2013 | 2014 | 2015 | 2016 | ||
| Kota Kinabalu | 10.58 | 1.51 | 0.22 | 0.43 | 0.65 | 462,963 |
| Penampang | 26.21 | 6.35 | 7.94 | 6.35 | 2.38 | 125,913 |
| Papar | 8.56 | 10.9 | 22.58 | 14.79 | 4.67 | 128,434 |
| Tuaran | 31.3 | 22.76 | 36.99 | 10.43 | 4.74 | 105,435 |
| Ranau | 205.64 | 202.51 | 198.33 | 124.22 | 79.33 | 95,800 |
| Kota Belud | 48.29 | 56.88 | 45.07 | 16.1 | 7.51 | 93,180 |
| Kudat | 233.01 | 101.87 | 105.38 | 63.23 | 15.22 | 85,404 |
| Kota Marudu | 144.97 | 120.08 | 180.12 | 130.33 | 39.54 | 68,289 |
| Pitas | 134.15 | 123.83 | 234.75 | 162.52 | 87.71 | 38,764 |
| Beluran | 130.35 | 91.9 | 105.97 | 76.9 | 26.26 | 106,632 |
| Sandakan | 5.87 | 2.93 | 3.91 | 0.73 | 0.49 | 409,056 |
| Kinabatangan | 30.6 | 31.93 | 23.95 | 15.97 | 17.3 | 150,327 |
| Lahad Datu | 102.97 | 86.05 | 55.11 | 27.07 | 15.47 | 206,861 |
| Tawau | 58.93 | 38.31 | 35.65 | 14.79 | 13.82 | 412,375 |
| Semporna | 94.29 | 40.62 | 19.58 | 5.8 | 1.45 | 137,868 |
| Kunak | 35 | 33.41 | 42.96 | 44.55 | 14.32 | 62,851 |
| Keningau | 79.89 | 104.65 | 131.66 | 59.64 | 51.2 | 177,735 |
| Nabawan | 142.38 | 157.85 | 201.18 | 145.47 | 235.23 | 32,309 |
| Tenom | 162.55 | 174.92 | 307.44 | 185.52 | 134.28 | 56,597 |
| Tambunan | 85.41 | 143.26 | 151.53 | 104.69 | 68.88 | 36,297 |
| Beaufort | 31.62 | 18.07 | 19.58 | 15.06 | 9.04 | 66,406 |
| Sipitang | 204.12 | 137.01 | 139.81 | 145.4 | 148.19 | 35,764 |
| Kuala Penyu | 0 | 5.15 | 0 | 0 | 0 | 19,426 |
| Tongod | 323.28 | 185.12 | 256.96 | 118.81 | 165.78 | 36,192 |
| Putatan | 0 | 1.79 | 0 | 1.79 | 0 | 55,864 |
Table 1: Incidence rate of malaria cases by the districts in Sabah.
Figure 2 shows Kriging interpolation method which has been applied based on incidence rate of every district for each year. The centre of Sabah shows very high level of malaria incidence rate above 100 per 100,000 populations which involves the entire Tongod district. As shown in Figure 2, the malaria incidences in this area were very high in the year 2012 and became reduced in year 2013. But it has increased again in 2014 with involving other districts in the northwest Sabah which were Kudat, Kota Marudu and Pitas districts. Kota Marudu and Pitas have the highest incidence rate throughout the 5 years based on this map. While in 2015, the incidence rate of malaria improved in most of the districts as incidence rate were below than 200 per 100,000 populations. Most of eastern Sabah districts showed low level of incidence rate ranging from 10 to 50 per 100, 000 populations. In 2016, other areas showed a reduction of incidence rate except in western part of Tongod, Tenom, Nabawan, eastern part of Keningau and Sipitang which recorded incidence rate rising above to 200 per 100,000 populations. In year 2012 and 2016, the Kriging map showed high incidence rates in the same area in 5 years which covering the centre and west of Sabah. Comparing Kriging map from year 2012 and 2016, the incidence rate of malaria has been reduced as more districts have lower incidence rate.
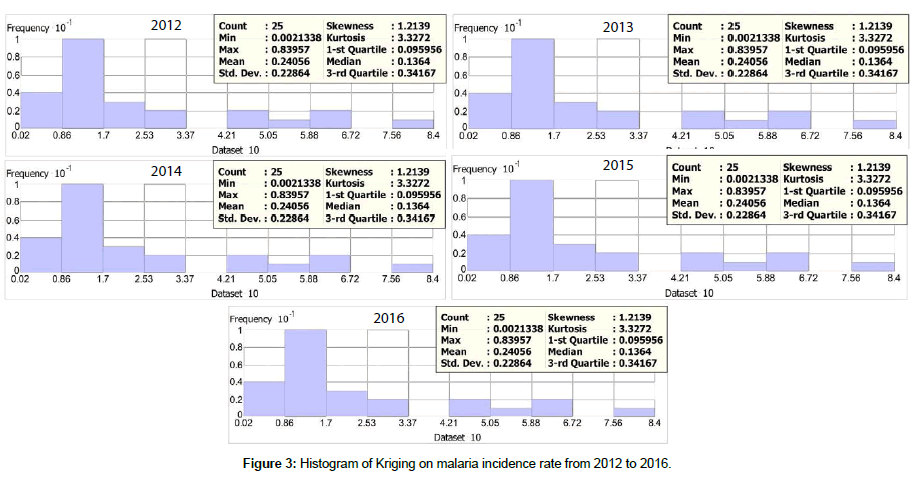
Based on Figure 3, the malaria incidence showed not normally distributed data. Since we choose the simple Kriging type, the dataset have been transformed into standard normal distribution.
Table 2 showed that all the p-value and Z-score were statistically significant in all 5 years. Moran’s I value which measures spatial autocorrelation indicates that value more than zero with p-value less than 0.05. This result indicates that spatial distributions of all years were in clustered pattern.
| 2012 | 2013 | 2014 | 2015 | 2016 | |
|---|---|---|---|---|---|
| *Incidence proportion | 64.14 | 50.08 | 55.47 | 32.55 | 22.35 |
| Moran's I | 0.4693 | 0.5172 | 0.4278 | 0.4032 | 0.2604 |
| Z (Moran) | 3.2048 | 3.4091 | 2.8946 | 2.7191 | 1.9487 |
| P- value | 0.0013 | 0.0006 | 0.0037 | 0.0065 | 0.0051 |
Table 2: Spatial autocorrelation of malaria cases in Sabah, from 2012 to 2016.
Discussions
The utilisation of GIS for malaria incidence was efficiently explained in this study. By using GIS analysis, the investigation on malaria incidence was explained by location. Results of this study indicate that the location-based analysis significantly predicts malaria incidence in five years in Sabah. The results suggest that high incidence rate were documented in 2012. This study demonstrates that geospatial analysis provides an opportunity to model spatial patterns of malaria disease distribution which may help in health planning and management. The results suggest an important phase towards developing a GIS-based method that could be useful as an intervention tool to control malaria. This finding is significant, which demonstrates a constant relationship between malaria incidence and spatial variation to let the vector control efforts to be directed at a specific area. This study would also help in increasing the effectiveness of control. Therefore, to draw meaningful conclusions about the malaria incidence, future studies may need to include the impact of malaria control interventions by spatial analysis.
Acknowledgements
We want to thank the Ministry of Health (MOH) of Malaysia through the Director-General of Health Malaysia, Deputy Director General of Health (Research & Technical Support) and the Director of Institute for Medical Research for making the malaria incidence data available for use in the writing of this paper. We also want to thank the Vector Unit MOH Malaysia and Sabah State Health Department for compiling the data as well as all MOH staff officers which involved in data collection.
References
- Ahmad R, Ali WNWM, Nor ZM, Ismail Z, Hadi AA, et al. (2011) Mapping of mosquito breeding sites in malaria endemic areas in Pos Lenjang, Kuala Lipis, Pahang, Malaysia. Malaria Journal 10: 1-12.
- Alimi TO, Fuller DO, Qualls WA, Herrera SV, Arevalo-Herrera M, et al. (2015) Predicting potential ranges of primary malaria vectors and malaria in northern South America based on projected changes in climate, land cover and human population. Parasites and Vectors 8: 1-16.
- Kiszewski A, Mellinger A, Spielman A, Malaney P, Sachs SE, et al. (2004) A global index representing the stability of malaria transmission. American Journal of Tropical Medicine and Hygiene 70: 486-498.
- Fernando D, Wijeyaratne P, Wickremasinghe R, Abeyasinghe RR, Galappaththy GN, et al. (2018) Use of a public-private partnership in malaria elimination efforts in Sri Lanka; A case study. BMC Health Services Research 18: 1-10.
- WHO (2017) World Malaria Report. World Health Organisation, Luxembourg, Europe.
- Fornace KM, Abidin TR, Alexander N, Brock P, Grigg MJ, et al. (2016) Association between landscape factors and spatial patterns of Plasmodium knowlesi infections in Sabah, Malaysia. Emerging Infectious Disease 22: 3-10.
- William T, Rahman HA, Jelip J, Ibrahim MY, Menon J, et al. (2013) Increasing Incidence of Plasmodium knowlesi Malaria following Control of P. falciparum and P. vivax Malaria in Sabah, Malaysia. PLoS Neglected Tropical Diseases 7: 1-9.
- Yusof R, Lau YL, Mahmud R, Fong MY, Jelip J, et al. (2014) High proportion of knowlesi malaria in recent malaria cases in Malaysia. Malaria Journal 13: 1-9.
- Yoep N, Hasim H, Yusoff UN, Yusoff M, Mahpot NR (2015) Spatio-Temporal Distribution of Malaria in Perak, Malaysia. Advances in Infectious Diseases 5: 154-161.
- Gwitira I, Murwira A, Zengeya FM, Shekede MD (2018) Application of GIS to predict malaria hotspots based on Anopheles arabiensis habitat suitability in Southern Africa. International Journal of Applied Earth Observation and Geoinformation 64: 12-21.
- Rytkonen MJ (2004) Not all maps are equal: GIS and spatial analysis in epidemiology. Int J Circumpolar Health 63: 9-24.
- Martin C, Curtis B, Fraser C, Sharp B (2002) The use of a GIS-based malaria information system for malaria research and control in South Africa. Health and Place 8: 227-236.
- Pam DD, Omalu ICJ, Akintola AA, Dan AY, Kalesanwo AO, et al. (2017) The role of GIS and remote sensing in the control of malaria. Online Journal of Health and Allied Sciences 16: 1-4.
- Moore DA, Carpenter TE (2005) Spatial Analytical Methods and Geographic Information Systems: Use in Health Research and Epidemiology. Epidemiologic Reviews 21: 143-161.
- Samat NA, Mey LW (2017) Malaria Disease Mapping in Malaysia based on Besag-York-Mollie (BYM) Model. Journal of Physics: Conference Series 890: 012167.
- WHO (2011) World Malaria Report 2011. World Health Organisation, Switzerland.
 Spanish
  Chinese
  Russian
  German
  French
  Japanese
  Portuguese
  Hindi
Hindi 


