 Spanish
  Chinese
  Russian
  German
  French
  Japanese
  Portuguese
  Hindi
Hindi Research Article, Geoinfor Geostat An Overview S Vol: 0 Issue: 0
Spatial Multi Criteria Evaluation (SMCE) Model for Landslide Hazard Zonation in Tropical Hilly Environment: A Case Study from Kegalle
Perera ENC1*, Jayawardana DT2, Ranagalage M3,4 and Jayasinghe P4
1Institute of Human Resource Advancement (IHRA), University of Colombo, Sri Lanka and Faculty of Graduate Studies University of Sri Jayewardenepura, Nugegoda, Sri Lanka
2University of Sri Jayewardenepura, Faculty of Applied Science, Department of Forestry and Environmental Science, Gangodawila, Nugegoda, Sri Lanka
3Graduate School of Life and Environmental Sciences, University of Tsukuba, 1-1-1 Tennodai, Tsukuba, Ibarak, Japan
4Department of Environmental Management, Faculty of Social Sciences and Humanities, Rajarata University of Sri Lanka, Mihintale, Sri Lanka
*Corresponding Author : Perera ENC
Institute of Human Resource Advancement (IHRA), University of Colombo, Sri Lanka and Faculty of Graduate Studies University of Sri Jayewardenepura, Nugegoda, Sri Lanka
Tel: 0094718203406
E-mail: chinssu@gmail.com
Received: August 20, 2018 Accepted: September 04, 2018 Published: September 15, 2018
Citation: Perera ENC, Jayawardana DT, Ranagalage M, Jayasinghe P (2018) Spatial Multi Criteria Evaluation (SMCE) Model for Landslide Hazard Zonation in Tropical Hilly Environment: A Case Study from Kegalle. Geoinfor Geostat: An Overview S3. doi: 10.4172/2327-4581.S3-004
Abstract
Landslide hazard is one of the most common global hazards. In Sri Lanka, landslides are considered as a disaster, and thus, scientific communities have paid attention to monitoring and prediction of landslide hazards. Landslide hazard zonation (LHZ) is a vital factor for preparedness and mitigation phases in a disaster management cycle. In the Sri Lankan contest, LHZ becomes more significant since 20% of the total lands are vulnerable. Spatial distribution of landslides of Sri Lanka is mainly influenced by geospatial criteria, rainfall distribution, geology, hydrology, geomorphology, land-use, and drainage network. However, the above factors do not equally contribute to determining the landslide susceptibility. This study attempted to map the landslide hazard zones in one of the tropical hilly region: Kegalle District and weighting causative factors rationally using statistical method in GIS environment. In this study, causative factors were weighted and modelled to define hazardous zones by geographical information system (GIS)- based spatial multi criteria evaluation (SMCE). The necessary geospatial data were obtained, processed, and converted into a grid format. The contribution level of each factor for triggering landslides was evaluated by the Analytical Hierarchy Process (AHP) and modelled with the SMCE. The developed SMCE model is at an acceptable level because the acquired consistency ratio value is 0.074 (≤ 0.1). The developed LHZ map shows a 90% level prediction accuracy compared to previous landslides. According to landslide hazard zonation map, 13% (227 km2) of the entire area is a very high landslide susceptible zone, while 37% (634 km2) of the total land area has a high susceptibility to slope failure. Moderate and low susceptible zones were 32% (542 km2) and 12% (203 km2) respectively, and only 6% (96 km2) of the entire study area belonged to the very low landslide susceptible zone.
Keywords: Landslides; Geospatial; Hazard zonation; Spatial model; Triggering factors, Sri Lanka
Introduction
Landslide is one of the most common destructive hazards, which has an increasing trend of global damage [1,2]. It causes approximately thousand deaths in a year with high economic loss worldwide and threatens on the settlement, transport, natural resources, and tourism [3]. Landslides are a common and recurring problem in tropical climatic conditions due to unexpected highintense rainfall conditions [4]. Due to the destructive consequences of landslides, researchers have attempted to define susceptible areas, there by promoting disaster mitigation and preparedness [5]. Brabb, et al. [6] revealed that 90% of landslide losses could beavoided by recognizing the incident. In this context, Landslide hazard zonation (LHZ) and susceptibility mapping play a vital role to identify the hazards areas before it occurs.
Landslide hazard investigations should consider location, volume, area, classification, potential velocity, detached materials, and the probability of occurrence [7]. Over the past decades, many approaches were taken to define the LHZ in landslide-prone regions due to the complexity involved in the landslide triggering mechanisms [8]. Initial approaches evaluated the spatial distribution of instability factors to determine the zones of landslide hot spots [6], including geotechnical factors of safety parameters [9]. The GIS-based LHZ method uses fuzzy logic, artificial neural network, decision tree models [10], and Spatial Multi-Criteria Evaluation (SMCE) model [11,12].
LHZ can be accomplished by providing risk managers with easily accessible, continuous, and accurate information on landslide occurrences. It is a safe and a speedy mitigation measure for strategic planning, and identifying the most vulnerable areas and channelizing majority of the protective measures and techniques to a more focused area [8]. In Sri Lanka, LHZ has become more significant. Hence, urban planners and developers must know the overall landslide potential of a site to plan the future developments economically and effectively in these hilly regions.
The mountain cities of tropical area are coming more vulnerable to converting more natural land surface in to built-up land due to the rapid urbanization [13]. The converting greener spaces in to impervious surface has been resulted to occurring environmental problems [13,14]. The land use changes affected to occur landslide [15]. The central highlands of Sri Lanka are frequently threatened by landslides due to rapid land use changes. However, it is evident that frequency and severity of landslides in the tropical hilly areas are increasing with human intervention and rapid urbanization in tropical hilly regions [16,17]. This study attempts to weight landslide causative factors rationally using statistical method in GIS environment to map the landslide hazard zones for the Kegalle district. Outcomes of the study can be incorporated with landslide disaster risk reductions plan of the country tropical hilly areas
Study Area
Physical setting, climate and geology of Kegalle District
The central highland of Sri Lanka is frequently threatened by landslides, making it the most destructive natural disaster [2]. Out of twenty-five administrative districts in Sri Lanka, ten districts are prone to landslides. It is evident that the frequency and severity of landslides in the country have increased during the recent past [18].
The most significant causative factors for landslides are rainfall, geology, chemical weathering of the basement, hydrology, steep topography, land-use, and soil [18,19]. However, the causative factors of the landslides do not equally contribute to triggering a slope failure; in fact, quantifying the level of contribution of each factor is difficult. In Sri Lanka, landslide hazard zonation was materialized assuming equal levels of contribution weights to factors without a scientific approach.
The Kegalle district is located in the wet and intermediate zones of the country, which is north of the equator, and having tropical climatic conditions (Figure 1). The area receives heavy rains during rainy periods (May-September, South-west monsoon; October-November, inter-monsoon) and bright sunshine during the dry season (January-March), aligned with tropical climatic conditions. The mean annual rainfall in the district is from 2,500 to 3,000 mm and the average annual temperature varies from 25°C to 28°C.

Figure 1: Location map of the study area with general topography and landslide locations.
The Kegalle district, one of the major semi-urban districts of Sri Lanka, has a total area of 1,693 km². The highest percentage of land in the district is covered by home gardens (35%; 595 km2), and rubber is the main cultivation crop (31%; 525 km2). The other main crops are tea, coconut, and paddy. Paddy covers 6.3% of the total land (107 km2), while tea and coconut comprise 2.5% and 3.9% lands respectively.
The district is geologically situated in the western plains of the central highland. The land mass of the district is made up of metasedimentary and concordant meta-igneous rocks of Precambrian age. The eastern section of the district exhibits continuation of the north, and northwest trending fold structures of the hill country [20]. Most of the soils have either developed in residual materials derived by weathering of the bedrock or in the weathering materials that have been transformed for short distance. Red-yellow podzolic is the dominant soil group of the district.
Materials and Methods
In this study, causative factors have been weighted and modeled to define hazardous zones with the support of GIS-based SMCE methods. Multi-criteria evaluation is performed by optimal and prioritization and defined based on alternative, value, criteria, and the weights on the criteria [21].
Spatial multi-criteria evaluation (SMCE) model for Landslide hazard zonation (LHZ)
SMCE is relatively a new approach evaluating causative factors to determine and classify the LHZ [22]. Data collection is a primary step in LHZ. The causative factors of relevant landslide were extracted for developing a spatial database to identify the existing and potential unstable slopes in the Kegalle district. Figure 2 illustrates the spatial distributions of landslide causative factors.

Figure 2: Spatial distribution of landslide causal factors in Kegalle District; (a) Slope (b) Aspect (c) Soil (d) Lithology (e) Rainfall (f) Land use (g) Distance from stream (h) Distance from road.
Development of spatial database for landslide causative factors
There are no universal guidelines regarding the selection and ranked the factors in landslide hazard zonation mapping [23]. One factor may be highly influencing factor for landslide occurrence in a certain area but not in another one. The selection of causal factors and quantifying level of their contribution to induce landslide depends on the nature of the study area. However, when identifying the factors which are responsible for landslides, slope aspect, geology, soil type, land use, proximity to drainage and proximity to roads can be considered as some of the key factors according to nature of the Kegalle district [24].
Several researches has shown that relationship between slope and landslide occurrence, it has noticed that probability of occurrence of landslides is high when the slope angle is in between 150 and 450 and it is relatively low when it is more than 450 [25]. Therefore, as the first step Digital Elevation Model (DEM) of the study area was produced by using 1: 10,000 scale topographic maps obtained from department of survey of Sri Lanka. The slope and slope aspect parameters were derived from generated 100 × 100 m DEM, as shown in Figure 2(a) and 2(b). Assuming that the slope angle increases up to 50 degrees the impact is also expected to increase because slope between 40 and 50 are most susceptible. According to [24], rates for landslides in Sri Lankawere assigned from 1 to 5 and different slope categories are assigned as given in Table 1.
| Major factor | Sub factors | Rate |
|---|---|---|
| Slope | 0-10 | 1 |
| 10-20 | 2 | |
| 20-30 | 3 | |
| 30-40 | 4 | |
| 40-50 | 5 | |
| >50 | 3 | |
| Aspect | Flat | 1 |
| North | 2 | |
| Northeast | 3 | |
| East | 4 | |
| Southeast | 5 | |
| South | 6 | |
| Southwest | 7 | |
| West | 8 | |
| Northwest | 9 | |
| Soil | Immature Brown Loams; steeply dissected, hilly and rolling terrain | 1 |
| Red-Yellow Podzolic soils and Mountain Regosols; mountainous terrain | 2 | |
| Red-Yellow Podzolic soils with soft or hard laterite; rolling and undulating terrain | 3 | |
| Red-Yellow Podzolic soils with strongly mottled subsoil and Low Humic Gley soil | 4 | |
| Red-Yellow Podzolic soils; steeply dissected, hilly and rolling terrain | 5 | |
| Reddish Brown Latosolic soils; steeply dissected, hilly and rolling terrain | 6 | |
| Steep Rockland and Lithosols | 7 | |
| Lithology | Granite Gneiss | 1 |
| Charnockitic Gneiss | 2 | |
| Impure quartzite and quartz schists | 3 | |
| Hornblende biotite migmatites | 4 | |
| Calc Gneisses and granulites | 5 | |
| Alkali Feldspar Granite Gneiss | 6 | |
| Daily rainfall intensity (mm/day) | 225-260 | 1 |
| 260-295 | 2 | |
| 295-330 | 3 | |
| 330-365 | 4 | |
| 365-400 | 5 | |
| Land use | Build-up | 2 |
| Forest | 3 | |
| Home gardens | 4 | |
| Paddy | 1 | |
| Rock | 5 | |
| Rubber | 6 | |
| Tea | 6 | |
| Water | 1 | |
| Distance from stream (m) | > 500 | 1 |
| 200-500 | 2 | |
| 100-200 | 3 | |
| 50-100 | 4 | |
| 0-50 | 5 | |
| Distance from road (m) | >500 | 1 |
| 200-500 | 2 | |
| 100-200 | 3 | |
| 50-100 | 4 | |
| 0-50 | 5 |
Table 1: The Landslide causative factors, their subcategories and relative rates.
Soil properties such as particle size and pore distribution of the soil matrix can influence slope stability [26]. The soil types were acquired from a 1:10,000 scale soil map generated by GSMB and seven different soils types were identified and soil map was calibrated through field visits and shown in Figure 2(c). Rate was assigned to each soil classes considering weakness and likelihood for landslides (1-7) as shown in Table 1 [19].
One of the key factors of landslide occurrence is geological setting of the area; geology is an indicator of bedrock conditions, weak, sensitive and sheared material, the presence of fissures and joints, and contrasts in permeability or stiffness of the slope forming material. Field observations have shown that most landslides in the district move predominantly by sliding along discrete shear surfaces and landslide occurred due to rapid weathering of rocks. Lithology of the district was derived from geological map with 1:10,000 scale from GSMB of Sri Lanka. It has found that fifteen different lithological groups based on their first rock in the region as shown in Figure 2(d). Lithological groups were classified into six landslide conditioning classes and rates were assigned according to their tendency to landslides (1-6) as shown in Table 1.
The majority of landslides are triggered by rainfall, but earthquakes and other phenomena may also trigger landslides all over the world, however in Sri Lankan contexts only rainfall trigger landslide [27,28]. The rainfall distribution map was developed by interpolating mean value of last 30 years daily rainfall intensity data, which were obtained from 97 rain gauge stations using kriging interpolating method [29]. Rainfall intensity distribution shown in Figure 2(e), rainfall intensity was classified into five intervals and ranked assuming that increasing of rainfall intensity increases the landslide tendency [30].
Land use type can be considered as another conditioning factor and land use type mainly interact with the human pressure [24]. As a result of population growth people moved to marginal uplands which are not suitable for residential purpose. The uplands are cleared for more short-term cash crops and home gardens. Further, larger extent of tea, rubber plantations had been cleared for shifting cultivation and varies plantation in Kegalle district. The uprooting of rubber and tea results in creating loose soils and thereby increases in water infiltration. The poor surface water management at tea plantation in district is also a contribution to unstable slopes and landslides. In order to study land use, 1: 10,000 scale land-use map were obtained from the land use and policy planning department of Sri Lanka, published in year 2014. Obtained land used map was calibrated and updated using ground control points (GCPs) during the field work. Land use map was classified into eight land cover types namely build-up up area, forest, home gardens, paddy, rock, rubber, tea and water as shown in Figure 2(f). Different land use classes were ranked according to their likelihood toward slope stability.
The likelihood of landslides increases with a decrease in distance to rivers [31]. Therefore, the distance to streams is another factor to be considered. Buffers were created at 50 m, 100 m, 200 m and 500 m distances from the river network Figure 2(g) and ranked assuming that away from the drainages the landslide occurrences to decrease as shown in Table 1 [23].
Landslides may also occur on the slopes intersected by roads. The cutting toe of the steep slope, filling along the road and frequent vibrations caused by vehicles are some human activities in mountain areas that raise the occurrence of landslides. Buffers were created at 50 m, 100 m, 200 m and 500 m distances from the road and assigned rates for buffer zones assuming that road impact is expected to decreases further away from the roads.
In this study, above mentioned all eight factors i.e. land-use, lithology, soil, aspect, daily maximum rainfall intensity, proximity to road, proximity to streams and slope were reclassified into classes in order to make the same output scaling of 0-255 having 100 × 100 m raster grid and transformed to GCS Kandawala geographic coordinate system. Geospatial data base was developed for landslide causative factors in GIS environment using ArcGIS 10.2 and ILWIS 3.2.
Model of the landslide hazard zones
Landslide hazard zonation process was implemented with weighting causative factors according to their relative contribution to trigger the landslide using SMCE method of AHP [32]. AHP has applied to a wide variety of decisions, and the human judgment process has many criteria [31]. Further, the AHP can provide an analytical process that can combine and consolidate the contribution of landslide causative factors into the LHZ map [21,23].
Landslide causative factors were subjected to series of pairwise comparisons by expert team consists of professionals, academics and industrial experts and assigned numerical values for each factor considering their relative importance to slope failure, with respect to a 9-point intensity of relative importance scale proposed by previous studies [33]. The pair-wise comparisons were done base on the understanding of combination of causative factors for triggering historic landslides which were obtained from the filed surveys and existing literature [23,24]. Resultant pair-wise comparison matrix is given in Table 2.
| Factor | Slope | Aspect | Soil | Lithology | Land use | Rainfall intensity | Proximity to stream | Proximity to road |
|---|---|---|---|---|---|---|---|---|
| Slope | 1 | |||||||
| Aspect | 1/3 | 1 | ||||||
| Soil | 1/2 | 3/2 | 1 | |||||
| Lithology | 2 | 6 | 4 | 1 | ||||
| Land use | 1/2 | 3/2 | 1 | 1/8 | 1 | |||
| Rainfall intensity | 4 | 12 | 8 | 2 | 8 | 1 | ||
| Distance to stream | 1/5 | 3/5 | 2/5 | 1/10 | 2/5 | 1/20 | 1 | |
| Distance to road | 1/5 | 3/5 | 2/5 | 4/5 | 2/5 | 1/20 | 1 | 1 |
Table 2: Pair-wise comparison matrix.
These pairwise comparisons were then analysed to produce a set of weights.
Then, pair-wise comparison matrix was normalized by Eqn. 1.
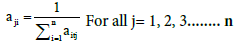 (1)
(1)
Then the vector of weights for the normalized pair-wise comparison matrix was computed W= [w1, w, w3,….], based on the Satty’s eigenvector procedure, using Eqn. 2.
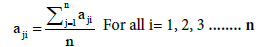 (2)
(2)
Weight computed, normalized pair-wise comparison matrix is known as the Judgment matrix. Let, [A]8×8 be the judgment matrix, then [A]8×8 is given in Table 3.
| Factors | Slope | Aspect | Soil | Lithology | Land use | Rainfall | Proximity | Proximity | Weight |
|---|---|---|---|---|---|---|---|---|---|
| intensity | to stream | to road | (W) | ||||||
| Slope | 0.13 | 0.11 | 0.11 | 0.1 | 0.09 | 0.11 | 0.11 | 0.11 | 0.11 |
| Aspect | 0.04 | 0.04 | 0.04 | 0.03 | 0.03 | 0.04 | 0.04 | 0.04 | 0.04 |
| Soil | 0.06 | 0.05 | 0.06 | 0.05 | 0.05 | 0.06 | 0.06 | 0.06 | 0.06 |
| Lithology | 0.26 | 0.21 | 0.23 | 0.2 | 0.37 | 0.23 | 0.23 | 0.23 | 0.25 |
| Land use | 0.06 | 0.05 | 0.06 | 0.03 | 0.05 | 0.06 | 0.06 | 0.06 | 0.05 |
| Rainfall intensity | 0.52 | 0.5 | 0.46 | 0.4 | 0.37 | 0.46 | 0.46 | 0.46 | 0.45 |
| Proximity to stream | 0.03 | 0.02 | 0.02 | 0.02 | 0.02 | 0.02 | 0.02 | 0.02 | 0.02 |
| Proximity to road | 0.03 | 0.02 | 0.02 | 0.16 | 0.02 | 0.02 | 0.02 | 0.02 | 0.04 |
Table 3: Normalized pair-wise comparison matrix (Judgment matrix).
A relationship exists between the vector weights, W, and the judgment matrix [A]8×8 [32] as shown in Eqn. 3.
 (3)
(3)
The λmax value is an important validating parameter in AHP and is used as a reference index to screen information by calculating the consistency ratio (CR) of the estimated vector. Then λmax was obtained by Eqn. 3, which equals to 8.74.
To calculate the CR, the consistency index (CI) for each matrix of order n can be obtained from Eqn. 4 [21]
 (4)
(4)
Obtained CI value is 0.106.
Then, CR can be calculated using Eqn. 5
 (5)
(5)
Where RI is the random consistency index obtained from a randomly generated pair-wise comparison matrix. Table 4 presents the value of the RI from matrices of order 1 to 10 as suggested by Satty [32]. There are eight factors where RI is equal to 1.46 (Table 4). Then the CR is 0.075.
| N | 1 | 2 | 3 | 4 | 5 | 6 | 7 | 8 | 9 | 10 |
|---|---|---|---|---|---|---|---|---|---|---|
| RI | 0.00 | 0.00 | 0.58 | 0.90 | 1.12 | 1.24 | 1.32 | 1.41 | 1.46 | 1.49 |
Table 4: Random inconsistency indices (RI) for n=10.
If CR is <0.1 then the comparisons are acceptable. However, when CR ≥ 0.1, then the values of the ratio are indicative of inconsistent judgments. As the obtained CR value is 0.074(≤ 0.1), the comparisons are inconsistent.
Finally, each factor was multiplied by its derived weight and then the results composited to produce the landslide hazard map using Eqn. 6.
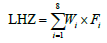 (6)
(6)
LHZ=0.11 × slope+ 0.04 × aspect+0.06 × soil+0.25 × lithology+0.05 × land-use+0.45 × rainfall intensity + 0.02 × proximity to stream+0.04 × proximity to road.
Results and Discussion
The developed hazard zonation map was reclassified into different classes as low hazard, moderate hazard, high hazard, and very high landslide hazards as shown in Figure 3a. Table 5 summarises the area calculated under different hazard levels. Accuracy assessment for the model was calibrated by using 63 past landslide locations obtained from the high-resolution imagery of Google Earth Pro, which was further ananalyzed using NBRO information and target field visits around the district. Finally, hazardous levels were summarised into each DS division using zonal statistical methods as shown in Figure 3b.

Figure 3: Landslide hazard zonation and landslide hazard zonation for different divisions.
| DS division | The area covered by different hazardous levels | ||||||||||
|---|---|---|---|---|---|---|---|---|---|---|---|
| Very low | Low | Moderate | High | Very high | Total (km2) | ||||||
| Area (km2) | % | Area (km2) | % | Area (km2) | % | Area (km2) | % | Area (km2) | % | ||
| Aranayake | 1.23 | 1 | 1.63 | 1 | 80.43 | 58 | 54.10 | 39 | 1.00 | 1 | 138.39 |
| Mawanella | 3.67 | 3 | 20.64 | 18 | 68.82 | 60 | 21.55 | 19 | 0.01 | 0 | 114.69 |
| Rambukkana | 47.88 | 30 | 54.20 | 34 | 54.88 | 35 | 1.49 | 1 | 0.00 | 0 | 158.44 |
| Kegalle | 1.86 | 1 | 9.64 | 7 | 54.29 | 41 | 60.40 | 45 | 7.35 | 6 | 133.54 |
| Galigamuwa | 11.71 | 7 | 27.92 | 16 | 55.55 | 32 | 73.66 | 42 | 6.09 | 3 | 174.93 |
| Warakapola | 15.01 | 7 | 32.15 | 16 | 58.00 | 29 | 76.42 | 38 | 19.81 | 10 | 201.38 |
| Ruwanwella | 4.63 | 3 | 15.90 | 10 | 48.41 | 30 | 71.04 | 44 | 20.60 | 13 | 160.57 |
| Yatiyanthota | 0.20 | 0 | 10.51 | 5 | 65.42 | 32 | 89.12 | 44 | 37.65 | 19 | 202.90 |
| Dehiovita | 10.04 | 4 | 25.30 | 10 | 50.89 | 21 | 118.06 | 49 | 37.65 | 16 | 241.94 |
| Deraniyagala | 0.00 | 0 | 0.00 | 0 | 1.57 | 1 | 67.95 | 41 | 96.56 | 58 | 166.08 |
| Total (km2) | 96 | 6 | 198 | 12 | 538 | 32 | 634 | 37 | 227 | 13 | 1693 |
Table 5: Comparison of information obtained from the LHZ for different divisions.
Validation of LHZ map using past landslides
The accuracy of the developed model was verified by comparing with the hazardous level, and the number of past landslides overlaps on it [12]. It revealed that more than 90% of the past landslides belong to high or very high hazard zones (Figure 3a). Further, the literature also reveals that the SMCE methods have a secure potential from 70% to 95% level of accuracy in LHZ [12]. In addition, the developed LHZ models indicated sufficient level of accuracy to predict future landslide hazards within the district. The SMCE model produces the highest accuracy level when compared with other landslide zonation approaches [34].
Distribution of the landslide hazardous level within the study area
According to the landslide hazard zonation map, 13% (227 km2) of the entire area were very high landslide susceptibility zone, and 37% (634 km2) of the total land area was of high susceptibility to slope failure. Moderate and low susceptible zones showed 32% (542 km2) and 12% (203 km2) respectively, and the very low landslide susceptible zone is 6% (96 km2) for the entire study area (Figure. 3a, Table 5).
The study area displays either high relief or slope near the river network, or near to road and tea and Rubber plantations with weak and/or weathered materials. With the influence of high-intensity rainfall, these areas could lead to landslides. Only 18% (294 km2) of the district has lower and very lower hazard levels. However, 32% of land area can be considered as a moderately hazardous area (538 km2; Table 5).
According to the analyses, Deraniyagala shows a very high hazardous region because 58% of land area falls on very high hazard category (Table 5), and the most hazardous district secretariat division (DSD) of Kegalle. Dehiowita DSD is also classified as a high hazard zone (Figure 3b). Most of the severe landslides were recorded in Kegalle DSD and Deraniyagala DSD, affecting 3,342 and 2,756 people in the year 2016 respectively [35]. The Aranayake DSD experienced the worst ever-recorded landslide in Sri Lanka in 2016. This landslide buried 14 families and wiped out 127 lives while affecting 3,210 families [36]. However, in this model, Aranayake DSD is categorized as a moderate landslide hazard area (Figure 3b, Table 5) since the landslide locations area cluster in to the very small region (1%; Table 5). This landslide triggered was by a 435-mm cumulative rainfall within 72 hrs, which is an extreme condition; the return period of such extreme conditions is very high. High intense rainfall is the primary driver of the enhanced hazard of landslides only in Aranayake. There, a landslide is often clustered in space and time, and significant events are primarily driven by synoptic scale variability [37]. Conversely, Warakapola and Ruwanwella DSDs located in the flat terrain received comparatively low rainfall. As these regions consist of stable geological and geomorphological conditions, they are considered as low hazardous regions (Figure 3b). No landslides were reported in Rambukkana DSD, and the combinations of landslide triggering factors are limited. Hence, the area is categorized as a landslide-free zone in the district [35].
As the area is mostly mountainous with terrace tea plantation, there is always a moderate probability that intense and prolonged rainfall could lead to slope instability, since the causes of landslides are usually related to instabilities in slopes. Very high hazard zones and high hazard zones fall in between slope angles 150 and 450 regions; this pattern is common to most landslide-prone areas all over the world [38]. Plantations indicate a high hazard compared to open rock outcrops and forest covers.
However, landslides may occur in low hazard and very low hazard zones as well (Figure 3a) due to excessive placements in the respective area. Field observation and Google earth images confirmed that such areas were subjected to rapid land use changes, such as conversion of forest area to rubber or tea plantation. The literature confirmed the overall susceptibility to slope movement is highly dependent on the recent land use change [39]. Land use change may be a significant reason for landslides in low hazard zones.
In this study, some areas from Deraniyagala DS division were identified as high hazard zones and very high hazard zones due to high order combination of causative factors, though no landslide occurred in that region. According to Highland, et al. [39], the probability of landslides does not depend on the past landslide history; it is a function of causative factors.
It revealed that the south-western region of the study area could be categorized as high and very high hazard zones. Slope angle over 30° with terrain elevations higher than 500 meters plus the rainfall factor can be considered as hazardous. Further, land usage has a higher potential to trigger the landslides, and the level of the hazard may vary with the rate of change inland use patterns [40].
Improve the accuracy of LHZ model
This study was conducted based on static landslide causative factors however, field observations confirmed that rapidly change in land use types by human activities. Therefore, it is recommended to incorporate dynamic causative factor such as rate of change of land use instead of land use to improve the sustainability of LHZ map because the hazard level posed by landslides will change with land use change. Further it is recommended use rainfall probability into landslide hazard assessment; it will be provided new insight into hazard evaluation.
Conclusion
Landslides are uncertain and instant events causing damage to life and property. Therefore, it is not possible to develop a model of uncertainty with 100% accuracy. However, landslides can be systematically managed even though comprehensive prevention is impossible. Hence, landslide hazard zonation is essential. The SMCE model together with GIS is a powerful tool that can predict and map landslide hazard zones at sufficient accuracy levels. For the future development and strengthening of this model additional factor such as; characteristics of discontinuity surfaces, interrelationships of discontinuities, pore water pressure in soil mass, water forces acting within the discontinuity surfaces, shape factor of particles in coluvial material may be considered.
The developed SMCE model is at an acceptable level because the obtained consistency ratio value is 0.074 (≤ 0.1). Further, developed LHZ map showed 90% level prediction accuracy, compared to previous landslides. Therefore, it can be concluded that this approach is useful for providing information for preliminary planning and assessment of landslide hazards. The local authorities could use the findings of this study to manage landslides correctly and systematically and plan development within the Kegalle district.
This landslide hazard zonation map can be used for optimum management by decision makers and land use planners and engineers to decrease losses caused by current and also future landslides through suitable prophylactic assessments and minimization procedures. Further LHZ map can be used to develop appropriate policies in consultation with the local people and encourage their participation is an alternative mitigation strategy based on their indigenous practices.
Acknowledgement
We extend our thanks to Research Council, University of Sri Jayewardenepura and Centre for Forestry and Environment for their support. This study was supported by a Faculty of Graduate Studies, University of Sri Jayewardenepura for Ph.D. candidate Mr. E.N.C. Perera.
References
- Cigna F, Tapete D, Lee K (2018) Geological hazards in the UNESCO World Heritage sites of the UK. Earth-Science Reviews 176: 166-194.
- Silvano S, Munasinghe D (2008) Quantitative landslide risk assessment and risk management in mountain risks intensive course, National Building Research Organization, Colombo, Sri Lanka.
- Karsli F, Atasoy M, Yalcin, A, Reis S, Demir O, et al. (2009) Effects of land-use changes on landslides in a landslide-prone area. Environ Monit Assess 156: 241-255.
- Larsen MC, Simon A (1993) A rainfall intensity-duration threshold for landslides in a humid-tropical environment Puerto Rico. Geografiska Annaler. Series A Physic Geo 75: 13-23.
- Hölbling D, Clemens E, Albrecht F, Vecchiotti F, Friedl B, et al. (2017) Comparing manual and semi-automated landslide mapping based on optical satellite images from different sensors. Geosciences 7: 7-37.
- Brabb EE, Pampeyan EH, (1972) Preliminary map of landslide deposits in san mateo county california. us geological survey miscellaneous field studies. Map MF-360, USGS, Reston, Virginia.
- Fell R, Corominas J, Bonnard C, Cascini L, Leroi E, et al. (2008) Guidelines for landslide susceptibility, hazard and risk zoning for land-use planning. Eng Geol 102: 99-11.
- Marrapu BM, Jakka RS (2014) Landslide hazard zonation methods: A critical review. Int J Civil Eng Res 5: 2278-3652.
- Zhou G, Esaki T, Mitani Y, Xie M, Mori J (2003) Spatial probabilistic modelling of slope failure using an integrated GIS Monte Carlo simulation approach. Eng Geol 68: 373-386
- Pourghasemi HR, Rahmati O (2018) Prediction of the landslide susceptibility: Which algorithm, which precision. Catena: Elsevier 162: 177-192.
- Abella EC, Van Westen C (2007) Generation of a landslide risk index map for Cuba using spatial multi-criteria evaluation. Landslides 4: 311-325.
- Othman AN, Mohd W, Naim WM, Noraini S (2012) GIS-based multi-criteria decision-making for landslide hazard zonation. Procedia; Soc Behaviour Sci 35: 595-602.
- Ranagalage M, Dissanayake D, Murayama Y, Zhang X, Estoque RC, et al (2018) Quantifying surface urban heat island formation in the world heritage tropical mountain city of Sri Lanka. ISPRS Int J Geoinfor 7: 341.
- Ranagalage M, Estoque RC, Murayama Y (2017). An urban heat island study of the Colombo metropolitan area, Sri Lanka, based on landsat data (1997–2017): ISPRS Int J Geoinfor 6: 189.
- Glade T (2003) Landslide occurrence as a response to land use change: a review of evidence from New Zealand. Catena 51: 297-314.
- Ranagalage M (2017) Landslide hazards assessment in nuwara eliya district in Sri Lanka. In the proceedings of Japanese Geographical meeting, Tokyo, Japan.
- Ratnayake U, Herath S (2005) Changing rainfall and its impact on landslides in Sri Lanka. J Mountain Sci 2: 218-224.
- Perera ENC, Jayawardana DT, Jayasinghe P (2017) A rainfall intensity-duration threshold for mass movement in Badulla, Sri Lanka. J Geosci Environ Protection 5: 135-152.
- Jayasingha P (2016) Social geology and landslide disaster risk reduction in Sri Lanka. J Tropical Forestry Environ 6: 1-13.
- Cooray PG (1967) An introduction to geology of Sri Lanka (Ceylon) (2nd edn) Stanford University, California, USA.
- Lotfi S, Habibi K, Koohsari MJ (2009) An analysis of urban land development using multi-criteria decision model and Geographical Information System: A Case Study of Babolsar City. American J Environ Sci 5: 87-93.
- Nsengiyumva JB, Luo G, Nahayo L, Huang X, Cai, P (2018) Landslide susceptibility assessment using spatial multi-criteria evaluation model in Rwanda. Int J Environ Res Public Health 15: 243.
- Shahabi H, Hashim M (2015) Landslide susceptibility mapping using gis-based statistical models and remote sensing data in tropical environment. Scientific Reports 5: 1-15.
- Jayasinghe GJMSR, Wijekoon P, Gunatilake J (2017) Landslide susceptibility assessment using statistical models: A Case Study in Badulla District, Sri Lanka. Ceylon J Sci 46: 27-41.
- Chen XL, Liu CG, Chang ZF, Zhou Q (2015) The relationship between the slope angle and landslide size derived from limit equilibrium simulations. J Geomorphology 253: 243-263.
- Kitutu MG, Muwanga A, Poesen J, Deckers JA (2009) Influence of soil properties on landslide occurrences in Bududa district, Eastern Uganda. African J Agricul Res 4: 611-620.
- Rathnaweera TD, Palihawadana MP, Rangana HLL, Nawagamuwa UP (2012) Effects of climate change on landslide frequencies in landslide Prone Districts in Sri Lanka; Overview. Civil Eng Research Exchange Symposium, University of Ruhuna, Sri Lanka.
- Wijemannage ALK, Ranagalage M, Perera ENC (2016) Comparison of spatial interpolation methods for rainfall data over Sri Lanka. In the proceedings of Asian Conference in Remote Sensing, Colombo Sri Lanka.
- Ayele S, Raghuvanshi TK, Kala PM (2014) Landscape ecology and water management. In Singh RB, Hassan MI (eds) Landscape ecology and water management, Springer, USA.
- Lee WB, Lau H, Liu Z, Tam S (2011) A fuzzy analytical hierarchy process approach in modular product design. Expert Sys 18: 32-42.
- Satty TL (1980) Analytic hierarchy process (1st edn) McGraw-Hill, New York. USA.
- Saaty TL, Vargas LG, (2012) Concepts & applications of the analytic hierarchy process (2nd edn) Kluwer Academic Publishers, Netherlands.
- Hong H, Pradhan B, Sameen MI, Wei C, Chong X (2017) spatial prediction of rotational landslide using geographically weighted regression, logistic regression and support vector machine models in Xing Guo Area (China). Geomatics Natural Hazards Risk 8: 1997-2022.
- Ministry of Disaster Management Sri Lanka (2016) Sri Lanka post-disaster needs assessment - floods and landslides-May 2016, Colombo, Sri Lanka.
- Perera ENC, Jayewardene DT, Jayasinghe P, Bandara RMS, Alahakoon N (2018) Direct impacts of landslides on socio- economic systems: A case study from Aranayake, Sri Lanka. Geoenviron Disasters 11: 2-12
- Biasutti M, Seager R, Kirschbaum DB (2016) Landslides in west coast metropolitan areas: The Role of extreme weather events. Weather and Climate Extremes 14: 67-79.
- Marston R, Miller M, Devkota L (1998) Geoecology and mass Movements in the Manaslu Ganesh & Langtang-Jural Himals, Nepal. Geomorphology 26: 139-150.
- Reichenbach P, Busca C, Mondin AC, Rossi M. (2014) The influence of land use change on landslide susceptibility zonation: The briga catchment test site (Messina, Italy).Environ Manage 54: 1372-1384.
- Highland LM, Bobrowsky P (2008) The landslide handbook - A guide to understanding landslides US Geological Survey Circular, Reston, Virginia.
- Promper C, Puissant A, Malet JP, Glade T (2014) Analysis of land cover changes in the past and the future as contribution to landslide risk scenarios. Appl Geo 53: 11-19.

