Research Article, Dent Health Curr Res Vol: 7 Issue: 3
To Assess Variation in Buccal Bone Thickness and Height of the Alveolar Bone as a Result of Transverse Dimensional Changes in Maxillary Arch in Patients Undergoing Orthodontic Treatment with Passive Self-ligating Bracket System using Cone Beam Computed Tomographic Images
Vandana S*
Department of Orthodontics, AECS Maaruti College of Dental Sciences & Research Center, Bengaluru, India
- *Corresponding Author:
- Vandana S
Department of Orthodontics, AECS Maaruti College of Dental Sciences & Research Center, Bengaluru (560076), India
Tel: 91855340994
E-mail: vandanasriram92@gmail.com
Received Date: January 10, 2020; Accepted Date: March 09, 2021; Published Date: March 16, 2021
Citation: Vandana S (2021) To Assess Variation in Buccal Bone Thickness and Height of the Alveolar Bone as a Result of Transverse Dimensional Changes in Maxillary Arch in Patients Undergoing Orthodontic Treatment with Passive Self-ligating Bracket System using Cone Beam Computed Tomographic Images.. Dent Health Curr Res 7:3.
Copyright: © All articles published in Dental Health: Current Research are the property of SciTechnol, and is protected by copyright laws. “Copyright © 2021, SciTechnol, All Rights Reserved.
Abstract
Self-ligating bracket manufacturers claim that expansion of arches and alveolar bone building is facilitated by their bracket design. And DAMON practitioners believe that significant amount of transverse arch development occurs. In selected patients, use of DAMON SLB converts the borderline cases to non-extraction treatment. There are limited studies carried out to prove the claims. And there are no much studies in literature to assess the health of the buccal alveolar bone as a result of transverse arch development of using SLB. The objective of this study was to determine the amount of transverse changes and its effect on buccal bone changes of using a DAMON passive SLB in maxillary during orthodontic treatment.
Methods: Study models and Cone beam computed tomography (CBCT) images were obtained before and after 10 months into treatment when patients were on 18*25. 14 patients satisfying inclusion criteria were selected for the study. The CBCT images were taken at Table 1and Table 2, for measuring transverse dimensions, buccal bone height and thickness at the maxillary first molars, maxillary second and first premolars using galileos software. Differences for each variable measured at to and Table 3 were compared.
Results: BBT at 3mm was increased (p<0.04) except at 14(p=0.81), BBT at 6mm increased in premolars (p<0.001) but was slightly decreased in 1stmolars (p=0.89). BBH increased significantly for the premolars (p<0.00) and molars (p<0.001) except for 15 where it was decreased(p=0.007). Transverse arch dimensions were significantly increased (p<0.00).
Conclusions: Non-extraction alignment with DAMON passive selfligating brackets led to significant amount of arch development in premolar region. BBT was increased except in 14 at 3 mm, and in molar at 6mm from CEJ. BBH increased except in 15, in contrary to the findings of the previous studies. However, as a result of shorter treatment duration of the study, a long term follow-up is required to further consolidate the findings of our study.
Keywords: CBCT, Buccal bone thickness, Buccal bone height, Self-ligating brackets.
Introduction
Orthodontic specialty wouldn’t have existed if human dentition were not to have periodontium, which help us in providing good smile.
Though the thickness of periodontal ligament is just 0.25 mm it is a highly effective structure that holds the teeth firmly. Its reparative function takes up the responsibility of remodeling the alveolar bone.
To achieve successful and stable treatment outcome, both the limitations and possibility of orthodontic tooth movement must be understood and respected in order to prevent iatrogenic effects to the periodontium such as gingival recession, dehiscence and bone fenestrations [1]. During anterior-posterior movement of anterior and transverse movement of the posteriors special care has to be taken to prevent such effects (Tables 1-3).
Research has shown evidence of better tissue response of bone to light continuous forces. These biologically consistent forces not only aid in more predictable tooth movements [2] but also decrease abusive effect on periodontium there by aid in maintaining better bone integrity from pre to post treatment phases [2-4].
Realistically speaking light forces can be effective only if the factor of friction is taken out of the picture and self-ligating brackets claims to do so. Even though self-ligating brackets have been in use since 1933 [5-12]. It was in 1998. Dr Dwight Damon who proposed that when we use self-ligating bracket the friction is at its lowest [4-11, 13-43].
While using Damon system in crowding cases, space is gained for DE crowding by transverse changes in premolar region [12] which is often termed as ‘‘Transverse arch development’’ by Damon practitioners. To date there have been not much studies looking at the effects of Damon system on the alveolar bone health while achieving transverse arch development.
Tacco et al. [13] measured the maxillary changes on the dental casts after 12 months of treatment at the end of leveling and aligning phase of treatment) with Damon and conventional pre-adjusted brackets. Similar increase in transverse measurements was found in both the groups.
Vajaria et al. [14] compared the transverse changes produced by Damon and Conventional bracket system by using scanned dental casts. They reported the change in maxillary intermolar width in Damon was significantly greater than in conventional.
Pandis et al. [15] conducted similar study focusing only on mandibular measurements.
Basciftci et al. [16] by using digital dental casts found the Damon appliance was able to produce significant expansion of both dental arches that remained stable in the long term.
Transverse response of the dental arch treated with self-ligating has been studied, especially the dent alveolar response on the dental casts. However little is known regarding CBCT scans used to assess the alveolar bone on the posterior region were buccal bone can be detected and quantified.
Before the introduction of computed tomography it was not possible to visualize the buccal bone due to superimposition that occurred in 2D radiographs [17,18].
Timock et al. [19] investigated the accuracy and reproducibility of measurements of alveolar bone height and thickness by means of CBCT imaging. They found good precision and accuracy for both measurements.
The stability for every orthodontic treatment and its posttreatment retention lies on the health of the alveolar bone. During the course of the treatment using low force and low friction system seems to be a better option in preserving bone health while achieving transverse dimensional changes.
In literature there are not many studies conducted on adults to determine the effects of transverse changes on thickness and height of the alveolar bone.
This study is carried out to assess the changes in the alveolar bone around the teeth when transverse changes are brought about using Damon self-ligating brackets.
This assessment is done by treating patients with passive selfligating bracket system (Damon) and transverse dimensional changes were measured on the study models which were taken at (Table 1) i.e. prior the onset of treatment and again at (Table 2) which is taken after 10 months into treatment. CBCT scans were taken at (Table 1) and (Table 2) to assess any changes in the alveolar bone height, buccal bone thickness and transverse dimension using Galileo’s software (Tables 4 & 5).
| BBT at 3 mm | Minimum | Maximum | Mean | Std. Deviation | |
|---|---|---|---|---|---|
| Tooth 14 | Pre | 0.64 | 1.46 | 1.03 | 0.36 |
| Post | 0.76 | 1.26 | 1.02 | 0.19 | |
| Tooth 24 | Pre | 0.01 | 1.39 | 0.70 | 0.50 |
| Post | 0.63 | 2.57 | 1.35 | 0.73 | |
| Tooth 15 | Pre | 0.86 | 2.18 | 1.67 | 0.35 |
| Post | 1.04 | 2.57 | 1.94 | 0.68 | |
| Tooth 16 | Pre | 0.01 | 1.89 | 1.02 | 0.58 |
| Post | 0.28 | 2.01 | 1.23 | 0.68 | |
| Tooth 25 | Pre | 0.99 | 1.80 | 1.24 | 0.22 |
| Post | 1.46 | 3.75 | 2.37 | 0.83 | |
| Tooth 26 | Pre | 0.01 | 1.18 | 0.83 | 0.32 |
| Post | 0.01 | 2.22 | 1.06 | 0.85 |
Table 1: Mean Distribution of the Subjects Based on Pre and Post Scores of Buccal Bone Thickness at 3 Mm.
| t value | p value | |
|---|---|---|
| Tooth 14 | 0.23 | 0.81 |
| Tooth 24 | -2.18 | 0.04* |
| Tooth 15 | -1.33 | 0.20 |
| Tooth 16 | -2.06 | 0.059 |
| Tooth 25 | -4.60 | 0.00* |
| Tooth 26 | -0.92 | 0.37 |
Table 2: Comparison of the Groups (Pre And Post) Using Paired Sample T Test of Buccal Bone Thickness at 3 Mm.
| BBT at 6 mm | Minimum | Maximum | Mean | Std. Deviation | |
|---|---|---|---|---|---|
| Tooth 14 | Pre | 0.49 | 1.87 | 0.83 | 0.39 |
| Post | 0.49 | 1.19 | 0.86 | 0.23 | |
| Tooth 24 | Pre | 0.14 | 1.48 | 0.76 | 0.52 |
| Post | 0.35 | 3.60 | 1.47 | 1.22 | |
| Tooth 15 | Pre | 0.56 | 2.21 | 1.25 | 0.58 |
| Post | 0.76 | 2.23 | 1.43 | 0.66 | |
| Tooth 16 | Pre | 0.01 | 1.25 | 0.52 | 0.49 |
| Post | 0.01 | 0.90 | 0.24 | 0.38 | |
| Tooth 25 | Pre | 0.42 | 3.77 | 1.31 | 0.94 |
| Post | 1.25 | 3.05 | 1.88 | 0.75 | |
| Tooth 26 | Pre | 0.01 | 1.74 | 0.83 | 0.65 |
| Post | 0.01 | 1.67 | 0.82 | 0.57 |
Table 3: Mean Distribution of the Subjects Based On Pre and Post Scores of Buccal Bone Thickness at 6 Mm.
| t value | p value | |
|---|---|---|
| Tooth 14 | -0.27 | 0.78 |
| Tooth 24 | -3.38 | 0.005* |
| Tooth 15 | -1.66 | 0.11 |
| Tooth 16 | 2.19 | 0.04* |
| Tooth 25 | -4.09 | 0.001* |
| Tooth 26 | 0.137 | 0.89 |
Table 4: Comparison of The Groups (Pre And Post) Using Paired Sample T Test of Buccal Bone Thickness at 6 Mm.
| BBT at 6 mm | Minimum | Maximum | Mean | Std. Deviation | |
|---|---|---|---|---|---|
| Tooth 14 | 3 mm | -23.48 | 51.56 | -6.27 | 30.19 |
| 6 mm | -46.74 | 114.29 | 23.63 | 61.81 | |
| Tooth 24 | 3 mm | -23.74 | 25.6 | 55.11 | 10.88 |
| 6 mm | 4.44 | 150.00 | 100.88 | 52.81 | |
| Tooth 15 | 3 mm | -40.23 | 76.03 | 20.23 | 47.27 |
| 6 mm | -33.94 | 60.71 | 18.86 | 33.84 | |
| Tooth 16 | 3 mm | -45.10 | 10.3 | 74.0. | 27.5 |
| 6 mm | -99.08 | 16.88 | -47.67 | 51.58 | |
| Tooth 25 | 3 mm | 9.77 | 204.88 | 97.92 | 79.58 |
| 6 mm | -24.93 | 197.62 | 82.42 | 73.13 | |
| Tooth 26 | 3 mm | -98.99 | 170.73 | 31.17 | 101.86 |
| 6 mm | -39.20 | 83.67 | 13.15 | 48.58 |
• BBT of 2nd premolars at 3mm from CEJ increased by 59.07%.
• BBT of 1st molars at 3mm from CEJ increased by 52.58%.
• BBT of 1st premolars at 6mm from CEJ increased by 62.25%.
• BBT of 2nd premolars at 6mm from CEJ increased by 50.64%.
• BBT of 16 at 6mm from CEJ decreased by 47.69%, and of 26 increased by 13.15%, overall of 1st molars at 6mm from CEJ decreased by30.41%.
Table 5: Percentage Reduction or Increase in Each Tooth at 3 And 6 Mm (Buccal Bone Thickness).
Aim
To assess variation in buccal bone thickness and height of the alveolar bone as a result of transverse dimensional changes in maxillary arch in patients undergoing orthodontic treatment with passive self-ligating bracket system using Cone Beam Computed Tomographic Images.
Objectives
• To evaluate the amount of transverse dimensional changes in maxillary arch.
• *To evaluate the changes in terms of buccal bone thickness and height.
Materials and Methods
This study was approved by ethical committee of AECS Maaruti College of Dental Science. This is an in vivo study conducted in our college in the department of orthodontics. Based on the preliminary sample size estimation, fourteen patients were randomly selected from the Out Patient Department.
All the fourteen patients involved in the study were explained about the study and written consent to undergo the CBCT radiographic examinations and to participate in this investigation was obtained from all the patients and from their parents or guardians. CBCT scans were taken following the approved protocol.
Patients presenting with moderate crowding (3 mm-7mm), presence of all the permanent teeth except 3rd molar, absence of spacing, Angles class 1 malocclusion, straight profile were considered the inclusion criteria.
Patients who were periodontal compromised patients who had undergone orthodontic treatment earlier, patients with systemic diseases or craniofacial syndromes and those determined to need corrective jaw surgery were excluded from the study.
All the patients satisfying inclusion criteria were treated without any extractions.
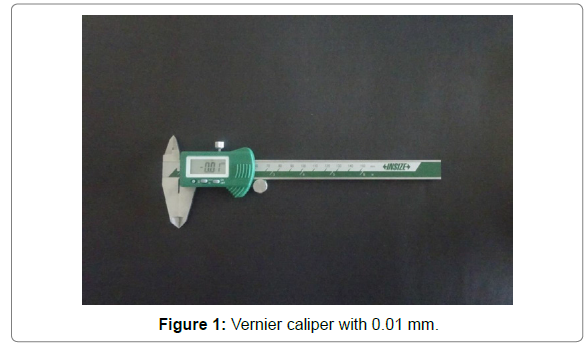
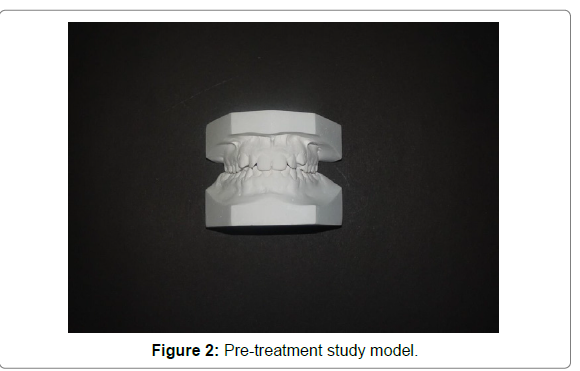
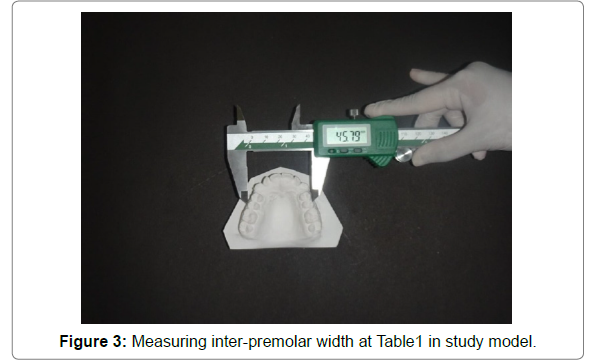
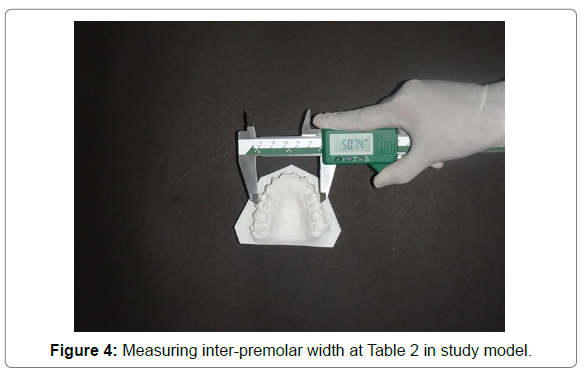
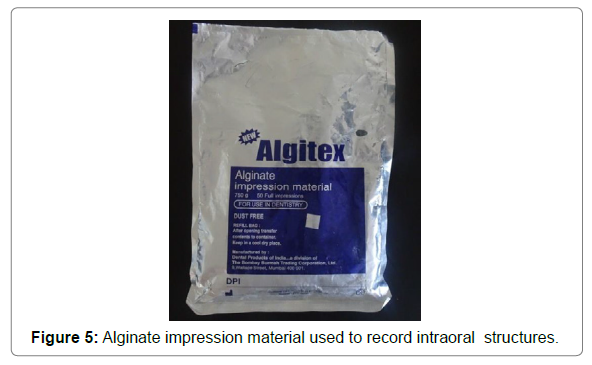
Intra oral impressions of teeth and adjacent soft tissue were taken prior the onset of treatment using algitex and poured with orthocal to make study models. The transverse distance between left and right 1st and 2nd premolars and 1st molars were measured at the occlusal level on the dental casts using a digital caliper of 0.001 mm accuracy to record the pre-treatment transverse dimensions. Irregularity index was recorded on pretreatment model (Figures 1-6). CBCT Scans were taken prior the onset of treatment, to assess the current status of buccal bone. The following acquisition parameters were used:
Tube current of 6 Ma,
Tube voltage of 85 kv,
Field of view of 8*8 cm,
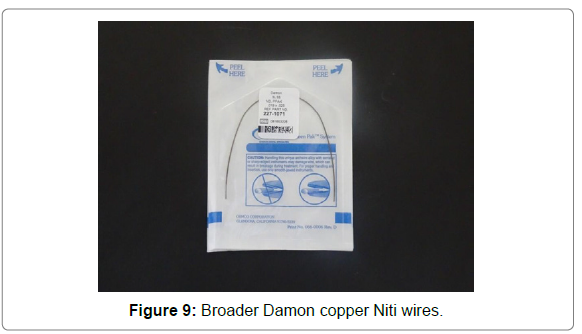
Radiation time 14180 ms which generates a voxel thickness of 0.15 mm. All the patients involved in the study were bonded with Damon Passive self-ligating brackets using ormco’senlite adhesive and primer, Damon cunitiarch wires treatment protocol was followed according to Damon Work book .
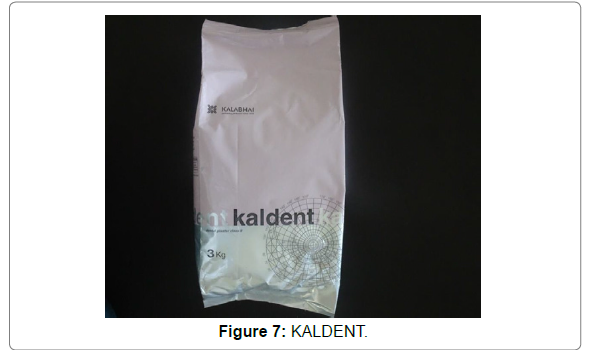
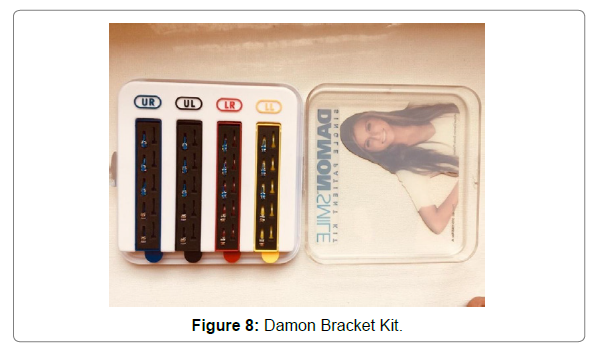
After 10 months into treatment when patients were on 18*25 cuniti at (Table 1) impressions were taken to make the study models, CBCT scans were repeated for all the patients involved in the study with the identical scanning protocol that was used at T0 for scans at (Table 1). All the measurements done prior the onset of treatment at (Table 1) the transverse dimension, buccal bone height and thickness were repeated at (Table 1, Figures 7 & 8).
3D Image Processing and Measurements
Each CBCT scan was imported into XG3D software (version 1.4) using the DICOM file format.
Cross sections of 0.1 mm thickness were made so that the axial slices were perpendicular to the long axis of the tooth in the buccolingual direction for each individual tooth. The cross sections were generated passing through the pulp apex and crossing the center of the root perpendicular to the alveolar contour at the level of the root cervical third. This can be done regardless of the angulation/ rotation of the tooth relative to the alveolar process or the presence of crowding. These cross-section images were imported into the software galileos within which the following variables were assessed:
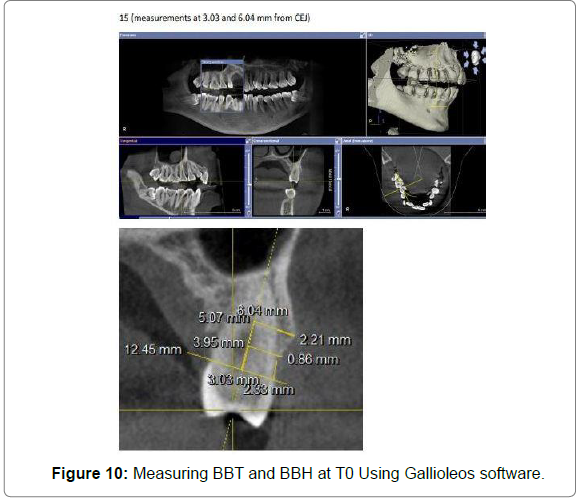
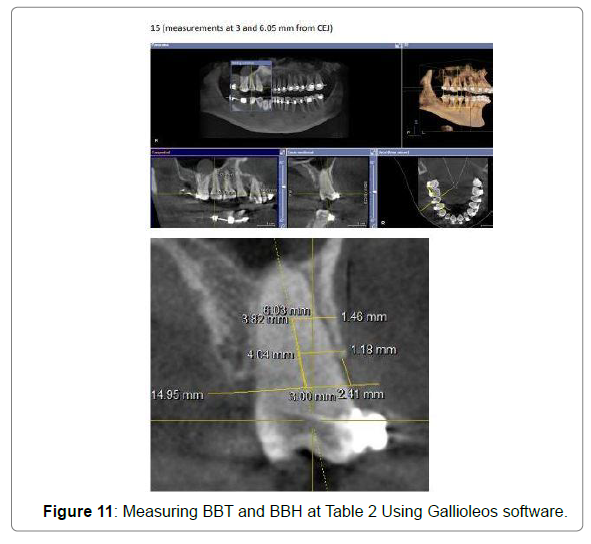
• *Buccal bone thickness (BBT) at 3 and 6 mm from the cement enamel junction (CEJ).
• Buccal bone height (BBH), defined as the distance from the CEJ to the alveolar crest (Figure 9 & 10)
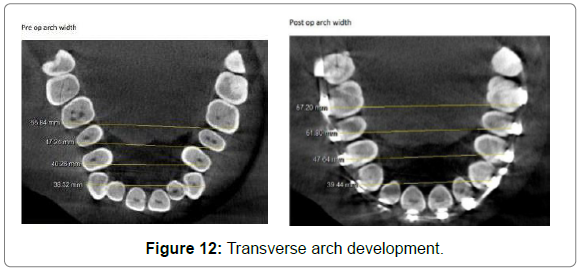
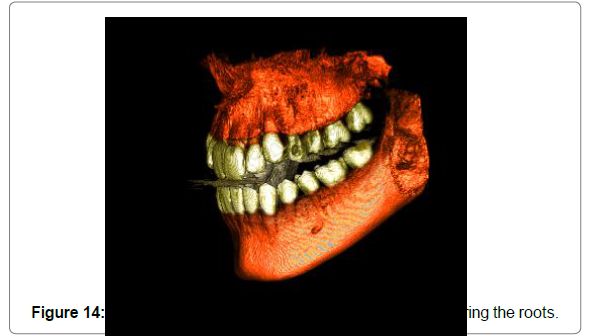
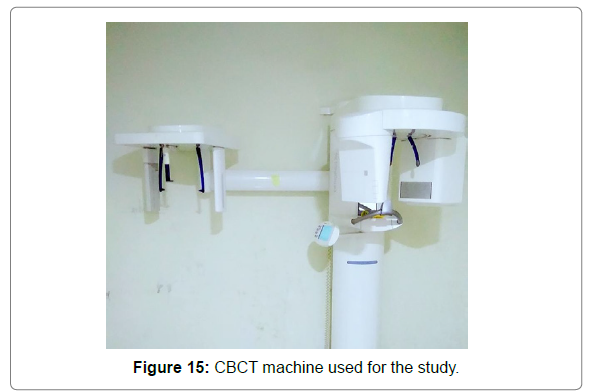
The inter–first premolar, inter–second premolar, and intermolar widths were measured (Figures 11-15)
The difference was compared in terms of initial and final change in buccal bone height and buccal bone thickness for the maxillary first molar, maxillary first and second premolars. Initial and final change in intermolar and inter first and second premolar distance were measured.
T tests - Means: Difference between two dependent means (matched pairs).
Input: Tail(s) = One
Effect size dz = 0.7114427
α err prob = 0.05
Power (1-β err prob) = 0.8
Output: No centrality parameter δ = 2.661975
Critical t = 1.770933
Df = 13
Total sample size = 14
Actual power = 0.809150
A power analysis was established by G*power, version 3.0.1 (Franz Fauluniversitat, Kiel, Germany). A sample size of 14 subjects would yield 80% power to detect significant differences, with effect size of 0.711 (derived from the article Deolino J ibiapina et al.) and significance level at 0.05.
Discussion
Alleviation of crowding without extractions and proximal reduction of the tooth can be achieved by distal movement of posterior teeth, expansion of the dental arch and incisor proclination [20]. However, sagittal expansion beyond the skeletal base boundaries or root movement through the bone may, according to animal [21, 22] and human [23-26] studies, constitute a risk of developing bony dehiscence and gingival recession. Transverse expansion can be achieved by relieving the muscle matrix [27] using buccal pressure with palatal devices [20] and fixed appliances using broad arch wires has been suggested recently [28,32]. According to three dimensional studies the rapid palatal expansion can cause horizontal and vertical reductions in the buckle alveolar bone of the pre-molars and molars [29,30]. The Damon self-ligating system claims that using low friction and low force are purported to be good for physiologically rebuilding the alveolar bone. They claim that post-treatment computed tomography (CT) images show transverse arch development and normal alveolar bone on lingual and buckle surfaces 31.
The three dimensional capability of cone beam computed tomography (CBCT) technology makes it possible to non-invasively assess alveolar bone changes for posterior teeth [41] where buccal bone defects can be detected and quantified [36]. Various studies [44-47,39] have indicated that CBCT images can be used to obtain accurate linear and angular measurements. Others [48] found a small systematic error, which became statistically significant only when combining several measurements. The accuracy of CBCT images for the detection and quantification of periodontal bone defects in three dimensions has been evaluated. Misch et al. [36] concluded that the three dimensional capabilityof CBCT offered a significant advantage because all defects including buccal and lingual defects could be detected and quantified.
Mol and Balasundaram 41concluded that CBCT images provide better diagnostic and quantitative information on periodontal bone levels in three dimensions than conventional radiography but the accuracy in the anterior aspect of the jaws was limited.
With rapid maxillary expansion, a significant amount of bone loss was reported by Garib et al [29]who found that RME reduced the buccal bone plate thickness of supporting teeth 0.6 to 0.9 mm and induced bone dehiscence’s on the buccal aspect where there was a significant reduction of alveolar crest level of 7.1 ± 4.6 mm at the first premolars and 3.8 ± 4.4 mm at the mesiobuccal area of the first molars. Rungcharas saeng et al [37] found that buccal crown tipping and reduction in thickness of buccal bone and height of the maxillary posterior teeth were the immediate effects of RME. Ballanti et al [46] found a significant reduction in buccal alveolar bone thickness of maxillary molars with the greatest amount of bone resorption being 0.4mm. The combination of self-ligating brackets with heatactivated super elastic arch wires has been reported to produce a lowforce, low-friction environment in which the bone follows the tooth movement. Thus, orthodontic treatment with self-ligating appliances would allow for greater dent alveolar expansion, causes less incisor proclamation, and require fewer extractions than the treatment with conventional appliances [32].
A more comprehensive study assessing the changes in buccal bone in both the posterior and anterior regions of the maxilla has not yet been published.
Therefore, the main purpose of this study was to assess the effects of using a passive self-ligating appliance on the maxillary buccal alveolar bone to alleviate crowding, with a non-extraction approach. Fourteen patients from the OPD of AECS Maaruti College Of Dental Science, Bangalore were selected for the study. All the patients met the inclusion criteria of the study. Study models and CBCT scans were recorded. CBCT scans were recorded prior to the treatment marked as T0. The patients were bonded with DAMON passive selfligating brackets and Post 10 months into treatment when patients were on 18*25 cunitii.e. at (Table 2), study models and CBCT scans were repeated. Galileo’s software was used to assess the change in the thickness and height of buccal bone and changes in transverse dimensions of the arch.
Information available from CBCT images provided a noninvasive insight into the dynamics of tooth movement during our study.
Cattaneo et al [12] found 12–23% reduction of buccal bone thickness in relation to second premolar, following non-extraction orthodontic treatment with self-ligating appliances.
In a study carried out by Juliana et al [33] which was the first ever study published measuring the BBT and BBH post aligning at 3mm and 6mm from CEJ, BBT reduced 36% and 45% respectively, and the decrease in BBT was non-significant in 2nd premolar region. Apical migration of the marginal bone was seen in 75% of central incisors and 59% of mesiobuccal root of 1st Molars. But the bone reduction at 2nd Premolar was not significant in their study. In a systematic review by Bollen et al. [49-67], they suggested that orthodontic therapy was associated with small amounts of alveolar bone loss. In our study in contrast to the findings of Cattaneo and coworkers [12], the bone reduction was not significant.
At 3 mm from CEJ, the findings showed increase in the buccal bone thickness of 24, 15, 25, 16 and 26 and out of this increase in 24 and 25 were statistically significant. However, a small amount of bone loss in 14 region was noticed which was not statistically significant. BBT of 1st premolars at 3 mm from CEJ overall increased by 30.69%, BBT of 2nd premolars at 3 mm from CEJ increased by 59.07%. and BBT of 1st molars at 3 mm from CEJ increased by 52.58%.
At 6mm from CEJ the buccal bone thickness is slightly decreased in 16 and 26 out of which the decreased value is statistically significant only in 16 and is not significant for 26. The bone thickness in 14, 24, 15 and 25 showed slight increase and was statistically significant in 24 and 25.
BBT of 1st premolars at 6 mm from CEJ increased by 62.25%
BBT of 2nd premolars at 6 mm from CEJ increased by 50.64%
BBT of 16 at 6 mm from CEJ decreased by 47.69%, and of 26 increased by 13.15%, overall of 1st molars at 6 mm from CEJ decreased by 30.41%.
Buccal bone height when measured from CEJ to alveolar crest showed increase of boneheight in 14, 24, 25, 16 and 26. The increase was statistically significant in 24, 16 and 26 but not significant in 14 and 25. A small amount of decrease of the bone height in 15 and was statistically significant.
BBH of 14 increased by 7.73% and at 24 increased by 45.95%, overall at first premolars BBH was increased by 53.68%.


BBH at 15 decreased by 54.42%, at 25 increased by 7.23% and overall in 2nd premolars it’s decreased by 30.82%.
BBH at 16 and 26 is increased by 44.09% and 56.32% respectively and the overall the increase in BBH at 1st molars is 50.2%.


Increase in transverse dimension leading to transverse arch development when measured on CBCT scan at 1st PM was 3.45mm, at 2nd PM was 2.83 mm and 1st molar was 2.44 mm from Tables 6-12.
| BBT at 6 mm | Minimum | Maximum | Mean | Std. Deviation | |
|---|---|---|---|---|---|
| Tooth 14 | Pre | 1.19 | 2.84 | 2.02 | 0.68 |
| Post | 1.21 | 2.29 | 1.90 | 0.44 | |
| Tooth 24 | Pre | 2.30 | 3.57 | 2.78 | 0.50 |
| Post | 0.70 | 2.79 | 1.52 | 0.90 | |
| Tooth 15 | Pre | 0.90 | 2.33 | 1.47 | 0.55 |
| Post | 1.60 | 2.41 | 2.00 | 0.29 | |
| Tooth 16 | Pre | 1.53 | 3.54 | 2.07 | 0.68 |
| Post | 0.00 | 2.71 | 1.22 | 1.16 | |
| Tooth 25 | Pre | 2.08 | 2.60 | 2.22 | 0.21 |
| Post | 1.18 | 3.00 | 2.03 | 0.70 | |
| Tooth 26 | Pre | 2.01 | 3.24 | 2.48 | 0.50 |
| Post | 0.00 | 3.05 | 1.02 | 1.23 |
Table 6: Mean Distribution of the Subjects Based on Pre and Post Scores Of Buccal Bone Height.
| t value | p value | |
|---|---|---|
| Tooth 14 | 0.55 | 0.59 |
| Tooth 24 | 6.09 | 0.00* |
| Tooth 15 | -3.19 | 0.007* |
| Tooth 16 | 3.55 | 0.004* |
| Tooth 25 | 0.90 | 0.38 |
| Tooth 26 | 4.06 | 0.001* |
Increase in Bone thickness at 6mm from CEJ of 24 and 25 were statistically significant. Decrease in Bone thickness at 6mm from CEJ of 16 was statistically significant.
Table 7: Comparison of the Groups (Pre and Post) Using Paired Sample T test of Buccal Bone Height.
| BBT at 6 mm | Minimum | Maximum | Mean | Std. Deviation | |
|---|---|---|---|---|---|
| Tooth 14 | 14 | -33.79 | 92.44 | -7.73 | 56.08 |
| Tooth 24 | 14 | -74.75 | 0.40 | -45.95 | 28.42 |
| Tooth 15 | 14 | -23.08 | 123.33 | 54.42 | 57.26 |
| Tooth 16 | 14 | -100.00 | 36.60 | -44.09 | 55.06 |
| Tooth 25 | 14 | -44.34 | 42.18 | -7.23 | 35.83 |
| Tooth 26 | 14 | -100.00 | 38.31 | -56.32 | 56.43 |
• Overall BBH in 1st premolars increased by 26.38%.
• BBH at 15 decreased by 54.42%, at 25 increased by 7.23%, overall in 2nd premolars its decreased by 30.82%.
• BBH at 16 and 26 is increased by 44.09% and 56.32% respectively; overall the increase in BBH at 1st molars is 50.2%.
Table 8: Percentage Reduction or Increase in Each Tooth (Buccal Bone Height).
| BBT at 6 mm | Minimum | Maximum | Mean | Std. Deviation | |
|---|---|---|---|---|---|
| Transverse pre | Q 14-24 | 38.73 | 46.54 | 42.76 | 3.13 |
| Q 15-25 | 44.74 | 51.80 | 48.07 | 2.77 | |
| Q 16-26 | 51.67 | 57.23 | 54.09 | 2.27 | |
| Transverse Post | Q 14-24 | 41.97 | 48.26 | 46.21 | 2.11 |
| Q 15-25 | 46.39 | 53.20 | 50.90 | 2.19 | |
| Q 16-26 | 51.61 | 60.71 | 56.53 | 3.12 |
Table 9: Mean Distribution of the Pre and Post (Transverse) On Cbct.
| t value | p value | |
|---|---|---|
| Q 14-24 | -4.3 | 0.001* |
| Q 15-25 | -6.6 | 0.00* |
| Q 16-26 | -7.6 | 0.00* |
• There was significant increase in transverse dimension in premolar and molar region when measured on CBCT.
Table 10: Comparison of Pre and Post (Transverse) Using Paired Sample T Test (Cbct).
| Minimum | Maximum | Mean | Std. Deviation | ||
|---|---|---|---|---|---|
| Transverse pre | Q 14-24 | 33.31 | 41.95 | 38.84 | 3.76 |
| Q 15-25 | 42.31 | 47.06 | 44.88 | 2.16 | |
| Q 16-26 | 48.24 | 53.81 | 51.39 | 1.71 | |
| Transverse Post | Q 14-24 | 41.26 | 45.98 | 45.04 | 1.62 |
| Q 15-25 | 45.42 | 51.00 | 49.65 | 1.85 | |
| Q 16-26 | 48.31 | 55.14 | 52.91 | 2.34 |
Table 11: Mean Distribution of the Pre and Post (Transpost) On Cast.
| t value | p value | |
|---|---|---|
| Q 14-24 | -6.2 | 0.00* |
| Q 15-25 | -10.5 | 0.00* |
| Q 16-26 | -6.1 | 0.00* |
• Significant increase in transverse dimensions in premolars and 1st molar when measured on cast.
Table 12: Comparison of Pre and Post (Transverse-Post on Cast) Using Paired Sample T Test.
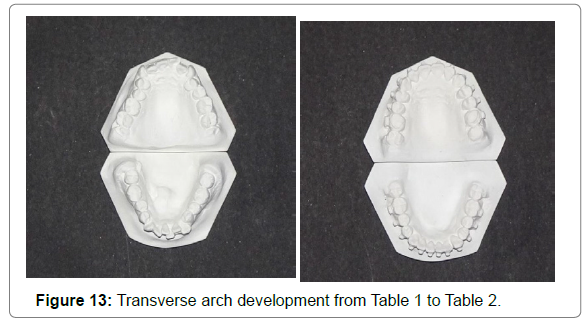
When measured on study models the increase in transverse dimension at 1st PM was 6.2 mm, at 2nd PM was 4.7 mm and 1st molar was 1.52 mm from (Tables 1-2). We found that the maxillary intermolar width increased significantly in premolars and molars from (Tables 1-2). Consistent with this finding, Tecco et al. [13], Lorenzo et al. [34], Lillian et al. [59] found that self-ligating and appliances increased maxillary dent alveolar widths. Megan et al. [65] found significant increase of maxillary dent alveolar widths with lowfriction appliance.
Intra observer reliability was found to be 0.7 (Moderate corelation).

Hence it can be concluded that the treatment with DAMON SLB’s results in significant increase in transverse dimensions which were found to be more at premolar region. Further, an increase in BBT at 3mm from CEJ of premolars and molars except in 14and an increase in 1st and 2nd premolars at 6mm from CEJ were noticed but there was a decrease in BBT at molars at 6mm from CEJ. Buccal bone height from CEJ to alveolar crest significantly increased in 24, 16 and 26, whereas BBH significantly decreased in 15.
Scope of the Study
The literature is filled with the advantages of SLB for orthodontic treatment. However, there are no studies that have investigated the buccal bone changes with SLB after the completion of leveling and aligning. Several studies have investigated the buccal bone changes with rapid maxillary expansion and they revealed that there is a buccal bone loss. Several clinical studies indicate that orthodontic treatment can have a mild detrimental effect on the periodontium but there is limited quantitative data for this. There are limited reports that compared the transverse dimension changes and its effects. This study will examine the buccal bone changes, the transverse dimensional changes, from (Tables 1-2) using Damon passive selfligating brackets in maxillary arch.
Limitations
The study had some limitation which includes shorter treatment duration; a large variation in initial BBT, a small amount of expansion, presence of brackets affects the precise measurements at (Table 2).
A higher sample size can help in determining the parameters more effectively. The sample was analyzed after 10months of treatment; a long term follow-up study can help to understand the changes better.
The present study was carried out to assess the amount of transverse dimensional changes in the maxillary arch and its effect on the buccal alveolar bone thickness and height. This was done using Damon Q passive self-ligating brackets on 14 patients with a nonextraction approach.
Statistical analysis
The interpremolar, intermolar distance, buccal bone thickness and height measured on CBCT scan at (Tables 1-2) were collected. The data was statistically analyzed using paired sample t test for the changes in buccal bone thickness and height. Level of Significance:P<0.05
Software Used:SPSS
Statistical Technique Used:Paired t- test was used to assess the changes
From (Table 1 & 2).
Conclusion
• Non-extraction alignment with self-ligating appliances generated significant amount of dental arch expansion. Maximum was found to be at 2nd premolar region followed by 1st premolar followed by 1st molar.
• Significant increase in arch development from (Tables 1 & 2).
• BBT at 3 mm was increased in 15, 24 and 25, 16 and 26, but at14 it was decreased and was not statistically significant.
• BBT of 1st premolars at 3 mm from CEJ increased by 30.69%
• BBT of 2nd premolars at 3 mm from CEJ increased by 59.07%
• BBT of 1st molars at 3 mm from CEJ increased by 52.58%
• BBT at 6 mm increased in premolars but was slightly decreased in 1st molars.
• BBT of 1st premolars at 6 mm from CEJ increased by 62.25%
• BBT of 2nd premolars at 6mm from CEJ increased by 50.64%
• BBT of 16 at 6 mm from CEJ decreased by 47.69%, and of 26 increased by 13.15%, overall of 1st molars at 6 mm from CEJ decreased by 30.41%.
• BBH was increased in first molars and first premolars; increase was statistically significant in 16, 26 and 24. Whereas, it was decreased in 15, 25 and statistically significant decrease of BBH was noticed in 15.
• BBH of 14 isincreased by 7.7%, at 24 increased by 45.95%, overall in 1st premolars it was increased by 26.38%.
• BBH at 15 decreased by 54.42%, at 25 increased by 7.23%, overall in 2nd premolars it was decreased by 30.82%
• BBH at 16 and 26 is increased by 44.09% and 56.32% respectively; overall the increase in BBH at 1st molars is 50.2%.
References
- Almeida MC, Futagami C, Conti ACF, Oltramari-Navarro P, Lima Navarro R, et al. (2015) Dentoalveolar mandibular changes with self-ligating versus conventional bracket systems: A CBCT and dental cast study. Dental Press J Orthod 20: 50-7.
- Berger J, Byloff FK (2001) the clinical efficiency of self-ligating brackets. J Clin Orthod 35: 304-308.
- Damon DH (1998) The rationale, evolution and clinical application of the self- ligating bracket. Clm Orth Res, 52-61.
- Megha A, David LT, Ketan SJ, Charles F, Greg J et al. (2015) Retrospective investigation of the effects and efficiency of self-ligating and conventional Brackets. Am J Orthod Dentofacial Orthop Vol 148 Issue 1.
- Fleming PS, DiBiase AT, Lee RT (2008) Self-ligating appliances: evolution or revolution? J Clin Orthod 42: 641-51.
- Ehsani S, Mandich MA, El-Bialy TH, Flores-Mir C (2001) Frictional resistance in self-ligating orthodontic brackets and conventionally ligated brackets. A systematic review. Angle Orthod 79: 592-601.
- Kim TK, Kim KD, Baek SH (2008) Comparison of frictional forces during the initial leveling stage in various combinations of self-ligating brackets and arch wires with a custom-design typodont system. Am J Orthod Dentofacial Orthop 133: 187e15- 18e24.
- Hain M, Dhopatkar A, Rock P (2003) The effect of ligation method on friction in sliding mechanics. Am J of Orthod Dentofacial Orthop 123: 416-22.
- Hain M, Dhopatkar A, Rock P (2006) A Comparision of different ligation methods on friction. Am J Orthod Dentofacial Orthop. 130: 666-70.
- Pizzoni L, Ravnholt G, Melsen B (1998) Frictional forces related to self- ligating brackets. Eur J Orthod 20: 283-91.
- Henao SP, Kusy RP (2004) Evaluation of frictional resistance to self-ligating bracket designs suing standardized archwires and dental typhodonts. Angle Orthod 74: 202-11.
- PM Cattaneo, M Treccani, K Carlsson, T Thorgeirsson, A Myrda, et al. (2011) Transversal maxillary dento-alveolar changes in patients treated with active and passive self-ligating brackets:a randomized clinical trial using CBCT-scans and digital models. Orthod Craniofac Res 14: 222–233.
- Tecco S, Tete S, Perillo L, Chimenti C, Festa F, et al. (2011) Maxillary arch width changes during orthodontic treatment with fixed self-ligating and traditional straight wire appliances. World Journal of Orthodontics 10: 290- 294.
- Vajaria R, BeGole E, Kusnoto B, Galang MT, Oberz, et al. (2011) A Evaluation of incisor position and transverse dimensional changes using Damon System. The Angle Orthodontist 81: 647-652.
- Pandis N, Polychronopoulou A, Makou M, Eliades T (2011) Mandibular dental arch changes associated with treatment of crowding using self-ligating and conventional brackets. European Journal Of Orthodontics 32:248—253.
- Basciftci FA, Akin M, Ileri Z, Bayram S (2001) Long-term stability of dentoalveolar, Skeletal, Soft tissue changes after non-extraction treatment with self-ligating system. Korean J of Orthodont 44:119-127.
- Yagci A, Veli I, Uysal T, Ucar FI, Ozer T, et al. (2012) Dehiscence and fenestration in skeletal Class I, II, and III malocclusions assessed with cone- beam computed tomography. Angle Orthod 82: 67-74.
- Tai K, Park JH, Mishima K, Shin JW (2011) 3-dimensional cone-beam computed tomography analysis of transverse changes with Schwarz appliances on both jaws. Angle Orthod 81: 670-7.
- Timock AM, Cook V, McDonald T, Leo MC, Crowe J, et al. (2011) Accuracy and reliability of buccal bone height and thickness measurements from cone- beam computed tomography imaging. Am J Orthod Dentofacial Orthop 140: 734-44.
- Weinberg M, Sadowsky C (1996) Resolution of mandibular arch crowding in growing patients with Class I malocclusions treated nonextraction. Am J Orthod Dentofacial Orthop 110: 359–364.
- Thilander B, Nyman S, Karring T, Magnusson I (1983) Bone regeneration in alveolar bone dehiscences related to orthodontic tooth movements. Eur J Orthod 5: 105–114.
- Wennstrom JL, Lindhe J, Sinclair F, Thilander B (1987) Some periodontal tissue reactions to orthodontic tooth movement in monkeys. J Clin Periodontol 14: 121–129.
- Fuhrmann R (1996) Three-dimensional interpretation of periodontal lesions and remodeling during orthodontic treatment. Part III. J Orofac Orthop 57: 224–237.
- Wehrbein H, Bauer W, Diedrich P (1996) Mandibular incisors, alveolar bone, and symphysis after orthodontic treatment. A retrospective study. Am J Orthod Dentofacial Orthop 110: 239–246.
- Yared KF, Zenobio EG, Pacheco W (2006) periodontal status of mandibular central incisors after orthodontic proclination in adults. Am J Orthod Dentofacial Orthop 130: 6e1–6e8.
- Garlock DT, Buschang PH, Araujo EA, Behrents RG, Kim KB, et al. (2016) Evaluation of marginal alveolar bone in the anterior mandible with pretreatment and post-treatment computed tomography in nonextraction patients. Am J Orthod Dentofacial Orthop 149: 192–201.
- Frankel R (1980) A functional approach to orofacial orthopaedics. Br J Orthod 7: 41-51.
- Atik E, Akarsu-Guven B, Kocadereli I, Ciger S (2016) Evaluation of maxillary arch dimensional and inclination changes with selfligating and conventional brackets using broad archwires. Am J Orthod Dentofacial Orthop 149: 830– 837.
- Garib DG, Henriques JF, Janson G, de Freitas MR, Fernandes AY, et al. (2006) Periodontal effects of rapid maxillary expansion with tooth-tissue- borne and tooth-borne expanders: a computed tomography evaluation. Am J Orthod Dentofacial Orthop 129: 749–758.
- Pangrazio-Kulbersh V, Jezdimir B, Kulbersh R, Wine P, Kaczynski R, et al. (2013) CBCT assessment of alveolar buccal bone level after RME. Angle Orthod 83: 110–116.
- Yu YL, Qian YF (2007) The clinical implication of self-ligating brackets. Shanghai Kou Qiang Yi Xue Aug 16: 431-5.
- Damon DH (1998) The Damon low-friction bracket: a biologically compatible straight-wire system. J Clin Orthod 32: 670– 680.
- Juliana F, Moraisa Birte, Melsenb Karina M.S (1998) Evaluation of maxillary buccal alveolar bone before and after orthodontic alignment without extractions: A cone beam computed tomographic study. Angle Orthodontist 34: 836-844.
- Franchi LBaccetti TCamporesi M, Lupoli M (2006) Maxillary arch changes during leveling and aligning with fixed appliances and low-friction ligatures. Am J Orthod Dentofacial Orthop 130: 88-91.
- Garib DG, Henriques JF, Janson G, de Freitas MR, Fernandes AY, et al. (2006 ) Periodontal effects of rapid maxillary expansion with tooth-tissue- borne and tooth-borne expanders: a computed tomography evaluation. Am J Orthod Dentofacial Orthop 129: 749-58.
- Misch KA, Yi ES, Sarment DP (2006) Accuracy of cone beam computed tomography for periodontal defect measurements. J Periodontol 77: 1261-6.
- Rungcharassaeng K, Caruso JM, Kan JY, Kim J, Taylor G, et al. (2007) Factors affecting buccal bone changes of maxillary posterior teeth after rapid maxillary expansion. Am J Orthod Dentofacial Orthop 132: 428e1-428e8.
- Pandis N, Polychronopoulou A (2007) Self-ligating vs conventional brackets in the treatment of mandibular crowding: a prospective clinical trial of treatment duration and dental effects. Am J Orthod Dentofacial Orthop132: 208-15.
- Stratemann SA, Huang JC, Maki K, Miller AJ, Hatcher DC, et al. (2008) Comparison of cone beam computed tomography imaging with physical measures. Dentomaxillofac Radiol 37: 80-93.
- Fleming PS,DiBiase AT, Lee RT(2008) Self-ligating appliances: evolution or revolution? Aust Orthod J 24: 41-9.
- Mol A, Balasundaram A (2008) In vitro cone beam computed tomography imaging of periodontal bone. Dentomaxillofac Radiol 37: 319-24.
- Fleming PS, DiBiase AT, Sarri G, Lee RT (2009) Comparison of mandibular arch changes during alignment and leveling with 2 preadjusted edgewise appliances. Am J Orthod Dentofacial Orthop 136: 340-7.
- Shivapuja PK, Berger J (1994) A comparative study of conventional ligation and self-ligation bracket systems. Am J Orthod Dentofacial Orthop 106: 472- 80.
- Jiang RP, Fu MK (2008) Non-extraction treatment with self-ligating and conventional brackets. Zhonghua Kou Qiang Yi Xue Za Zhi 43: 459-63.
- Scott P, DiBiase AT, Sherriff M, Cobourne MT (2008) Alignment efficiency of Damon3 self-ligating and conventional orthodontic bracket systems: a randomized clinical trial. Am J Orthod Dentofacial Orthop 134: 470e1-470e8.
- Ballanti F, Lione R, Fanucci E, Franchi L, Baccetti T, et al. (2009) Immediate and post-retention effects of rapid maxillary expansion investigated by computed tomography in growing patients. Angle Orthod 79: 24-9.
- Moreira CR, Sales MA, Lopes PM, Cavalcanti MG (2009) Assessment of linear and angular measurements on three-dimensional cone-beam computed tomographic images. Oral Surg Oral Med Oral Pathol Oral Radiol Endod.
- Baumgaertel S, Palomo JM, Palomo L, Hans MG (2009) Reliability and accuracy of cone-beam computed tomography dental measurements. Am J Orthod Dentofacial Orthop 136: 19-25.
- Kau CH, Littlefield J, Rainy N, Nguyen JT, Creed B (2010) Evaluation of CBCT Digital Models and Traditional Models Using the Little’s Index. Angle Orthod. 80: 435-9.
- Lagravère MO, Carey J, Heo G, Toogood RW,Major PW,et al. (2010) Transverse, vertical, and anteroposterior changes from bone-anchored maxillary expansion vs traditional rapid maxillary expansion: A randomized clinical trial. Am J Orthod Dentofacial Orthop. 137: 304-305.
- Fleming PS, Johal A (2010) Self-ligating brackets in orthodontics. Angle Orthod. 80: 575- 84.
- Pandis N, Polychronopoulou A,Makou M, Eliades T (2010) Mandibular dental arch changes associated with treatment of crowding using self- ligating and conventional brackets.Eur J Orthod.32: 248-53.
- Mah JK,Huang JC,Choo H (2010) Practical applications of cone-beam computed tomography in orthodontics. J Am Dent Assoc.141 Suppl 3: 7-13.
- Kiyoshi Taia, Jae Hyun, Parkb Katsuaki Mishimac, Je-Won Shind (2011) 3-Dimensional cone-beam computed tomography analysis of transverse changes with Schwarz appliances on both jaws. Angle Orthodontist. 8: 683- 556.
- Z, Smith T, Kortam S, Kim DG, Tee BC, et al.(2011) Effect of bone thickness on alveolar bone-height measurements from cone-beam computed tomography images. Am J Orthod Dentofacial Orthop. 139: e117-27.
- Rohini Vajariaa, Ellen BeGoleb, Budi Kusnotoc, Maria Therese Galangd, Ales Obreze, et al. (2011) Evaluation of incisor position and dental transverse dimensional changes using the Damon system. Angle Orthodontist, Vol 81, No 4.
- Pandis N, Polychronopoulou A, Katsaros C, Eliades T (2011) Comparative assessment of conventional and self-ligating appliances on the effect of mandibular intermolar distance in adolescent nonextraction patients: a single-center randomized controlled trial.Am J Orthod Dentofacial Orthop. 140: e99-e105.
- Leite V, Conti AC, Navarro R,Almeida M, Oltramari-Navarro P, et al. (2012) Comparison of root resorption between self-ligating and conventional preadjusted brackets using cone beam computed tomography.Angle Orthod.82: 1078-82.
- Maltagliati L, Myiahira Y, Fattori L, Filho L, Cardoso M, et al. (2013) Transversal changes in dental arches from non-extraction treatment with self-ligating brackets. Dental press J.Orthod. vol.18 no.3 Maringá.
- Fleming PS, Lee RT, Marinho V, Johal A (2013) Comparison of maxillary arch dimensional changes with passive and active self-ligation and conventional brackets in the permanent dentition: a multicenter, randomized controlled trial. Am J Orthod Dentofacial Orthop. 144: 185-93.
- Atik E, Ciğer S (2014) An assessment of conventional and self-ligating brackets in Class I maxillary constriction patients. Angle Orthod. 84: 615-22.
- Mevlut Celikoglu, Mehmet Bayram, Metin Nur, Dogan Kilkis (2015) Mandibular changes during initial alignment with SmartClip self-ligating and conventional brackets: A single-center prospective randomized controlled clinical trial. Korean J Orthod. 45: 89–94.
- Anand M, Turpin DL, Jumani KS, Spiekerman CF, Huang GJ,et al. (2015) Retrospective investigation of the effects and efficiency of self-ligating and conventional brackets.. Am J Orthod Dentofacial Orthop. 148: 67-75.
- Lineberger MB,Franchi L, Cevidanes LH, Huanca Ghislanzoni LT,McNamara JA Jr, et al. (2016) Three-dimensional digital cast analysis of the effects produced by a passive self-ligating system. Eur J Orthod.38: 609-614.
- Ibiapina DJ, Oltramari-Navarro PV, Navarro RL, Almeida MR, Mendonça DL, et al. (2016) Assessment of Dental Arch Changes and Buccal Bone Thickness in Patients treated with Self-ligating Brackets The Journal of Contemporary Dental Practice17: 434-439.
- Sahira Kortam, Paul Geuy, W M Johnston, H W Fields, Do-Gyoon Kim, et al. (2010) Buccal Bone Changes With Self-Ligating Brackets Versus Conventional Brackets. AADR Annual Meeting Washington DC.
- Bollen AM, Cunha-Cruz J, Bakko DW, Huang GJ, Hujoel PP, et al. (2008) The effects of orthodontic therapy on periodontal health: a systematic review of controlled evidence. J Am Dent Assoc. 139: 413-22.
 Spanish
  Chinese
  Russian
  German
  French
  Japanese
  Portuguese
  Hindi
Hindi 