Short Communication, J Nanomater Mol Nanotechnol Vol: 8 Issue: 3
Understanding the UV-Vis Spectroscopy for Nanoparticles
Qaisar Abbas*
Department of Physics, COMSATS University Islamabad, Lahore Campus 54000, Pakistan
*Corresponding Author : Qaisar Abbas Department of Physics, COMSATS University Islamabad, Lahore Campus 54000, Pakistan E-mail: qaisar022@gmail.com
Received: March 05, 2019 Accepted: May 16, 2019 Published: May 31, 2019
Citation: Abbas Q (2019) Understanding the UV-Vis Spectroscopy for Nanoparticles. J Nanomater Mol Nanotechnol 8:3. doi: 10.4172/2324-8777.1000268
Abstract
UV-Vis technique is a compulsory technique for the optical study of the materials. Optical study helps the researcher for the application s of nanomaterials for different uses. Different devices are fabricat- ed on the basis of optical properties of the materials especially solar cells. With the help of this technique optical band gap can be calcu- lated which helps to choose the materials for the energy conversion purpose like light energy to electrical energy in solar cell. Also, from this technique purity of the sample can be measured by comparison with the reference solution. Here results of different materials are described which can help to better understand the analysis of Uv- Vis spectroscopy results.
Keywords: UV-VIS; Band gap; Nanoparticles
Introduction
Ultra violet and visible (Uv-Vis) absorption spectroscopy is the technique by which we measure attenuation of light which passes through a under consideration sample or also after reflection from the sample. Both parts (Uv and Vis) of light are energetic that can excite electrons to higher energy levels [1].
Short Communication
Principle of the Uv-Vis spectroscopy
This follows the principle of the Beer lambert law which states that absorption of the light by the sample is directly proportional to the path length and concentration of the sample [2].
Mathematically,
A=log (I0/I)=Ecl
Where, A=absorbance
I0=intensity of light incident upon sample cell
I=intensity of light leaving sample cell
C=molar concentration of solute
L=length of sample cell (cm.)
E=molar absorptivity
Range
Data provided in the given below Table 1.
| Light | Wavelength range in nm |
|---|---|
| Ultraviolet | 200-400 |
| Visible | 400-800 |
Table 1: Ranges of wavelength.
Explanation of the working
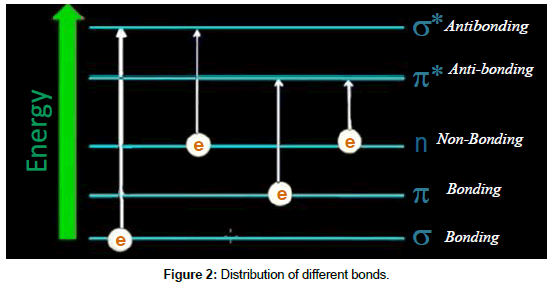
When light falls on the sample each material absorbs a specific range of the light and shows the behavior accordingly. Electron from the atom excites towards the higher state from the lower energy state. These two states are classified in two types LUMO and HOMO.
1. LUMO : Lowest unoccupied molecular orbit
2. HOMO: Highest occupied molecular orbit.
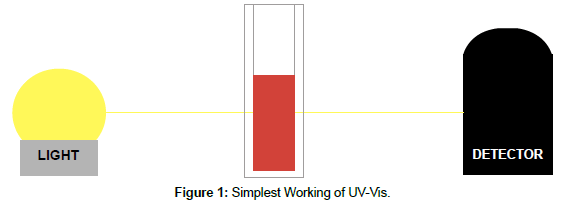
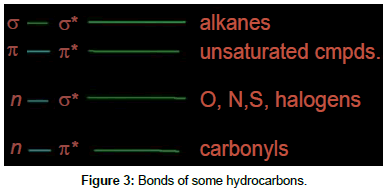
There are further classification of bonds and these bonds form according to the specific behavior of the sample which is being analyzed under the light. The details are shown in Figures 1 and 2. Sigma is stronger bond while pi is weak bond and it depends on the material which bond formed. The bond formation of organic materials is shown in Figure 3.
Applications of the Uv-Vis spectroscopy
The most important factor of the technique is its application for the researcher to give the information about the material when light falls on it.
Detection of Chromophore functional group: To determine the functional group in the material exclusively it confirms the presence and absence of the Chromosphere in the sample which should be compound. Chromophore is an atom or group which is responsible of the color of the compound.
Determine the unknown compound: With the help of the Uv-Vis spectroscopy unknown compound can be determined in the sample. For this purpose, required compound is compared to spectrum of the reference compound if luckily both the spectrum is matched then confirmation of unknown compound can be noted.
Purity of the sample: The purity of the substance can be measured by this unique technique for this purpose absorption of the reference and the sample under observation is compared and via relative calculations of the absorption intensity purity of the sample can be confirmed.
Band gap calculations: An interesting application of this technique is the calculations of the band via different method there are different software’s are available for this purpose.
Mathematically:
E=hc/λ (1)
E=energy band gap
h=planks constant, c=speed of light
λ=wavelength
Result Interpretations
ZnO nano particles
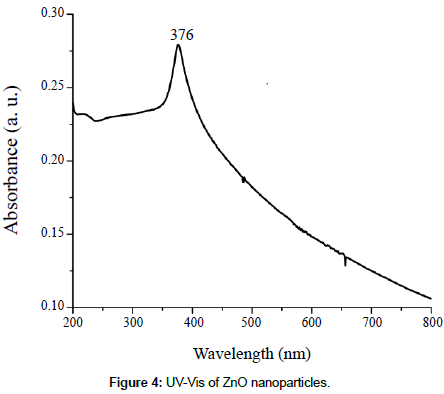
To examine the optical properties of nanoparticles UV-Vis spectroscopy is used. In Figure 4, ZnO nanoparticles spectrum is observed in the figure characteristic absorption peak of the sample is noted that is 376 nm and band gap is 3.26 eV. This is attributing as intrinsic band gap absorption of ZnO [3] from this peak it can be analyzed that there are uniform distributed nanoparticles and mostly particles are in nano size. The supporting point is that there is no other peak is observed in whole a spectrum that means ZnO has successfully formed.
TiO2 nanoparticles
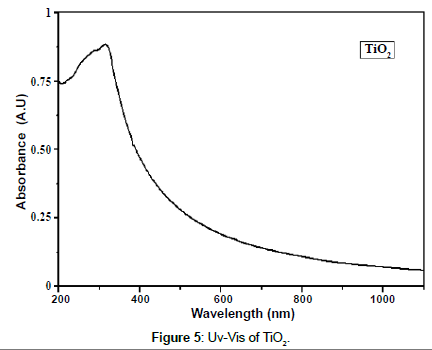
For the observation of the optical properties of the nanoparticles Uv-Vis spectroscopy is used. Figure 5 shows the absorption spectrum of the nano range at room temperature. the spectrum range was set from 200 nm to 1200 nm. The maximum peak wavelength was observed at 354 nm with absorbance of 0.86 which is less than one and it confirms that it has good absorbance in Uv region [4].For the calculation of band gap following formula was used.
E=hc/λ
CuO nanoparticles
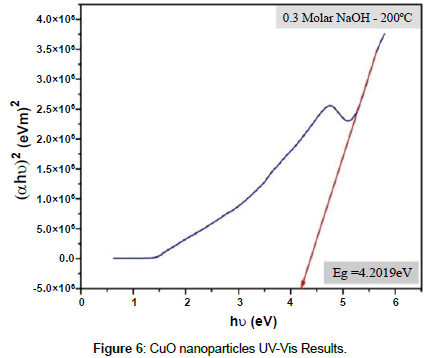
Uv-Vis results nanoparticles of CuO are shown in Figure 6. For the calculations of the band gap another approach is used. The following equation was used
(αhυ)=A (hυ-Eg)n (2)
The band gap calculated was 4.2 eV which is higher than that of bulk which has 2.1 eV. There is very important notice that band increases with the decrease in particle size.
Absorption of light is attributed to the excitation of electron from valance band to the conduction band and this behavior is used to calculate the band gap as calculated via above method [5-8].
Conclusion
Different materials interact with light differently. Some materials absorb lighter and more other less. The absorption rate of the light makes the material specific for the application. UV vis is found best technique to analyzing the optical properties of organic or semiconductors materials as with the decrease of the size band gap increases so the Uv-Vis helps to estimate the band gap of the material. For the study of the properties of nanomaterials these techniques play a key role for the explanation of optical properties.
References
- Chemicool Dictionary (2019) Definition of UV Vis absorption spectroscopy- Chemistry Dictionary.
- Aman T (2019) Principle, working and applications of UV spectroscopy. Indiastudychannel .
- Zak KA, Abrishami ME, Majid WHA, Yousefi R (2010) Effects of annealing temperature on some structural and optical properties of ZnO nanoparticles prepared by a modified sol–gel combustion method. Ceram Int 37: 393-398.
- Kandregula G, Chinthakuntla A, Rao K, Rajendar V (2014) Green Synthesis of TiO2 Nanoparticles using hibiscus flower extract. int conf Emerg. Technol Mech Sci: 79–82.
- Arun KJ, Batra AK, Krishna A, Bhat K, Aggarwal MD, et al. (2015) Surfactant free hydrothermal synthesis of copper oxide nanoparticles. Am J Mater Sci 5: 36–38.
- Radim B (2011) (Photo) electrochemical methods for the determination of the band edge positions of TiO2-based Nanomaterials. Adv Phy Chem.
- Valeria P, Elisa A, Stefano L, Gianfranco P, Elio G (2011)The photoactive nitrogen impurity in nitrogen-doped zirconium titanate (N-ZrTiO4): a combined electron paramagnetic resonance and density functional theory study. J Mat Chem.
- Elisa A, Cristiana V, Gianfranco P, Frédéric S, Stefano L, et al.(2015) Nature of paramagnetic species in nitrogen-doped SnO2: A combined electron paramagnetic resonance and density functional theory study. J Phys Chem 119: 26895- 26903
 Spanish
  Chinese
  Russian
  German
  French
  Japanese
  Portuguese
  Hindi
Hindi 