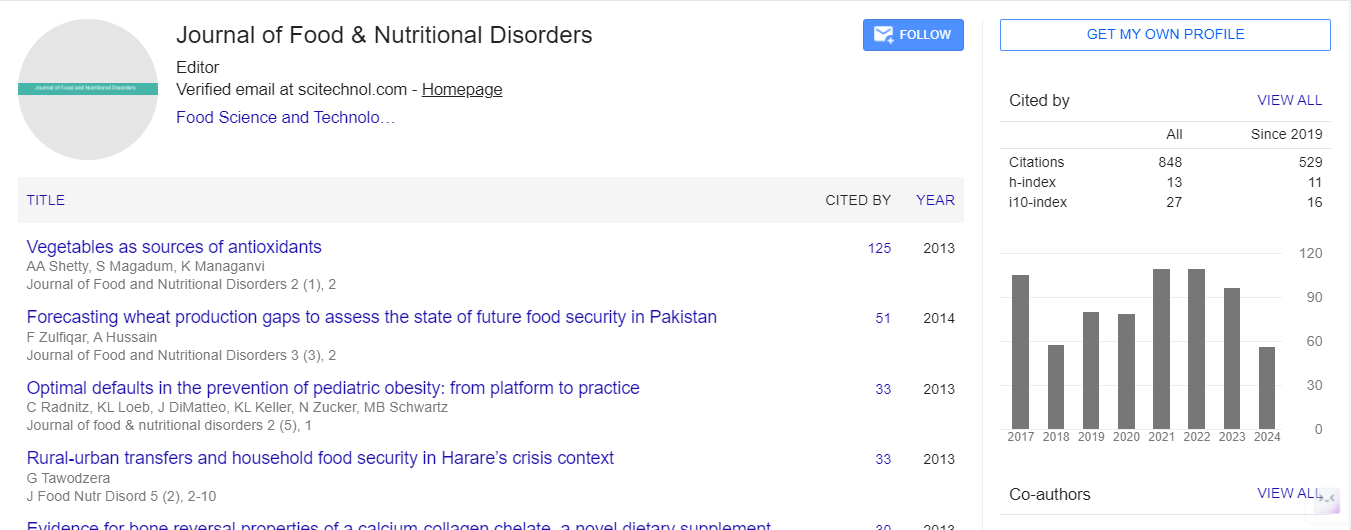
Spanish
  Chinese
  Russian
  German
  French
  Japanese
  Portuguese
  Hindi
Hindi Research Article, J Food Nutr Disor Vol: 5 Issue: 6
Unhealthy Food Commercials on Brazilian TV
| Keitiline R Viacava*, Reinaldo AG Simões, Ricardo Santolim, Gibson J Weydmann, Betina V Damasceno, Arthur W Tietze, Álvaro Vigo and Lisiane Bizarro | |
| Federal University of Rio Grande do Sul (UFRGS), Institute of Psychology, Experimental Psychology Laboratory, Neuroscience and Behavior (LPNeC), Brazil | |
| Corresponding author : Keitiline R Viacava
Federal University of Rio Grande do Sul (UFRGS), Institute of Psychology, Experimental Psychology Laboratory, Neuroscience and Behavior (LPNeC), Brazil Tel: (+55 51) 33085363 Fax:(+55 51) 33085470 E-mail: keitiline.viacava@ufrgs.br |
|
| Received: September 05, 2016 Accepted: September 29, 2016 Published: October 05, 2016 | |
| Citation: Viacava KR, Simões RAG, Santolim R, Weydmann GJ, Damasceno BV, et al. (2016) Unhealthy Food Commercials on Brazilian TV. J Food Nutr Disor 5:6. doi: 10.4172/2324-9323.1000210 |
Abstract
Unhealthy Food Commercials on Brazilian TV
Determining and monitoring the amount of unhealthy food commercials on TV is relevant to the prevention and control of obesity. The aim of this study was to determine the proportion of unhealthy food commercials on Brazilian TV and compare it with preexisting data on the frequency and quality of the advertised products. We recorded 14 hours of programming from the three basic Brazilian TV channels with the largest audiences (total=378 hrs.). Commercials were classified into 25 categories based on the type of product advertised. We compared the proportions of the types of commercials and types of food using the Pearson Chi-square test. Food commercials constitute the category with the second highest amount of airtime at 720 hours (9%), lagging behind the respective channels’ TV programming advertising at 1958 hours (26%). Compared with previous data from 2002, the proportion of food commercials on TV decreased by 12%. However, commercials for unhealthy food increased by 16%. These results have implications for the development of contingency plans and public policies aimed at reducing the risks of exposure to unhealthy food commercials on TV.
Keywords: Food commercials; Television; Unhealthy foods
Keywords |
|
| Food commercials; Television; Unhealthy foods | |
Introduction |
|
| The high density of unhealthy food commercial advertisements on television (TV) is one of the many environmental factors contributing to the rise in obesity. Individuals who spend higher amounts of time watching TV are particularly vulnerable, since the amount of hours of TV watched can by itself affect choice [1,2], as well as immediate [3,4] and subsequent consumption [5]. Positive associations between hours of TV watched and body mass index (BMI) were observed in children [6,7], such that kids who watched TV for longer periods showed higher levels of BMI. Watching TV also appears to predict higher BMI levels during adulthood [8]. Although fewer hours of TV watching in childhood predicted lower BMI in adolescence, the same was not true in adulthood [9]. A plausible explanation for the influence of TV on food consumption lies in the increased frequency of exposure to unhealthy food commercials [10-14]. Indeed, studies have shown that food commercials can affect consumption of any type of food available, not only the type that has been advertised [15,16]. Thus, the effects of commercials on energy intake may not only be a consequence of exposure to a specific product, but also of the generalization to another product that represents the same product category. These indications support the elaboration of content analyses and descriptive studies around the world, with the aim to keep track of the proportion of unhealthy food commercials on TV as a way to mitigate the risks of repeated exposure. Research on TV food commercials conducted in different countries (N=11, including Brazil) suggests that this type of commercial represents 11% to 29% of the total commercials released during TV programming [17]. Studies in South Africa [18], Australia [19], South Korea [20], Spain [21], England [22], United Kingdom [23], Singapore [24], Sweden [25], Switzerland [26] and Turkey [27] indicate that more than 50% of food commercials tend to promote products with low nutritional content [19,26], a figure which can exceed 80%, as observed in Turkey [27]. An inversion of the food pyramid (i.e., with the promotion of fats and sweets) was observed in the United Kingdom, which categorized a total of 66% of products in food commercials as unhealthy using criteria available in the NP Model or Nutrient Profile model [28]. In the United States, 9 out of 10 food commercials televised on Saturday mornings show commercial foods high in sodium, sugar, and fat, and generally low in nutritional content [29]. | |
| Brazil and other Latin American countries seem to follow this trend, with about 60% of the products shown in food commercials classified as fats, oils and sweets [30]. A study that analyzed nutritional content of advertised foods on five Chilean TV channels indicated that 78% of the commercials were either moderately unhealthy or unhealthy according to a European protocol (i.e., National Food Agency of the United Kingdom, FSAB) [31]. In Honduras, a similar study observed a total of 69% of TV food commercials advertising unhealthy food [32], i.e., food items that are high in calories, sugar, or fat [33]. In Brazil, however, the available data span the period from August 1998 to March 2000, and therefore need to be updated. Although a recent study looked at Brazilian TV food commercials targeted to children [34], little is known about the proportion of unhealthy food commercials targeted to the general public. Despite the provisions issued by the Brazilian Advertising Self-Regulation Code (Código Brasileiro de Autorregulamentação Publicitária, CONAR), which admonished the encouragement of excessive consumption and the belittling of healthy eating [35], studies that monitor the content of food commercials on TV remain incipient. Thus, this study aimed to determine the proportion of unhealthy food commercials on Brazilian TV and compare it with preexisting data on the frequency and quality of the advertised products. Another specific aim was to develop a database of ecologically valid commercial advertisements for conducting experimental studies. Because the methodology for this type of study has evolved over time, it was not possible to completely replicate the protocol adopted in the previous study [30]. Simultaneous and continuous recordings of the programming in different channels are examples of such developments, which differentiate the present study from the former. Another essential change resulted from the Food and Agriculture Organization’s–FAO [36,37] and the World Health Organization’s- WHO [38] recommendation to shift from classifying foods based on their nutritional content (e.g., Food Pyramid) to a simplified classification based on a set of guidelines. In this study we tried to adhere to this method by incorporating parameters established in the Dietary Guidelines for the Brazilian Population (Guia Alimentar para a População Brasileira), edition 2014 [39]. However, we also analyzed nutritional content using the Brazilian National Sanitary Surveillance Agency (Agência Nacional de Vigilância Sanitária, ANVISA) protocol in Resolution RDC No. 24/2010 [40]. | |
Methods |
|
| Data collection | |
| Our data consisted of recorded TV programming of the three open channels with the highest audience in Brazil, i.e., Globo, Record, and Sistema Brasileiro de Televisão (SBT), according to the global ranking published by the Brazilian Institute of Public Opinion and Statistics (Instituto Brasileiro de Opinião Pública e Estatística, IBOPE) [41], which is recognized as the leading institute in the measurement of TV and radio audience in Brazil and Latin America. Data was recorded using a Panasonic Digital Video Recorder (DVR), model DMR-ES10, and it consisted of recording of 14 hours of TV programming in each of the three channels, between 8AM and 10PM. | |
| The recordings were made during a period of one week and two weekends in June 2013. We selected this period in particular because it was considered relatively neutral for seasonal marketing campaigns (e.g., Christmas, Mother's Day). The media used for video recording were 81 optical discs type of Digital Versatile Disc (DVD) for up to 6 hours of recording, which was made simultaneously in the three channels. Subsequently, the advertised recorded data was carried out in a Microsoft Excel spreadsheet formatted according to the categories detailed below, which generated a database of ecologically valid commercial advertisements for experimental studies. | |
| The observation of commercials and the recording of data were made by eight research assistants (RAs) in a first round of data collection. The same RAs also participated as analysts in a second round of observation in which the recordings were exchanged. This procedure allowed the reconciliation of data in situations where the recording performed in the first round was not complete or sufficiently clear. | |
| Qualitative analysis | |
| The Dietary Guidelines for the Brazilian Population [39] were adopted as criteria for classifying the advertised food with regards to quality. This guide aimed to encourage healthier food consumption taking into account the characteristics of each population in each region. It presents four groups of food according to grade of processing as follows: 1) “raw food”, 2) “minimally processed”, 3) “processed foods”, 4) and “ultraprocessed foods”. The guide makes recommendations to eat raw or minimally processed foods, which are classified as “healthy foods”, and states that “processed foods,” especially those “ultraprocessed,” must be avoided as much as possible, as they tend to be “unhealthy” due to the industrialization processes applied. | |
| For a more detailed nutritional evaluation, the labels corresponding to the products advertised were selected and classified as "healthy" or "unhealthy" by ten nutritional sciences research assistants (RAs), who used objective parameters set by ANVISA in Resolution RDC No. 24/2010 [40] for the distribution of food products in Brazil. These criteria relate to levels of sugar, saturated fat, Trans fat, sodium, and nutritional content (Table 1). Disagreements between opinions were analyzed in a consensus meeting. For the purpose of this study, it is worth mentioning that although there were several attempts to suspend the RDC No. 24/2010 since its formulation [42], particularly at the request of the Brazilian Association of Food Industries (Associação Brasileira das Indústrias da Alimentação, ABIA), these requests have been withdrawn. According to ANVISA, to date, the RDC No. 24/2010 [40] is still current. | |
| Table 1: Nutritional Parameters as ANVISA Nº24/2010. | |
| Commercials were classified into three main categories: "food commercial" (solid or liquid, including soft drinks), "non-food commercial" (unrelated to food and with no food in the commercial) and "commercial of grocery stores". In the general category of “food commercial", the advertisements were classified as showing "solid food" or "liquid food". The general category of "non-food commercial" was classified into one out of the 24 selected non-food categories (Table 2). | |
| Table 2: Commercial Categories, Frequencies and Percentages. | |
| Quantitative analysis | |
| For the statistical analysis, the proportions of homogeneity test based on the Pearson Chi-square test was used to compare the proportions of the types of commercials and types of food. The Yate’s continuity correction for 2x2 contingency tables was used. Also, the standardized residuals were adopted to assess the local association in contingency tables. Confidence intervals for the major proportions of the study were calculated in order to have a reference for estimation of the statistics. All analyses were performed using the Statistical Analysis System (SAS), version 9.3, at a significance level of 5%. | |
Results |
|
| The collected data resulted in 378 hours of programming and N=7369 commercials released, recorded, and analyzed. Commercials for food products were the second most frequent category on TV, following commercials for entertainment (Table 2). The total number of commercials in the three channels was as follows: 2565 (34%) in SBT, 2431 (32%) in Record and 2372 (32%) in Globo. There was no difference between channels in the proportion of food commercials to the other types of commercials, with food commercials accounting for 9% of all advertisements, representing a decrease of 12% compared to the previous study [30]. Overall, there was no change in the proportion of food commercials during weekdays (p=.26), considering all five days (i.e., Monday to Friday) or channels. However, there was a decrease in the proportion of food commercials in the evenings (from 10.81% to 8.36%, p=.01), and was significantly different between Globo and SBT. | |
| On weekends, the frequency of food commercials was significantly higher in the morning and afternoon (12.4%) than in the evening (7.5%), p<.01. These differences were not observed during weekdays. Also on weekends, there was a tendency for releasing more food commercials compared with weekdays (10% vs. 9%), though this difference was not significant, p=.06 (Figure 1). | |
| Figure 1: Proportion of food commercials by type (healthy or unhealthy), channel, time, and day of the week. | |
| The percentage of unhealthy food commercials was 75%, indicating an increase of 16% compared to the previous study [30]. Within the “food commercial” category, 69% (CI 65% to 72%) of commercials advertised solid foods (e.g., chocolate bars, biscuits) while only 31% advertised non-solid (e.g., milk drink) foods. Comparing the times of day, commercials of solid foods predominated during the day, but were a little less frequent in the morning (59%) than in the afternoon (71%) and evening (73%), differences which were significant at p<.01. The “raw food” subcategory appeared rarely, comprising only 1% (95% CI: 0.35 to 1.88) of the released commercials, and only within the “grocery stores” category. | |
| In accordance with the Dietary Guidelines for the Brazilian Population (Brasil, 2014), the food sample was classified as ultraprocessed (99%), since the publicized food commercials were essentially meats and sausages, chocolate, soft drinks and hamburgers. With regards to the critics of the labels, using the ANVISA Resolution RDC No. 24/2010 [40], most products have saturated fat above the limits (54%), slightly fewer than half contained high levels of sodium (42%), and a quarter had elevated sugar levels (26%). Though less commonly, there were also products of low nutritional value (10%) and trans fat (9%). | |
Discussion |
|
| The aim of this study was to determine the proportion of unhealthy food commercials on Brazilian TV and compare it with preexisting data on the frequency and quality of the products advertised. The overall results from this study are consistent with previous records [17,30]. With regards to quantity, our findings showed that food commercials account for 9% of the total amount of transmitted commercials on TV which is not much lower than the previously observed international range of 11% to 29% [17]. Compared to the value of 22% obtained in the previous Brazilian study in 2002 [30], we found that 19% of the commercial advertisements were food-related, which is also surprisingly lower than previously recorded. However, even though there was a reduction in the proportion of food commercials released, our qualitative analyses indicated that the amount of unhealthy food commercials increased by 16% [30]. Our results suggest that a vast majority of food commercials advertised ultra-processed products (99%), which could be regarded as unhealthy, according to the Dietary Guidelines for the Brazilian Population [39]. Moreover, 76% of the food commercials violated the nutritional recommendations of ANVISA in Resolution RDC No. 24/2010 [40]. This figure was 16% higher than reported in the previous study, which used the Food Pyramid method for nutritional analysis [30]. Given that we adopted a different protocol, it is possible that the change observed in the proportion of unhealthy food commercials is more a consequence of the criteria adopted than a representation of an actual decrease in the quality of advertised food overtime. Future follow-ups could ascertain whether this is the case by adopting the same protocol used in this study. | |
| With regards to our quantitative results, there were no differences between the channels, both in relation to the total of overall commercials released, as to the percentage of food commercials. Commercials for food were equally distributed across the channels (i.e., Globo, Record, and SBT), for all times of day analyzed, and for all days of the weeks. Therefore, regardless of how the audiences of the channels may differ, individuals who spend higher amounts of time watching TV in Brazil tend to be similarly exposed to food commercials. Altogether, our qualitative and quantitative findings indicate that commercial advertisements for food are not only consistent, but also essentially encourage the consumption of ultraprocessed foods, which appears to infringe on the provisions issued by CONAR [35], thus deserving further considerations. One limitation of this study was that the analyses were restricted to the number of released commercials by title, and did not consider the amount of exposure (i.e., the duration or the repetition of each commercial). Another limitation was the limited standardization of data entry (e.g., spelling of products and brands), making it harder to carry out a statistical convergence analysis, and limiting the use of reentered data to specific reconciliations. Future studies could benefit from the creation of a legend of products and brands that could be adopted at the time of recording data. However, the creation of subtitles of this kind depends on frequent follow-ups of the advertised products. | |
| Despite these limitations, this study offers an update on the proportion of unhealthy food commercials on Brazilian TV. Due to the risks of increased energy intake as a consequence of repeated exposure to these advertisements, our results have implications to the prevention and control of obesity. They can help the development of contingency plans and public policies aimed at reducing exposure to unhealthy food commercials on TV. | |
Acknowledgement |
|
| This research was supported by the Coordenação de Aperfeiçoamento de Pessoal de Ensino Superior (CAPES) and the Conselho Nacional de Desenvolvimento Científico e Tecnológico (CNPq). | |
References |
|
|
|