Spanish
  Chinese
  Russian
  German
  French
  Japanese
  Portuguese
  Hindi
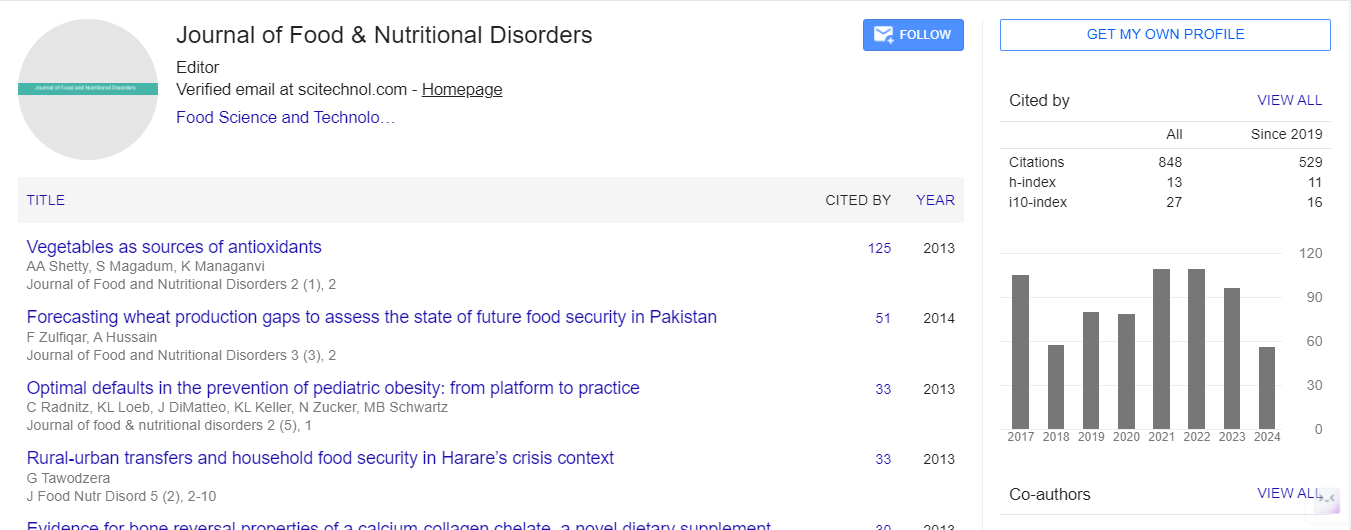
Hindi Research Article, J Food Nutr Disor Vol: 12 Issue: 3
A Practical Solution for Type 2 Diabetes Patients: Using Selected Sample Meal Photos to Provide Guidance to Type 2 Diabetes Patients Regarding their Choices of Daily Meals Based on the GHMethod: Math-Physical Medicine (No. 629)
Gerald C Hsu*
Department of Food Science and Human Nutrition, Arizona State University, Arizona, USA
*Corresponding Author: Gerald C Hsu, Department of Food Science and Human Nutrition, Arizona State University, Arizona, USA; E-mail: bmgch168@icloud.com
Received date: 22 March, 2022, JFND-22-57983;
Editor assigned date: 25 March, 2022, PreQC No. JFND-22-57983 (PQ);
Reviewed date: 08 April, 2022, QC No. JFND-22-57983;
Revised date: 23 May, 2022, Manuscript No. JFND-22-57983 (R);
Published date: 30 May, 2022, DOI: 10.4172/2324-9323.1000335.
Citation: Hsu GC (2022) A Practical Solution for Type 2 Diabetes Patients: Using Selected Sample Meal Photos to Provide Guidance to Type 2 Diabetes Patients Regarding their Choices of Daily Meals Based on the GH-Method: Math-Physical Medicine (No. 629). J Food Nutr Disor 11:6.
Abstract
In summary, his daily meals contain vegetables, particularly green leafy vegetables, as the main ingredient in his meal preparation, while using other food materials with rich protein and some fat as the supporting roles, such as fish, seafood, beef, pork, chicken, etc. These secondary and supplementary ingredients provide necessary nutritional balance of proteins and fat to satisfy our body needs. He purposely tries to either completely avoiding or only consuming a small amount of grain foods. Here, grain foods are defined as any food made from wheat, rice, oats, barley, cornmeal, or cereal grain. Examples of grain foods are bread, pasta, breakfast cereals, grits, tortillas, cooked rice, or noodles. On average, the combined carbs/sugar amounts from all different colored vegetables have about 1/2 or less than the carbs/sugar content from the same sized grain food. It should be noted that fruits are important to our health but we should eat moderate amounts each time to avoid the glucose surge.
Keywords: Spinach; Celery; Cabbage; Cucumber; Cauliflower; Tofu; Solid Egg; Liquid egg
Introduction
Since 1/1/2012, the author has collected his Body Weight (BW) in the early morning and finger-piercing glucose values four times daily, once in the early morning and two hours after each meal. He also accumulates other medical condition biomarker data, including Blood Pressure (BP), Heart Rate (HR), and blood lipids along with lifestyle details of diet, exercise, sleep, stress, water intake, and daily routine details. Through the use of a Continuous Glucose Monitoring (CGM) sensor device starting on 5/8/2018, he has gathered more CGM sensor glucose data at 96 times each day which include 28 data for Fasting Plasma Glucose (FPG) over a 7 hours’ sleep period, and 36 data for three Postprandial Plasma Glucose (PPG) from a 9 hours meal and post meal window [1].
Based on the collected big data, he further organizes them into two main groups. The first group is Medical Conditions (MC) with 4 categories: weight, glucose, BP, and blood lipids. The second group is Lifestyle Details (LD) with 6 categories: food and diet, exercise, water intake, sleep, stress, and daily routines. He collects his daily data and then applying both finite element method and geometric algebra to calculate a unique combined score for each MC and LD with their respective categories. The combined scores of these 2 groups, 10 categories, and 500+ elements constitute an overall “Metabolism Index (MI) model”. This MI model includes the root causes of 6 major lifestyle inputs (causes) and key biomarkers (symptoms) of 4 rudimentary chronic diseases, obesity, diabetes, hypertension, and hyperlipidemia [2].
As we know, lifestyle details not only cause those 4 rudimentary chronic diseases which further induce other complicated diseases, such as heart problems (CVD and CHD), Chronic Kidney Disease (CKD), stroke, neuropathy, foot ulcer, Diabetic Retinopathy (DR), hypothyroidism, diabetic constipation, diabetic skin fungal infection, and others. In addition to lifestyle induced chronic diseases and other complications, environmental factors, such as radiation, air and water pollution, food poison and pollution, toxic chemicals, and hormonal therapy, also contribute to the causes for a variety of cancers. For above mentioned lifestyle diseases, cancers and dementia, genetic conditions and lifetime unhealthy habits, such as cigarette smoking, over consumption of alcohol, or illicit drug use occupy approximately 15% to 25% of the root causes for these diseases [3].
Generally speaking, all of them fall into the “symptoms or outputs” category which are the end results from the “root causes or inputs” of poor and unhealthy lifestyles. As an overview, unhealthy lifestyle contributes around 60% to 80% for the above mentioned diseases.
During the recent 2+ year’s pandemic period, due to the concern of being infected with the COVID-19 virus, he has collected his Body Temperature (BT) and blood oxygen level from fingertip (SPO2) in the early morning, since 10/1/2020. Unfortunately, BT and SPO2 data have only been collected for the past shorter period of 1.5 year [4].
After providing an overview of human death from diseases, metabolism/immunity, and lifestyle, it is clear that lifestyle management is the key. Lifestyle management has four supporting foundations: food and diet, exercise, sleep, and stress. In terms of diabetes control, food is the most complicated and difficult aspect to manage. Everyone has to eat and most people enjoy eating; however, poor eating habits that include unhealthy foods and overeating can cause obesity and various chronic diseases. Therefore, food knowledge and meals are crucial to everyone. But, how many of us truly understand food nutrition along with their complex and close relationships with body health?.
This article provides a simple but crucial food and meal preparation guidance using some of the selected 41 meal pictures from his archive of 8,000 meal photos collected over a 7 years period from 5/1/2015 to 3/13/2022. He then chooses 9 meal categories that contain a total of 2,658 meal photos (about 1/3 of his total 8,000 meal photos) as the background material of this article. These 9 meals photo categories are 6 vegetable-based lunch+dinner, 2 eggs based breakfast, and 1 “bad” meal. Within each of these 9 categories, he has also listed the total number of meals, average carbs/sugar intake grams, average post-meal walking k-steps, and average finger-piercing PPG value (mg/dL) at 2 hours after the first bite of each meal [5].
The author avoids using nutritional terminologies such as calories, proteins, carbohydrates, and glycemic index, etc. that most diabetes patients have no knowledge of and with no interest in learning about. Hopefully, through his collected actual meal pictures, diabetes patients can learn how to control their glucoses through food preparation and meal ingredients and portions which is the initial step that is also difficult and important for most patients [6].
Applying food and meal control, he has successfully brought his glucose values from ~280 mg/dL (HbA1C at ~11) in Y2010 down to 109 mg/dL (HbA1C at 5.8) in Y2022 without taking any diabetes medication since 12/8/2015 [7].
This major accomplishment was achieved through his knowledge on diet control and persistent daily exercise. First, allow him to take care of the simple item which is the post-meal walking exercise. Since 2015, he has maintained a good habit of walking ~4 k-steps after each meal; therefore, his developed equation for the predicted PPG is listed as follows:
Predicted PPG (mg/dL)=body weight (pounds) in early morning × 0.5+(carbs/sugar grams) × 3.2-(post-meal walking k-steps=4.0) × 5
From the above equation, we can observe that there are three major variables influencing the PPG level, body weight, carbs/sugar amounts, and exercise. Incidentally, body weight is also closely related to food and exercise.
It should be mentioned that his body weight was 220 lbs. in Y2010, but his current body weight in the early morning has been maintained at 169 lbs. in Y2022 while his average post-meal walking k-steps is slightly more than 4.0 (4,000 steps). Therefore, the revised predicted PPG equation becomes the following:
Predicted PPG
= 169.2 × 0.5+(carbs/sugar grams) × 3.2-4.0 × 5
= 84.6+(carbs/sugar grams) × 3.2-20
= 64.6+(carbs/sugar grams) × 3.2
In year 2022, thus far, he has kept his average carbs/sugar intake amount around 14 grams, then his predicted PPG will be:
Predicted PPG
= 64.6+14 × 3.2
= 109.4 mg/dL
His measured CGM sensor daily average glucose is 108.9 mg/dL. Therefore, his predicted PPG has reached to 99.5% prediction accuracy. Table 1 shows the summarized data.
| 3/13/22 | ||||||||||
|---|---|---|---|---|---|---|---|---|---|---|
| Key Food Ingredient | Spinach | Celery | Cabbage | Cucumber | Cauliflower | Tofu | Solid Egg | Liquid Egg | >50 grams | Average |
| No. of Meals | 61 | 105 | 759 | 112 | 215 | 794 | 154 | 214 | 244 | 2,658 |
| Averaged PPG mg/dL | 113 | 106 | 110 | 109 | 109 | 109 | 115 | 107 | 162 | 114 |
| Carbs/Sugar grams | 14.4 | 13.1 | 14 | 13.4 | 14.1 | 12 | 3.8 | 3.9 | 72.5 | 17.3 |
| Walking k-steps | 4 | 4.7 | 4.4 | 4.3 | 4.4 | 4.6 | 4.5 | 4 | 4 | 4.4 |
Table 1: Table of summarized data.
Materials and Methods
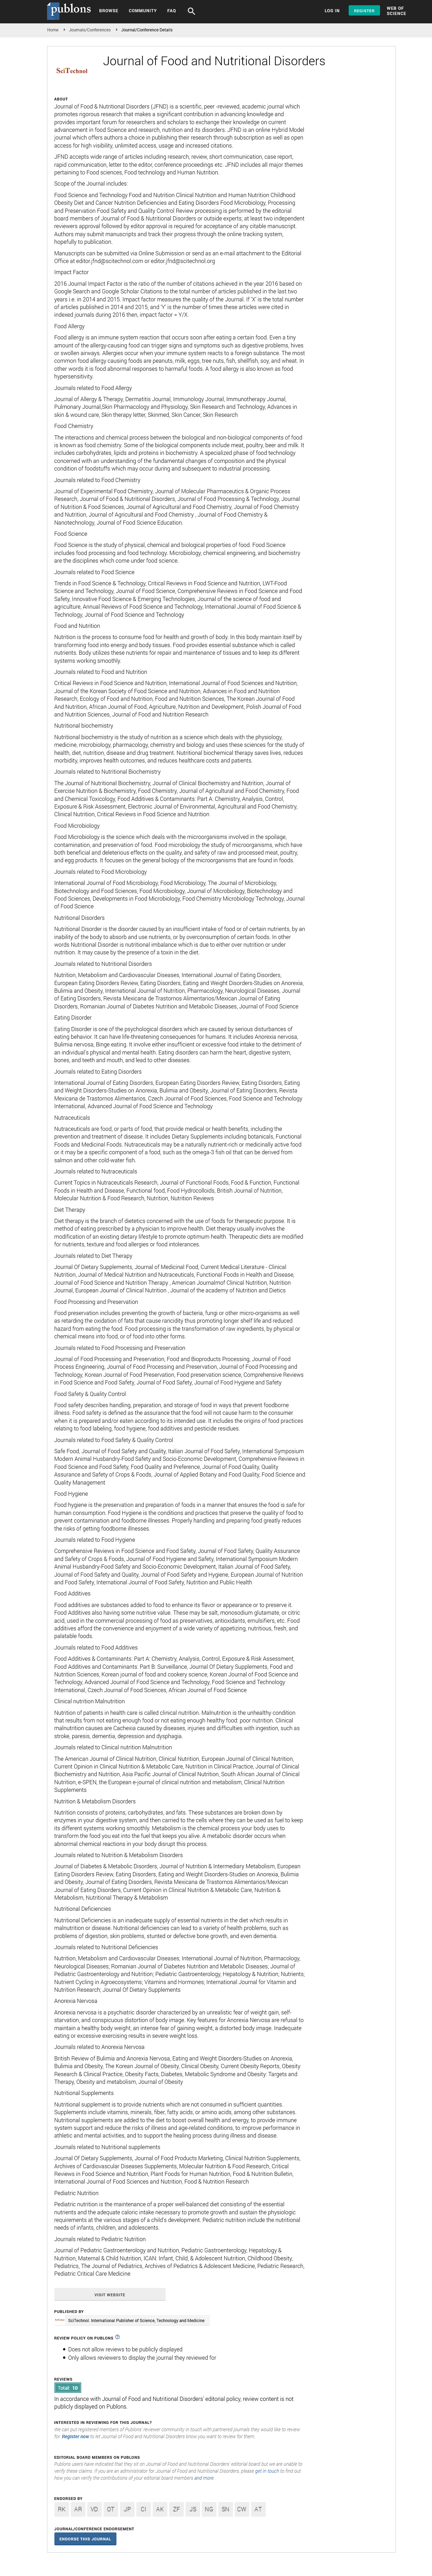
Food database: Starting in 2010, the author self-studied food nutrition and its relationships with four chronic diseases, including obesity, diabetes, hypertension, and hyperlipidemia.
He spent his first two years from 2011 to 2013 to build a large food database containing 6 million USDA (US government Department of Agriculture) cleaned-up and re-organized food nutrition data; and ~1.6 million re-organized franchise restaurant nutritional database from different public online sources.
Beginning on 5/1/2015, he has also kept all of his meal data with three meal photos per day. Using iPhone X as an example, each meal photo contains 12 mega (million) pixels. A pixel contains 8 bits (1 bytes) if it is in BW (Black and White). For colored images it uses a certain color scheme called RGB (Red, Green, Blue) represented as 1 byte each or 24 bits (3 bytes) per pixel. To date, he has already collected a total of 7,942 meal photos which have a total of ~95 billion pixels or ~2,287 billion bits digitized information of his total meal data (i.e. 7942 × 12,000,000 × 24). In a food or meal picture, each pixel represents a color point which carries a unique combination of multiple alpha-numerical digits (24 bits per pixel). From botany viewpoint, different food materials have different internal nutritional ingredients and different associated molecular structures, such as carbohydrates and sugar, which then display them through different exterior colors. Furthermore, from optical physics viewpoint, we also know that each color can be decomposed and represented by unique combination of optical wave characters, such as amplitude, period, wavelength, frequency, and phase. This is how the author can use those collected meal pictures and computer to solve this puzzle directly for determining the carbs/sugar amount contained inside of each meal. This kind of mathematical operation is indeed a typical case of “big data with AI” and “math-physical medicine” which requires math-physical knowledge and computer operations [8].
NI and AI: The author has defined a new terminology of natural intelligence as “NI” in comparison with the artificial intelligence or “AI”. AI uses brain to develop algorithm and computer to process data. NI uses human eyes to receive information and human brain to process information. Eyes receive information from observed food/meal picture, and then the brain processes this information using his learned and stored knowledge from his past study and research efforts.
He learned the subject of “machine learning” at MIT in 1973 before the term of “artificial intelligence” was even invented. Since 1979, he has dedicated most of his professional career on AI technology development and its various applications in different industry segments, including spending 14 years on the auto-design of semiconductor chips using sophisticated AI technology. It is his personal opinion that, at present or in the foreseeable future, human brain power is still superior to computer power, at least in the arena of logical judgment, emotional influences, and decision making. Therefore, he hopes that his NI-based PPG prediction results would be more accurate than his AI-based PPG prediction results. Of course, if there is a discrepancy of prediction accuracy between the NI and AI result, with continuous efforts to improve his AI algorithm, this discrepancy of PPG prediction accuracy will be shrunk to within a negligible range. One example is that, up to present time with his collected 7,942 meal pictures, his NI predicted PPG has 99.9% accuracy while his AI predicted PPG has 99.4% accuracy in comparison with the measured PPG values from 7,942 meal photos collected during past ~7 years from 5/1/2015 to 3/12/2022.
MPM methodology and tools: Since 2014, the author has conducted his research on metabolism and glucose, including both FPG and PPG. Initially, he utilized signal processing techniques of wave theory to decompose a synthesized glucose wave (i.e. curve of glucose data) into 19 sub-waves (influential factors) for PPG and 5 influential factors for FPG. He also calculated the contribution percentage of each influential factor of glucose. For example, he found that carbs/sugar intake amount contributes ~48% and post-meal exercise contributes ~32%, hot weather temperature contributes ~5%, and all of the remaining 16 factors contribute ~15% on PPG formation. He also identified body weight as the primary factor of FPG with a contribution ratio up to near 90%, cold weather temperature contributes ~5%, and the rest of the three factors contribute ~5% of FPG formation.
In early 2015, he developed an AI-based software product, eclaireMD Chronics, via computer software program in iPhone containing all of his learned knowledge of food nutrition and type 2 diabetes through math-physical medicine research methodology, his collected NI information from his food database, plus many other AI features, such as machine learning, auto-judging, and self-correction capabilities.
By using his developed MPM research approach, he could bypass the necessity of detailed learning and research work of botanical molecular structures and associated biochemical interactions between human organs and food ingredients. In other words, he can just apply engineering models and physics principles with the help of computer science and mathematics operations to bypass the traditional way of using biology, chemistry, and statistics to study a biomedical problem.
Based on his 13 years of diabetes research and these two different approaches of using AI and NI, he was able to develop a simplified and end user oriented APP, known as the “AI Glucometer”, for type 2 diabetes patients to use in their daily life.
Meal photos: Above-described paragraphs of food database, AI vs. NI, MPM tools, optical physics, and APP software can be too complicated for most of diabetes patients. Therefore, the author adopts a simple, direct, and easier approach to illustrate his diet control program.
He has collected 7,947 meals photos during a period of ~7 years from 5/1/2015 to 3/13/2022. Using a build-in search engine, he selects 8 key words to extract those related meal photos containing these following 8 main food ingredients, i.e. spinach, celery, cabbage, cucumber, cauliflower, tofu, solid egg, and liquid egg.
As he mentioned in the Introduction section, he uses vegetables as the main ingredient of his prepared meals. Please note that tofu is made from soy beans which has high protein and low carbs. He then uses red or white meats, eggs, seafood’s and poultry as secondary supporting ingredients (very low carbs/sugar but high protein). This kind of food and meal combinations have not only offered nutritional balance but also provided him the following desired carbs/sugar intake grams per meal and PPG levels in mg/dL:
- Spinach (61 meals):4 grams, 112.8 mg/dL
- Celery (105 meals):1 grams, 106.4 mg/dL
- Cabbage (759 meals):0 grams, 109.7 mg/dL
- Cucumber (112 meals):4 grams, 109.3 mg/dL
- Cauliflower (215 meals):1 grams, 109.3 mg/dL
- Tofu (794 meals):0 grams, 108.5 mg/dL
- Solid egg (154 meals) for breakfast:8 grams, 115.3 mg/dL
- Liquid egg (214 meals) for breakfast:9 grams, 106.8 mg/dL
The special category of “bad” meals was extracted out from his food and meals database by selecting a search range between 50 grams and 200 grams of carbs/sugar intake amount.
- Bad meals (9 sample meal photos): 244 meals, 72.5 grams, 161.5 mg/dL
It is clearly observed that a very high PPG level can be reached if he eats grain foods whether they are prepared in an oriental way or a western way. Fruit vitamins are important for our health needs, but we should eat them in a smaller amount each time and several times each day in order to avoid having glucose surges and “smooth out” the glucose curve to maintain a lower HbA1C level.
It should also be pointed out that the averaged PPG difference of 8.5 mg/dL between 115.3 mg/dL from 154 solid egg breakfasts and 106.8 mg/dL from 214 liquid egg breakfasts are resulted from his neuroscience study among four internal organs, stomach, brain, liver, and pancreas. Actually, the peak PPG difference from CGM sensor glucose results can be as high as 20 mg/dL to 25 mg/dL. Therefore, eating egg drop soups as his breakfasts could generate a lower PPG values with a smoother glucose fluctuations in comparison with consuming pan-fried eggs or hard broiled eggs as his breakfast choice.
Results and Discussion
Figures 1-9 display nine different categories of his meal photos: spinach, celery, cabbage, cucumber, cauliflower, tofu, solid egg, liquid egg, and “bad” meals.

Figure 1: Data and 4 meal photos of spinach.

Figure 2: Data and 4 meai photos of celery.

Figure 3: Data and 4 meal photos of cabbage.

Figure 4: Data and 4 meal photos of cucumber.

Figure 5: Data and 4 meal phots of cauliflower.

Figure 6: Data and 4 meal photos of tofu.

Figure 7: Data and 4 meal phots of solid egg breakfasts.

Figure 8: Data and 4 meal phots of liquid egg breakfasts.

Figure 9: Data and 9 meals photos of bad meals.
Conclusion
In summary, his daily meals contain vegetables, particularly green leafy vegetables, as the main ingredient in his meal preparation, while using other food materials with rich protein and some fat as the supporting roles, such as fish, seafood, beef, pork, chicken, etc. These secondary and supplementary ingredients provide necessary nutritional balance of proteins and fat to satisfy our body needs. He purposely tries to either completely avoiding or only consuming a small amount of grain foods. Here, grain foods are defined as any food made from wheat, rice, oats, barley, cornmeal, or cereal grain. Examples of grain foods are bread, pasta, breakfast cereals, grits, tortillas, cooked rice, or noodles. On average, the combined carbs/sugar amounts from all different colored vegetables have about 1/2 or less than the carbs/sugar content from the same sized grain food. It should be noted that fruits are important to our health but we should eat moderate amounts each time to avoid the glucose surge.
From the attached figures of his selected 41 meal samples, his average carbs/sugar intake amount from vegetable or egg based meals is around 14.0 grams or less (excluding the bad meals with 72.5 grams of carbs/sugar) which provides a low PPG level of 110 mg/dL (A1C<6). On the contrary, his bad meal samples include wheat flour pancake, flour or rice noodles, wheat and meat dumpling, whole-wheat sandwich with pastrami, pizza, macaroni and cheese, persimmons (very sweet), oranges and apples (moderate sweetness with excess intake), plums (8 pieces which is in excess), resulting in a high PPG level of 162 mg/dL (A1C>7).
Finally, the author would like to offer tips regarding food and meal preparation to diabetes patients:
- Avoid eating any grain food. If you include them in your meals, then limit the portion to 1/2 of a fist size for cooked grain food.
- You can mix multiple vegetables together (or secondary protein such as fish, egg, and poultry); however, the total food volume should not be more than a normal “flat” plate size.
- For the meal preparation or cooking process, please remember that no sugar, low salt, less oil, and avoiding processed food additives.
- Avoid or at least reduce the frequency of dinning out, since the focus for restaurant food is to attract their customers and not to fulfill the health needs for diabetes patients. The most dangerous part is that they add too much sugar in the food.
Using sample meal photos as a guideline for meal preparation, in combination with persistent post-meal exercise, diabetes patients can indeed reduce their body weight and glucose levels, similar to what the author has achieved. Amazingly, through this practice, diabetes patients can also self-repair their damaged pancreatic beta cells functionality for insulin production.
References
- Hsu GC (2020) Weight control trend analysis and progressive behavior modification of a T2D patient using GH-Method: math-physical medicine (No. 307). J Cancer Res Rev Rep 112:2-5.
- Hsu GC (2021) Glucose Control and Behavior Psychology of a T2D Patient using GH-Method: Mentality-Personality Modeling via Math-Physical Medicine (No. 306). J Diabetes Res Rev Rep 3:143.
- Hsu GC (2020) Biomedical research methodology based on GH-Method: math-physical medicine (No. 310). J Diabetes Res Rev Rep 128:2-8.
- Hsu GC (2020) Detailed GH. p-Modulus Values at 15-Minute Time Intervals for a Synthesized Sensor PPG Waveform of 159 Liquid Egg Meals, and 126 Solid Egg Meals Using Linear Elastic Glucose Theory of GH-Method: Math-Physical Medicine, Part 13 (No. 365). J App Mat Sci Engg Res 4:31-36.
- Hsu GC (2020) p-modulus study using both finger and sensor glucoses and linear elastic glucose theory of GH-Method: math-physical medicine, Part 16 (No. 370). J App Mat Sci Engg Res 4:56-61.
- Hsu GC (2020) Investigation of GH Modulus on the Linear Elastic Glucose Behavior Based on Three Diabetes Patients’ Data using the GH-Method: Math-Physical Medicine, Part 3 (No. 350). J App Mat Sci Engg Res 4:19-25.
- Waki K, Fujita H, Uchimura Y, Omae K, Aramaki E, et al. (2014) DialBetics: a novel smartphone-based self-management support system for type 2 diabetes patients. J Diabetes Sci Technol 8:209-215.
- Goyal S, Morita P, Lewis GF, Yu C, Seto E, et al. (2016) The systematic design of a behavioural mobile health application for the self-management of type 2 diabetes. Can J Diabetes 40:95-104.